I spent last week at #ieeevis representing @observablehq. On Thursday I walked around and asked people who influenced them, resulting in this graph. observablehq.com/@tophtucker/who-influenced-you
D3.js
D3.js (also known as D3, short for Data-Driven Documents) is a JavaScript library for producing dynamic, interactive data visualizations in web browsers. It makes use of Scalable Vector Graphics (SVG), HTML5, and Cascading Style Sheets (CSS) standards. It is the successor to the earlier Protovis framework. Its development was noted in 2011, as version 2.0.0 was released in August 2011. With the release of version 4.0.0 in June 2016, D3 was changed from a single library into a collection of smaller, modular libraries that can be used independently. More on Wikipedia
-
Observable reposted
TOoᴼᵒº˙⁰0₀ₒ.·ph
@tophtucker

-
Observable
@observablehq
Jonathan showing his base 1.1 log "pebble chart" (done in matviz) of photographs of vehicles parked in bike lanes submitted by users to "Bike Bureau" by @LoudBicycle
-
Observable
@observablehq
Visnu and Cai making a bike map. Issue is, Cai has a lot of folk wisdom from biking in Boston about which roads and areas are riskier, and that's harder to encode. #ieeevis
-
Observable
@observablehq
Met Hazim Bajamal yesterday, who has switched from being a profession Muay Thai fighter to doing AI research. Someone else said yesterday that they know multiple people who’ve switched from ballet dancer to engineer. #ieeevis
-
Observable
@observablehq
Talked to Jinrui Wang about her reflections arxiv.org/pdf/2604.20781 on working on “The UK Co-Benefits Atlas” — which used Plot! She had some labeling frustration with the library but couldn’t remember what it was… ukcobenefitsatlas.net #ieeevis
-
Observable
@observablehq
Talking to Fuling Sun about her great paper just presented at UIST last week on “MuTable: Composable and Reusable Table Transformations for In-Situ Data Exploration” arxiv.org/pdf/2609.19294 mutable-vis.github.io
-
Observable
@observablehq
Had a great first day. Observations:
Post not available here, view on X
Observable
@observablehq
Visnu spent a lot of the day at the table trying to solve Rummikub with a vision model he’s training, which worked very well to invite those great conversations.
Observable
@observablehq
People are still confused by the relationship between Observable and D3. See you tomorrow!! ^Toph
-
Observable
@observablehq
Panel discussion, “Visual Analytics in the Age of Autonomous Science”, considering the role of serendipity in science, advancing less often by “eureka” than by “oh, shit”, e.g. www.nytimes.com/2026/10/14/climate/coral-bleaching-healin… or Sandoz (now Novartis)’s discovery of LSD #ieeevis vaxautosci.org
-
Observable
@observablehq
A color space person came up to Visnu and said she’d played Hues and Cues at a color conference #ieeevis
-
Observable
@observablehq
“Mind Your νs and Qs: A Categorical Framework for Specifying Visualization Components”, by Hannah Aizenman et al. gugog-vis.github.io/2026/papers/pdf/aizenman-et-al.pdf #ieeevis
-
Observable
@observablehq
Discussing the non-overlapping worlds of visualization — scientific, computer graphics, academic data viz, news, to say nothing of Excel… #ieeevis
Observable
@observablehq
Has the Python visualization landscape changed since @jakevdp’s 2017 PyCon talk? Hannah here thinks basically not… speakerdeck.com/jakevdp/pythons-visualization-landscape-p…
-
Observable reposted
Karim Douïeb
@karim_douieb
One free option is to code it yourself by tweaking this @observablehq notebook observablehq.com/@observablehq/plot-marimekko
For paid, drag-and-drop options, you have @f_l_o_u_r_i_s_h flourish.studio/visualisations/marimekko-charts/ or @Datawrapper app.datawrapper.de/edit/U1vXG/visualize -
Observable
@observablehq
Gonna be rich #ieeevis
-
Observable
@observablehq
Cameron Yick at Datadog is thinking about whether agents are better at writing Vega-Lite JSON or JS #ieeevis
Post not available here, view on X
Observable
@observablehq
He's been making fish like Chernoff faces to encode a bunch of variables about internal libraries, like how big / growing / active they are (eyes go to sleep etc), can be animated etc to get like five more variables through there
Observable
@observablehq
Discussing notebooks and agents…
- microsoft.github.io/chartifact/
- enjalot.github.io/moonshine/
- plannotator.ai -
Observable
@observablehq
Gotta find @marimo_io and talk to them about Lens! marimo.io/blog/introducing-marimo-lens
-
Observable
@observablehq
We (@tophtucker and @visnup) will be at #ieeevis all week and tweeting a lot. Say hi!
-
Observable
@observablehq
Release notes:
- Switched from jsDelivr to esm.sh for consistent version resolution. observablehq.com/@observablehq/hello-esm-sh
- Plot has some new options. github.com/observablehq/plot/releases/tag/v0.6.18
- Expanded DuckDB and SQLite support, etc. observablehq.com/@observablehq/release-notes-2026-11-06 -
Observable
@observablehq
For #30daymapchallenge day 4, “Clusters”, Fil ported HDBSCAN to a notebook and wrote some examples. observablehq.com/@observablehq/hdbscan
-
Observable reposted
TOoᴼᵒº˙⁰0₀ₒ.·ph
@tophtucker
Took it very slow building up to a simple example. Learned about McCarthy’s `amb` operator. Beautiful and exciting library. observablehq.com/@tophtucker/hello-dragology
andrew blinn in NYC
@disconcision
Drag-and-drop makes the digital graspable, but building it well is fiddly enough that many don’t bother. Declarative Dragging (with Josh Horowitz & Jeff Heer, #uist2026 best paper award), lets you make an element draggable just by listing the states dragging it can reach.
This media couldn't be displayed. See it on the original post. -
Observable
@observablehq
People participating in #30daymapchallenge (30daymapchallenge.com):
@x00live observablehq.com/@xoolive/-/collection/30-day-map-challenge
geo-theo observablehq.com/@geo-theo/-/collection/30-day-map-challenge
@DeepaliKank observablehq.com/@deepalikank/pet-cats-in-uk-30-day-map-c…
@recifs observablehq.com/@visionscarto/-/collection/30daymapchall… -
Observable
@observablehq
Hello, @LeafletJS 2.0! @mourner writes: “Pure ES classes, fully tree-shakeable, first-class TypeScript types, faster rendering, much better accessibility, 40+ bugs fixed.” observablehq.com/@mourner/hello-leaflet-v2-0
Leaflet
@LeafletJS
🍃 1 year late, but finally here: Leaflet v2.0.0-beta.1 is out! ⚡️ Pure ES classes, fully tree-shakeable, first-class TypeScript types, faster rendering, much better accessibility, 40+ bugs fixed. Please please give it a try! github.com/Leaflet/Leaflet/releases/tag/v2.0.0-beta.1
-
Observable
@observablehq
3D population pyramid by Marc Thévenin of @InedFr. See distribution of ages in a given year, survival of a cohort across years, number of young people across years, etc. observablehq.com/@mthevenin/tests-pour-maj-du-wpp-de-l-on…
Observable
@observablehq
This is a kind of Lexis diagram (en.wikipedia.org/wiki/Lexis_diagram) inspired by Italian mathematician Luigi Perozzo’s 1879 visualization of Swedish census data from 1750 to 1875 (it.wikipedia.org/wiki/Luigi_Perozzo)
-
Observable
@observablehq
Top notebook this week is @awoodruff’s “Daylight Saving Time Gripe Assistant Tool” observablehq.com/@awoodruff/daylight-saving-time-gripe-as…
Observable
@observablehq
DST Wikipedia page seasonality by @yurivish, explained in observablehq.com/@yurivish/seasonal-spirals
-
Observable
@observablehq
Shout-out to @CYamahata, who over four years has made more than a hundred great notebooks on horology, astronomy, math, inverse kinematics, Monte Carlo simulation, signal processing… follow him! observablehq.com/@christophe-yamahata
This media couldn't be displayed. See it on the original post. -
Observable
@observablehq
“Seat projections for the 120-seat Knesset from 265 opinion polls published between January 1 and October 23, 2026, the last week before the vote”, by @recifs observablehq.com/@fil/israel-polls-2026
See also observablehq.com/@fil/share-to-win, observablehq.com/@tophtucker/whats-the-connection-between… -
Observable
@observablehq
Notebooks now come with a default @duckdb.org database so you can immediately start querying your file attachments or load something with read_csv.
Observable
@observablehq
(Oops, you can tell I copy-pasted this from Bluesky. —Ed.)
-
Observable
@observablehq
From @recifs: “Prediction markets didn’t see the far right’s Oct. 25 defeats coming.” observablehq.com/@fil/polymarket-fail
-
Observable
@observablehq
What do you learn from coding an explanation by hand vs. with Claude? Ricky Reusser has done a lot both ways; on the latest episode of our podcast, we compare one of each.
Watch: www.youtube.com/watch?v=7epnD2EdPFo
Subscribe: observablehq.com/podcastThis media couldn't be displayed. See it on the original post.
Observable
@observablehq
1. Toiletpaperfullerenes and Charmin Nanotubes (2020) observablehq.com/@rreusser/toiletpaperfullerenes-and-char…
2. Geodesics in Kerr Spacetime (2026) rreusser.github.io/notebooks/kerr-geodesics/ (self-hosted using Notebook Kit!) -
Observable
@observablehq
Recent improvements: automatic thumbnails for 2.0 notebooks; add collections and edit their metadata (but not yet their contents); speed up navigating your workspace; see recent comments across all your notebooks in one place. observablehq.com/@observablehq/release-notes-2026-10-23
-
Observable
@observablehq
You can now follow users to see their latest notebooks in the “Following” feed on your homepage. You’ll also get an email when they publish something. And we’ve consolidated the personal and community navigation so you see everything on that left sidebar. observablehq.com/@observablehq/following
This media couldn't be displayed. See it on the original post.
Observable
@observablehq
We previously introduced following in January 2023 and removed it the following January. We had our reasons, but broadly it was a mistake and we regret it. Fortunately, we still have the follow graph! So, if you’ve been around, your old follows are intact.
This media couldn't be displayed. See it on the original post. -
Observable
@observablehq
One thing we’re not planning to port from the old site is the Notion-style “add cell menu”. When introduced in 2022, the extra clicks caused friction and frustration, but many came to depend on it for enumerating possibilities. Today, with AI, it’s hard to justify such a list.
Observable
@observablehq
Original announcement x.com/observablehq/status/1529891228174757894
Example of past frustration github.com/observablehq/feedback/issues/427
and new relief talk.observablehq.com/t/something-i-really-love/10821
Observable
@observablehq
📣 New @observablehq product update
📊 Create faster with the Add Cell Menu
With Add Cell Menu just click ➕ or type ⌘cmd↩︎return to get started & you now have dozens of building blocks at your fingertips!
See how it works below.
Learn more here ➡️
observablehq.com/@observablehq/adding-cells
Observable
@observablehq
But we appreciate the discussion, and it remains interesting to consider the ways in which AI *doesn’t* satisfy the same needs. It’s far more expensive; it provides little taxonomy; and you don’t get finite iconographic representations of directions you could take.
-
Observable
@observablehq
Nice data sonification, made in Observable.
See also:
- DOM mutation observablehq.com/@mbostock/auralization-of-dom-mutation
- Simple chart observablehq.com/@maxblee/audible-visualization
- There’s a wild two-series sonification if you scroll to the bottom of this one observablehq.com/@datavizstudio/data-sonification-with-us…
- The g.o.a.t. archive.nytimes.com/www.nytimes.com/interactive/2010/02/2…
Muskeen
@SkeenSkeen01
What does the rise of $1B deposits on Aave V4 sound like? Listen to this chart 🔊 @aave
-
Observable
@observablehq
The agent can now read other notebooks, both public ones and your private ones. You can just paste a link, or create a collection called “Skills”; notebooks in a “Skills” collection get highlighted in the attachments menu. Here we demonstrate a very strict style guide.
This media couldn't be displayed. See it on the original post. -
Observable
@observablehq
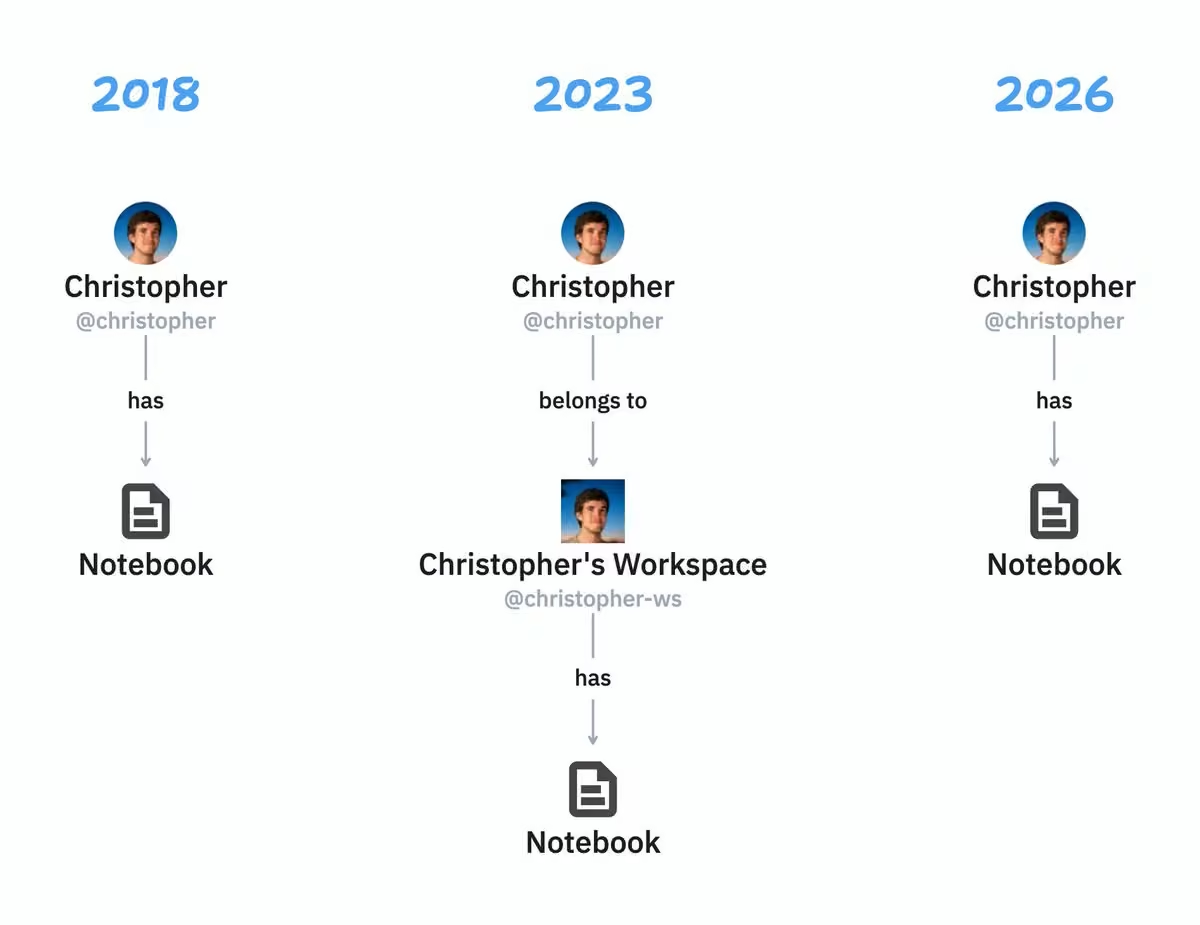
After notebooks 1.0 (2018–), we got inspired by @kepano’s 2023 stephango.com/file-over-app, leading to Framework (2023) and then Notebook Kit (2025), upon which we rewrote the site. Still stitching it together: you can now download your notebooks and open them in the desktop app.
Observable
@observablehq
If you “Export JavaScript”, you can e.g. publish that module to npm and import it back to a notebook:
import {hello} from "npm:example-observable-module" with {type: "observable"};
See observablehq.com/@observablehq/notebook-imports
Observable
@observablehq
We think web & desktop each have strengths & make different workflows ergonomic, so we’re not planning to try to sync notebooks back & forth. The web allows one-click publishing; desktop allows running Python against large or sensitive local files. Render unto Caesar…
-
Observable
@observablehq
Julio has a charming Zoom background full of books. In today’s podcast we test at random whether he’s read them.
YouTube: youtu.be/87iO4jUBa6M
Spotify: open.spotify.com/episode/5IjX94Ppg2exTceoWAh9sh
Apple: podcasts.apple.com/us/podcast/julios-bookshelf/id68208080…
RSS: feeds.transistor.fm/observable-podcastThis media couldn't be displayed. See it on the original post.
Observable
@observablehq
Julio cannot recommend “Strange Pilgrims” by Gabriel García Márquez, a 1992 collection of short stories (written decades earlier).
This media couldn't be displayed. See it on the original post.
Observable
@observablehq
People love bookshelves
-
Observable reposted
Christophe Yamahata
@CYamahata
Chech out the Pallweber Jumping Minute Mechanism in my newly published @observablehq notebook:
🔗 observablehq.com/@christophe-yamahata/pallweber-jumping-m…
#horology #watchmaking -
Observable
@observablehq
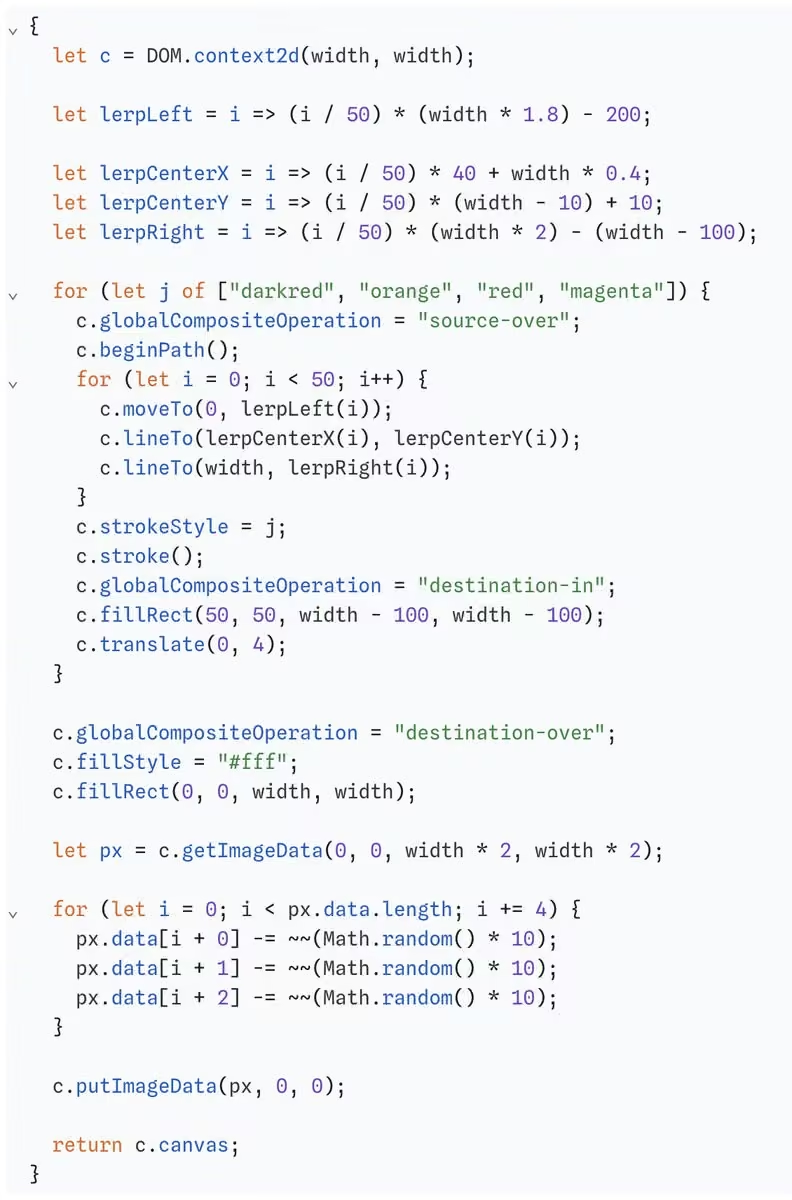
“Red Space”, @tmcw riffing on geometrydaily.tumblr.com, 2019
Observable
@observablehq
Implementation is quite elegant. This is it! observablehq.com/@tmcw/red-space
-
Observable
@observablehq
Talking about getting more engaged with irl visualization event scene… talking about maintaining a calendar of events or something. Would that be helpful? Seems like @DataVizSociety already has that well-covered: datavisualizationsociety.org/events/
-
Observable
@observablehq
October newsletter is going out. We wrote it Thursday, but customer.io optimizer suggested sending it at the start of the next week, so we said fine. But then Toph forgot to check it. So it was sent already stale; database/secrets management has shipped!
-
Observable
@observablehq
You can now configure databases observablehq.com/team/select?path=/databases and secrets observablehq.com/team/select?path=/secrets within the new Observable. Paste a database URI in the “Host” field and it will populate all fields at once.
Release notes: observablehq.com/@observablehq/release-notes-2026-10-02
Observable
@observablehq
You can also now attach databases to your chats so the agent can help you explore them.
In this example, @RfamDB is an open-access database of RNA families: docs.rfam.org/en/latest/database.html -
Observable reposted
Zack Labe
@ZLabe
We have some new interactive climate data visualizations through @observablehq: observablehq.com/@climatecentral/-/collection/climate-ser…. Hope they are useful, and feel free to share!
-
Observable
@observablehq
You can now create and manage teams in the new Observable, use Opus 5.5, connect to MySQL… but, most exciting, and by far the most overdue: you can now access SQL cells’ metadata fields by opening the cell menu with ⌃M. Keep those hands on that keyboard! observablehq.com/@observablehq/release-notes-2026-09-25
Observable
@observablehq
This has been an issue since we introduced SQL cells in 2021 & was exacerbated by later “UI cells”. Pressing tab inside the cell editor inserts spaces; pressing ⌥tab focuses the next cell. But we never adding keybindings for focusing controls outside / “in-between” cell editors.
-
Observable reposted
Raghav Agrawal
@impactology
One more UI pattern you can try out to enable your users to test their hypothesis by querying sections of your code, brushing with coordinated views
old.observablehq.com/blog/linked-brushing
Continuously modify a query and immediately change the visualization with coordinated views. Solves the problem of “I have a large or continuous information space. Let me manipulate the question directly and immediately see what changes.” -
Observable
@observablehq
We hope this tweet finds you… like, at all. “Submarine cables laid in the bottom of the Earth’s oceans”, visualized by @vastur observablehq.com/@vasturiano/submarine-cables
This media couldn't be displayed. See it on the original post. -
Observable
@observablehq
Pack four mirrored spheres inside the four walls of a tetrahedron (a pyramid). Paint the walls red, green, blue, and white. Then shoot rays out of your eyes. As they bounce, you find that the regions colored each color all somehow share a coastline. observablehq.com/@nxrix/wada-basins
Observable
@observablehq
The concept of three lakes somehow all sharing a coastline was introduced by Kunizō Yoneyama in his 1917 “Theory of Continuous Set of Points”; he said the idea was suggested by Takeo Wada. Hence, “Wada basins”. en.wikipedia.org/wiki/Lakes_of_Wada
Observable
@observablehq
Also looks good in CMYK. observablehq.com/d/af95f28e8796f8d6
-
Observable
@observablehq
When you make a notebook on your own, does it belong to YOU, or to a kind of “shell company” set up in your name? It was once the former. Then, like many SaaS platforms, we moved to treat every individual as an on-ramp to a team account. We’re going back. observablehq.com/@observablehq/a-better-individual-experi…
-
Observable
@observablehq
Stephan Schiffels, @stschiff, a researcher who sometimes uses principal component analysis for genetics, here illustrates the concept using EU flags. observablehq.com/@stschiff/pca-of-flags
-
Observable
@observablehq
New podcast: Last week, we launched a total rewrite of notebooks. Contra @spolsky’s advice, @mbostock has done many rewrites, from TiVo to Protovis to D3, and itches to do many more. Why? www.youtube.com/watch?v=oP1RxdJo40w
Observable
@observablehq
(Notice that the Observable Podcast is not afraid of dead air! Take a few seconds, breathe, relax!)
Observable
@observablehq
What was Mike’s first rewrite?
This media couldn't be displayed. See it on the original post. -
Observable
@observablehq
Fetch and query caching both use our new programmatic file attachments: observablehq.com/@observablehq/programmatic-file-attachments
Great to have, but use judiciously; there are tradeoffs. Caching is ~hidden state that can make notebook behavior harder to reason about. Hence one of the two hard problems in CS…
Alf Eaton
@invisiblecomma
Great to see that fetches can be cached to a file attachment in @observablehq now, so anyone can view the notebook with saved data.
observablehq.com/@observablehq/fetch-caching -
Observable
@observablehq
Simulation of binary black holes.
Original concept by Jeremy Schnittman and Brian P. Powell svs.gsfc.nasa.gov/13831
Relativistic GLSL ray-tracing notebook by @NxrixWasTaken observablehq.com/@nxrix/binary-black-holes
Added starfield and orbit controls by @LaoTzunami observablehq.com/d/cca8d2013f28cb8f -
Observable
@observablehq
Lots of fixes/improvements since Tuesday’s relaunch: DatabaseClient backwards compatibility, BigQuery, more granular permissions, more prominent query cache ages, paste/drop files into editor. We’re sorry for the disruption and grateful for your feedback! observablehq.com/@observablehq/release-notes-2026-09-04
Observable
@observablehq
Since Friday: show spinner for loading cell; export cells to CSV, JSON, HTML, CSS, text, Arrow; drag and drop onto files panel; notify when mentioned in a comment; reload clients older than skew protection; fix logging into old site with certain accounts.
-
Observable
@observablehq
Short compelling notebook by @paulchaikin: when @CP3 joined a team, their win percentage went up. observablehq.com/@pamacha/when-chris-paul-arrives
-
Observable
@observablehq
For more than a year, we’ve been quietly building an all-new Observable. Today, that new Observable is live on observablehq.com. Read @mbostock’s announcement: observablehq.com/@observablehq/a-new-observable
Post not available here, view on X
Observable
@observablehq
Finally, read Mike verbatim on “why we continue to pour our heart and soul into this”:
Observable
@observablehq
The new site is live at observablehq.com. The old site lives on at old.observablehq.com.
Discuss in the forum talk.observablehq.com or email support@observablehq.com. Thank you! -
Observable
@observablehq
When we developed Observable Plot in 2021, it was most notably “easier” than writing D3. When our agent writes Plot today, it is most notably “more coherent” (concise, compact, consistent) than having it write D3.
Keenan Crane
@keenanisalive
Yes… and we were making diagrams like this a few years ago, without any AI / LLM help, much faster and with more user control, via @UsePenrose:
penrose.cs.cmu.edu
minarcik.com/minkowski-penalties/
But it's not an either-or:
You are always going to get more mileage out of LLMs (using fewer tokens…) by configuring well-designed APIs, domain-specific languages, etc. (Penrose, Three.js, etc.), than asking it to build something from scratch in a low-level language (Vulkan, SVG, TikZ, etc.).
Observable
@observablehq
See also good discussion on this thread bsky.app/profile/domoritz.de/post/3mmtn57txjs2z
-
Observable
@observablehq
Helping people with notebooks is always a joy in that it teaches us about their domain. Jonathon Keeney had a random support question and ended up teaching us how the human genome incorporates something like git branching.
Post not available here, view on X
Observable
@observablehq
We were struck by how much goes into one chart and our call went way over. Also, we learned that we have a redirect loop in some cases where you’re changing your account’s email and logging in by email. And a focus trap on the cell toolbar. And UX confusion with pinned/hidden.
Observable
@observablehq
See? Read notebooks, write notebooks, learn about the world. Use Observable today! new.observablehq.com/public
-
Observable
@observablehq
Missing Wednesday’s or planning your next eclipse? new.observablehq.com/@christophe-yamahata/solar-eclipses
-
Observable
@observablehq
Good stuff. Even if it’s Jupyter we’ll always support linking to the notebook: github.com/echostack-org/echopype-examples/blob/main/note…
world’s #1 tomato larper 🍅🪶
@SquashFold
The might be the best graph I’ve ever seen in my life
-
Observable reposted
Jules Blom
@Mega_Jules
Also because NS is introducing service lines this year I had to do a version which includes those.
View the (literate) code and read more about the process in the @observablehq notebooks where I made 'm.
observablehq.com/@julesblm/ns-line-diagrams
observablehq.com/@julesblm/better-ns-line-diagrams -
Observable reposted
Mathieu Jouhet
@daformat
This reminds me of the technique I used and explain in my how to round svg polygons @observablehq notebook:
Mathieu Jouhet
@daformat
Learn how to round polygon corners with svg + js on @observablehq
I was curious to find out how to do this, so I did :)
On the way you'll learn about vectors, drawing svg arcs and circles using cubic bézier, and some geometric thinking, enjoy!
observablehq.com/@daformat/rounding-polygon-corners -
Observable
@observablehq
Notebook Kit 2.2.0 replaces the typescript dependency with @sveltejs/acorn-typescript, bringing the package’s minified & gzipped size down from 1 MB to 71 kB. github.com/observablehq/notebook-kit/releases/tag/v2.2.0
-
Observable
@observablehq
We’re at 199,950 public notebooks. Gonna need fireworks or something in a bit… new.observablehq.com/public
-
Observable reposted
Zack Labe
@ZLabe
More of our collection of interactive graphics on changes in greenhouse gases and global temperature: observablehq.com/collection/@climatecentral/climate-services through @observablehq. Feel free to download and share them!
#climatechange #dataviz #scicomm #opendata -
Observable
@observablehq
With the memory bottleneck driving up the cost of compute, enterprises are trying to control costs. Save money with François Viète’s c. 1600 technique for the manual digit-by-digit calculation of square roots, explained & visualized here by @CYamahata: new.observablehq.com/@christophe-yamahata/square-root-by-…
-
Observable
@observablehq
In our latest podcast, Toph recounts seven moments in visualization history, including 1923’s gestalt theory, 1933’s map–territory relation, 1973’s conversation analysis, and 1975’s splines. www.youtube.com/watch?v=8TV21Wzv7WM
-
Observable
@observablehq
“Cover a sphere with equally spaced dots” — original notebook by Jim Bumgardner, recently forked and fixed by John Wiseman. new.observablehq.com/d/15e996683f22a95f
Observable
@observablehq
Not to be confused with randomly sampling points from the surface of the sphere, itself the subject of several notebooks:
- new.observablehq.com/@mbostock/random-points-on-a-sphere
- new.observablehq.com/@jrus/stereorandom
- new.observablehq.com/@rreusser/equally-distributing-point… -
Observable
@observablehq
Here @LaoTzunami “visualizes datasets and their inner joins with proportional Venn diagrams.” new.observablehq.com/@laotzunami/visual-data-join-matrix
-
Observable reposted
無異
@taekie
와. 적도 바다의 해수면온도가 이례적으로 높은데.
1. 그냥 온도로 그리면 티가 안나니
2. 편차로 그리기도 하는데. 뭐 0.5도로 뭔 호들갑인가 싶음.
3. 그래서 표준표차로 보여줬는데 (3시그마를 벗어나면 0.3%)
👉4. 데이터는 그냥 온도로, 그리드를 표준편차로 휘어서 보여줌 👀
#정보디자인
Observable
@observablehq
Here @recifs reproduces @EliotJacobson’s chart, using warped gridlines to represent both the absolute temperature and the deviation from the historical mean for each day of the year. new.observablehq.com/@fil/godzilla-el-nino
Prof. Eliot Jacobson
@EliotJacobson
Breaking News!
Code: y-axis alert.
Nino 3.4 SST is now up to 3.63 SD above the 1991-2020 baseline, about 1-in-7000 in the absence of anthropogenic warming.
There's not enough room in a single post to express just how crazy this is. Please read:
climatecasino.substack.com/p/some-monsters-are-real -
Observable
@observablehq
Here @recifs reproduces @EliotJacobson’s chart, using warped gridlines to represent both the absolute temperature and the deviation from the historical mean for each day of the year. new.observablehq.com/@fil/godzilla-el-nino
Prof. Eliot Jacobson
@EliotJacobson
Breaking News!
Code: y-axis alert.
Nino 3.4 SST is now up to 3.63 SD above the 1991-2020 baseline, about 1-in-7000 in the absence of anthropogenic warming.
There's not enough room in a single post to express just how crazy this is. Please read:
climatecasino.substack.com/p/some-monsters-are-real -
Observable
@observablehq
In our latest podcast, @tophtucker & @visnup explore the new community listings & nice touches in our new editor. (You can make a notebook in one click instead of three. Mousing over the left gutter doesn’t flash five buttons. Files work with versioning.) www.youtube.com/watch?v=4uDea3lK3Go
-
Observable reposted
Michael Friendly @datavisfriendly.bsky.social
@datavisFriendly
Use case: #history often needs to be viewed this way
Observable
@observablehq
Wouter Schreuders made a scale that’s linear in the (foveal?) middle and logarithmic in the periphery, for exploring enormous ranges without losing concrete proportional grounding. observablehq.com/@wouter-d3/adaptive-piecewise-scale-keep…
His reflections on the development process: wouterschreuders.com/adaptive-scale -
Observable
@observablehq
Wouter Schreuders made a scale that’s linear in the (foveal?) middle and logarithmic in the periphery, for exploring enormous ranges without losing concrete proportional grounding. observablehq.com/@wouter-d3/adaptive-piecewise-scale-keep…
His reflections on the development process: wouterschreuders.com/adaptive-scale -
Observable
@observablehq
“I was surprised by how plainly pregnant I was in the data.” @SangyuXu chronicles pregnancy, recovery, and weaning via her Apple Watch in this blog post embedding graphics from a notebook: xusangyu.com/blog/08_apple_watch.html
-
Observable
@observablehq
Here @NxrixWasTaken extends Plot with a custom mark rendering GLSL shaders to demonstrate domain coloring for complex-valued functions new.observablehq.com/@nxrix/domain-coloring
-
Observable
@observablehq
Here @MonicaRizzolli describes her artwork “Forma e Fórmula”. Inspired by Johan Gielis’s “superformula” — a generalization of the superellipse — she developed a “curatorial interface” for curves and a “herbarium of generative flowers” new.observablehq.com/@dac4b2f6fec5f174/forma-formula
-
Observable
@observablehq
A lovely map-slash-timeline of upcoming World Cup matches, designed for pen plotter by @ehouais. observablehq.com/@ehouais/world-cup-data-viz
Observable
@observablehq
Now with a visualization of the “Golden Boot” race for the most goals, with nice cross-hatched portraits.
-
Observable reposted
TOoᴼᵒº˙⁰0₀ₒ.·ph
@tophtucker
Updating the D3 “connected scatterplot” example (showing vehicle-miles driven per person per year against cost per gallon, after @hfairfield) with data past 2010 highlights a challenge with the visual form: self-intersection. new.observablehq.com/@tophtucker/connected-scatterplot-dr…
-
Observable
@observablehq
Here @NxrixWasTaken renders… what exactly? 😅 Slices of a Julia fractal? new.observablehq.com/@nxrix/hypercomplex
-
Observable
@observablehq
Antoni Gaudí, who died one hundred years ago today, picked up a fondness for the catenary — the hyperbolic cosine, the shape of an idealized hanging chain — working on suspension bridges. observablehq.com/@toja/catenary
-
Observable
@observablehq
We’ll try to do our part. Here it is reproduced in a notebook, with a parquet file of the underlying million z-statistics. observablehq.com/@tophtucker/the-significance-filter
Ian Quigley
@allmeasures
I'm on a mission to make this plot as publicly recognizable as the one with the holes in the WW2 airplane
Observable
@observablehq
There’s probably already a notebook for most such famous recognizable plots. What would be in your canon? Keeling curve, Anscombe’s Quartet, Snow’s cholera map…
-
Observable
@observablehq
Observable Plot hit >100k daily downloads yesterday for the first time! Literally “off the chart”! (Because we set the maximum of the y domain to the 99.5th percentile in order to occasionally give ourselves this satisfaction.) Congrats to Mike and Fil! observablehq.github.io/oss-analytics/@observablehq/plot
Post not available here, view on X
Observable
@observablehq
Some great D3 packages also booming. d3-array, d3-shape, d3-scale — love it, makes sense. We’re more surprised by the similar boom in d3-time-format, which — though also a classic! — has long since been largely obviated by Intl.DateTimeFormat & its ilk. observablehq.github.io/oss-analytics/
Observable
@observablehq
Ah, you ask, but how does that compare to the baseline growth of *all* npm packages (below)? Still relatively strong.
-
Observable
@observablehq
In 1943, Patrick Abercrombie wanted to describe “a general plan for creating ‘new towns’ but didn’t have the authority to designate specific sites for redevelopment. So, he decided blobs would do the trick.” Matt Khinda recreated the “potato plan” in D3: observablehq.com/@mpkhinda/d3-potato-plan
-
Observable
@observablehq
“Data viz” is short for “Data vizualisation”
-
Observable
@observablehq
Congratulations to Pluto (reactive computational notebooks for Julia) on releasing version 1.0! 🎂discourse.julialang.org/t/pluto-1-0-release/137296
-
Observable
@observablehq
In March, the U.S. Department of Homeland Security waived the Jones Act, which says only U.S.-made ships can ship between U.S. ports. The waiver stipulates that vessel movements be publicly disclosed. @LaoTzunami mapped them; they’re most commonly gasoline observablehq.com/d/3a87558830e6537f
-
Observable
@observablehq
“[O]ur model is not the sphere, which is no greater than its parts, where every point is equidistant from the centre… Instead, it is the polyhedron, which reflects the convergence of all its parts, each of which preserves its distinctiveness.”
Explore: observablehq.com/@pamacha/platonic-gobstopper
Observable
@observablehq
That’s by @paulchaikin. Or here’s one by Mark McClure, showing cutting a polyhedron into a net. observablehq.com/@mcmcclur/unfolding-polyhedra
There are eleven ways to unfold a cube, which he collects here: observablehq.com/@mcmcclur/the-eleven-unfoldings-of-the-cube
Observable
@observablehq
See also @makio135’s “Polyhedrons & lasers” observablehq.com/@makio135/polyhedrons-lasers and Platonic solids lineup observablehq.com/@makio135/platonic-solids, or @mootari’s exploration of @ProfStemkoski’s polyhedra npm package observablehq.com/@mootari/polyhedra, which in turn pulls from George W. Hart’s Encyclopedia of Polyhedra
-
Observable
@observablehq
In this notebook, @LaoTzunami visualizes a state space of possible chart types and transitions among them along defined edges. Transitions between unconnected types are achieved by routing through intermediate types. observablehq.com/d/3c8b082818efd7c9
Observable
@observablehq
This resembles some of the transition diagrams in @jeffrey_heer’s classic “Animated Transitions in Statistical Data Graphics” idl.uw.edu/papers/animated-transitions, but makes the diagram itself an interface for constructing the chart.
Observable
@observablehq
Also don’t miss that you can click on edges and adjust their easing, e.g. to make them all linear and fast so there’s no pause between successive transitions.
-
Observable
@observablehq
.@_mattneary wrote a couple notebooks about this
- observablehq.com/@mattneary/optimal-gambling
- observablehq.com/@mattneary/optimal-gambling-two
Dr. Dad, PhD 🔄🔼◀️🔽▶️
@GarrettPetersen
The Kelly criterion says you should take green if your net worth is over $10k.
-
Observable
@observablehq
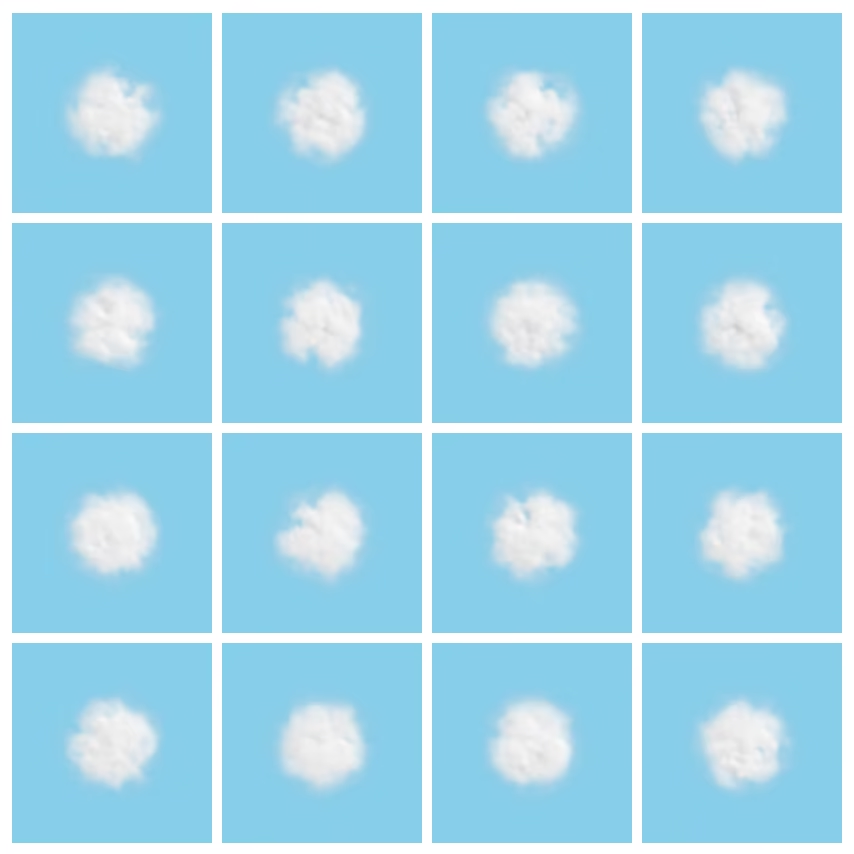
Here @theohonohan ported Ken Perlin’s classic “vpuff” generative cloud Java applet mrl.cs.nyu.edu/~perlin/experiments/vpuff/ to a notebook. observablehq.com/d/64d440b67e73fd1b
-
Observable
@observablehq
Matt Khinda’s notebook compares 311 service requests and DOT pothole work orders (from opendata.cityofnewyork.us) to explore the decline in pothole reports; the seasonality; the geographic distribution; and the first 100 days of the last three mayors. observablehq.com/@mpkhinda/nyc-pothole-politics
-
Observable
@observablehq
“Agentic Visual Reporting” by @peter_gyarmati & @domoritz, winner of the IEEE VISxGenAI 2025 Workshop Challenge, used agents to analyze / visualize / describe & assembled it all using notebook-kit, our new open-source foundation… among MANY other things! peter-gy.github.io/VISxGenAI-2025/
Observable
@observablehq
Learn more about notebook-kit: observablehq.com/notebook-kit/kit
-
Observable
@observablehq
Huh…
“Plot.lens prototype”, by dleeftink observablehq.com/@dleeftink/plot-lens-prototype -
Observable
@observablehq
Here @meetamit reproduced @3blue1brown grids with Plot: observablehq.com/@meetamit/logarithm-of-an-image
Try fiddling with it. Plot’s raster mark is like a non-GPU shader; it takes a function of x and y that returns anything a color scale accepts. Here we change return value from a number to CSS colors:
Observable
@observablehq
Instead of taking the function of x and y, the raster mark can also interpolate spatial samples. See documentation: observablehq.com/plot/marks/raster
-
Observable
@observablehq
We’ve started a weekly podcast, which for now is just a YouTube playlist: www.youtube.com/playlist?list=PLOHIJAFwtkEdRcO2a2gOO0nDfi…
In episode 0, Mike & Toph discussed Next.js & the increasing difficulty of discerning whether a line of code is going to run on the server or on the client www.youtube.com/watch?v=B2BFi3SyQM4Post not available here, view on X
Observable
@observablehq
In episode 2, co-CEOs Mike & Julio revisit Mike’s founding essay “A Better Way to Code” (2017), the mission of a computational medium, and what’ve learned from GitHub’s motto of “social coding”, in light of AI. www.youtube.com/watch?v=0uBOL9NP8Iw
Observable
@observablehq
In episode 3, Toph & Visnu reflect on three eras of building Observable features atop LLMs, from a RAG-driven notebook sidebar (2023) to a low-code–focused Canvases (2025) to a new experimental prototype, Observable Chat. www.youtube.com/watch?v=K_zzviwj8UA
-
Observable
@observablehq
Verifiable, spatial AI can help you get you from big, complex data to trusted insights — faster. Learn about Observable's approach to AI 👉 observablehq.com/about
-
Observable
@observablehq
At Observable, we think rich, interactive charts shouldn’t be limited to expert developers. That’s why the Observable Canvases chart library includes advanced features like visual filtering, responsiveness, & extreme value handling by default. Learn more 👉old.observablehq.com/blog
-
Observable
@observablehq
🚀 Now in Observable Canvases: AI-powered text-to-SQL, right in the SQL node. Generate and edit queries that you can inspect with clear visual diffs, so there's never a doubt about what's happening with your code. Learn more and see the updates in action: old.observablehq.com/blog/draft-and-customize-queries-eve…
-
Observable
@observablehq
Visual data exploration can uncover patterns and questions in business data. But big data can bring charts to a crawl, which disincentivizes exploration and hinders insight discovery. Learn how we deliver rich, performant charts in Observable Canvases 👉 old.observablehq.com/blog
-
Observable
@observablehq
Agropatterns relies on AI to process & uncover insights in crop monitoring data. When small mistakes can be catastrophic for crop health, trust in AI outputs is critical. Learn how we keep analysts confident and in control with verifiable AI in Observable: old.observablehq.com/blog
-
Observable
@observablehq
Features that define modern, high-impact data visualizations — like responsiveness, visual filtering, and extreme value handling — are often hard to build from scratch. In Observable Canvases, we’re democratizing advanced, interactive charts. Learn how👇 old.observablehq.com/blog
-
Observable
@observablehq
We sat down with Observable Data Visualization Engineer Fil Rivière to talk all about maps. Read our interview for Fil's perspective on what makes maps meaningful, where spatial data viz is headed, and why he's hoping for a "slow cartography movement." old.observablehq.com/blog/maps-and-data-visualization-wit…
-
Observable
@observablehq
The nature of data analysis and visualization is changing rapidly, and data teams are being asked to deliver more insights, faster than ever. Register now for a webinar on Feb 4 at 1PM ET / 10AM PT unpacking these changes, and how your data team can adapt: streamyard.com/watch/cpSWShqkpzS3
-
Observable
@observablehq
AI can fast-track data analysis and visualization, but only if you can trust its outputs. In Observable Canvases, AI is fully verifiable every step of the way. Learn more: observablehq.com/about
-
Observable
@observablehq
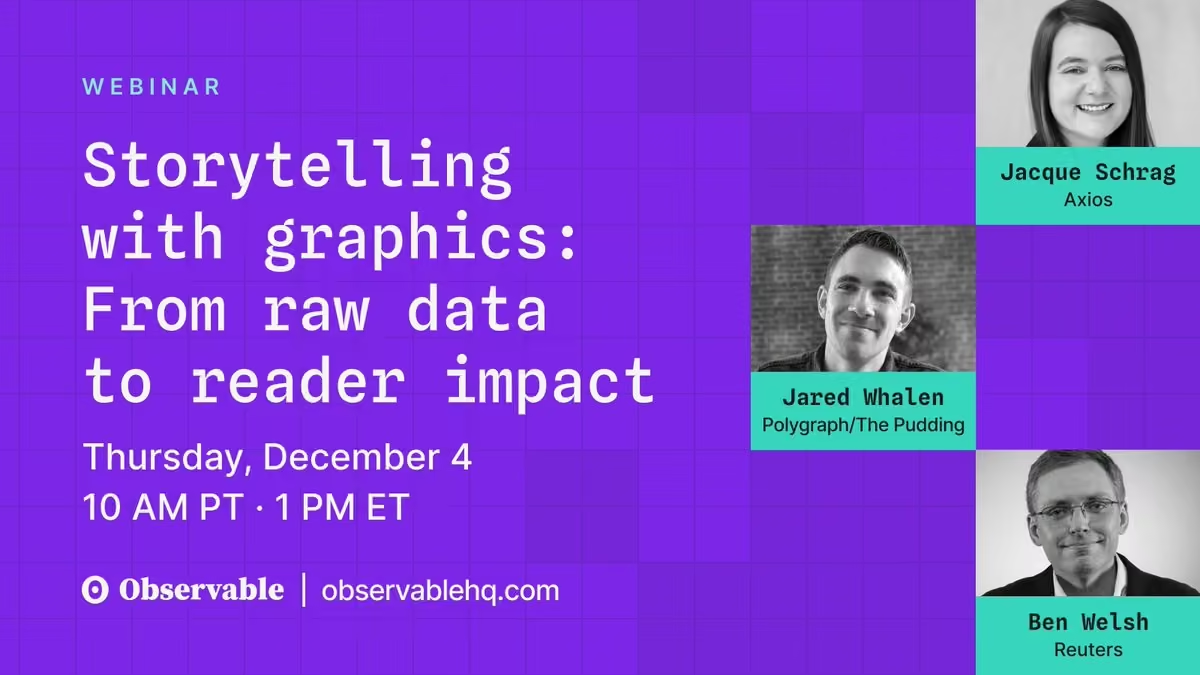
AI is reshaping how we work with data. But, as Ben Welsh (Data Editor, Reuters) shared in our December webinar, AI won’t replace the creativity behind great graphics anytime soon.
Watch the recording for more insights from top data journalists: www.youtube.com/watch?v=_dh4gRkQiRw -
Observable
@observablehq
We ❤️ this Observable Notebook from Ricky Reusser exploring yoga class attendance, with calendars and charts made in Plot! Read Ricky's reflections, and see how they use a notebook import to repurpose an existing Plot component: observablehq.com/@rreusser/exercise-class-log
-
Observable
@observablehq
Happy 2026 from the Observable team!
With the start of the new year, we're reminded that time flies and there's always a need to understand how things change as it does. Explore 8 charts that clarify patterns, reveal anomalies, and help you track metrics with time series data👇 -
Observable
@observablehq
✨ As 2025 comes to a close, we’re celebrating a big year at Observable — new product launches, inspiring events, and innovative work from our community.
Read our 2025 Year in Review for highlights, and to hear what we’re excited about in 2026 🎉 old.observablehq.com/blog/observable-2025-year-in-review -
Observable
@observablehq
🥧 We're not saying you're sick of pie (charts) these days, but there are other appetizing ways to visualize parts of a whole. In Observable Canvases, it's just a few clicks to make advanced, interactive charts like treemaps, circle packing charts, & more: observablehq.github.io/documentation/canvases/
-
Observable
@observablehq
🔎 Exploratory data analysis (EDA) is essential, but it can also be time consuming.
Learn how our transparent, verifiable AI speeds up EDA in Observable Canvases by quickly profiling data, automating data wrangling, & prototyping charts: old.observablehq.com/blog/three-ways-to-use-ai-for-explor… -
Observable
@observablehq
✨ Observable’s Year in Review ✨
2025 was a big year at Observable, with new launches like Observable Canvases & Notebooks 2.0, inspiring events, & incredible work from the community. As we head into 2026, here's a look back at highlights from the year: old.observablehq.com/blog/observable-2025-year-in-review -
Observable
@observablehq
Before diving headfirst into a new dataset, Jared Whalen (The Pudding) reminds us to first ask why the data exists, & how it’s already been used.
Catch more expert insights from top data journalists in our recent “Storytelling with Graphics” webinar 👉 www.youtube.com/watch?v=_dh4gRkQiRw -
Observable
@observablehq
🚀 We recently rolled out improvements to the SQL node in Observable Canvases. Learn how dialect-aware autocompletion, better error handling, and UI refinements make it easier to write and iterate on custom queries, plus see what's coming in 2026: old.observablehq.com/blog
-
Observable
@observablehq
Did you miss last week’s webinar featuring leading data journalists from Reuters, Axios, and The Pudding?
Check out our recap blog post for key takeaways from the discussion, and a behind-the-scenes look into impactful graphics by our panelists: old.observablehq.com/blog/webinar-recap-storytelling-with… -
Observable
@observablehq
In last week's Storytelling with Graphics webinar, we went behind the scenes with leading data journalists to learn how they transform messy datasets into informative and impactful stories. Catch the full discussion here: www.youtube.com/watch?v=_dh4gRkQiRw
-
Observable
@observablehq
When Karim Douieb shares a new data visualization, it travels far and fast, sparking meaningful conversation along the way. Here's how he designs for clarity, impact, and emotion: old.observablehq.com/blog/anatomy-of-an-impactful-data-vi…
-
Observable
@observablehq
Newsrooms have long pushed the boundaries of what data visualization can do — crafting charts that both inform and engage. TOMORROW: Our webinar with expert data journalists provides a peek behind the curtain on their process.
🔗 streamyard.com/watch/6KMCfPXDZxAz -
Observable
@observablehq
🚀 Big SQL upgrades just landed in Observable Canvases. From dialect-aware autocomplete to helpful error messages and a smoother UI, it's now faster and easier to work in the SQL node. Catch up on what’s new, and learn what's coming next → old.observablehq.com/blog
-
Observable
@observablehq
In our recent webinar, Data Visualization Developer Kelsey Nanan shared how low-code tools speed up testing, design, and iteration. See how Observable Canvases help analysts get from big databases to fast, interactive charts in just a few clicks: observablehq.github.io/documentation/canvases/
-
Observable
@observablehq
Readers have come to expect engaging data visualizations from their news sources.
On Dec 4, experts from @Reuters, @axios, and @puddingviz will unpack what makes a visualization clear, credible, and emotional. Register for the webinar: streamyard.com/watch/6KMCfPXDZxAz -
Observable
@observablehq
Missed our “Art + science” webinar? Don’t worry — we have the highlights on our blog. Be sure to check it out, and hear their takes on choosing the “right” chart, personal influence, and their approach to collaborating with others: old.observablehq.com/blog/webinar-recap-art-science-blend…
-
Observable
@observablehq
What makes a data visualization resonate deeply with audiences? According to @karim_douieb, there are 5 essential ingredients. In this Creator Spotlight, Karim walks us through each of these elements and shares concrete examples from his work. Read more: old.observablehq.com/blog/anatomy-of-an-impactful-data-vi…
-
Observable
@observablehq
How do data journalists turn raw data into charts that inform and inspire? Join experts from @Reuters, @axios, and @puddingviz on Dec 4 for a behind-the-scenes look at how newsrooms approach storytelling with graphics. Register now: streamyard.com/watch/6KMCfPXDZxAz
-
Observable
@observablehq
“When researchers can see their data, they start asking better questions.”
In our latest Creator Spotlight, Dr. Philip Bogden shows how his data app helped oncology researchers move beyond spreadsheets into rich, interactive data exploration.
Read → old.observablehq.com/blog/making-science-visible-dr-phili… -
Observable
@observablehq
Want to show how your data adds up? 📊 Meet 6 charts for visualizing parts of a whole — from treemaps to streamgraphs — w/ tips on when each may be a good option. Learn how to create these charts & many more in under a minute in Observable Canvases: observablehq.github.io/documentation/canvases/
-
Observable
@observablehq
[TOMORROW] Get ready for our webinar: Art + science: Blending creativity and analysis in data visualization 🎨📊
Our guests will share their perspectives on chart choices, interactivity, AI, and more.
streamyard.com/watch/dHiSp8q9wyan -
Observable
@observablehq
In Observable Canvases, users can freely arrange charts and analysis across two dimensions for unconstrained, branching data exploration. Learn how we designed custom connectors that keep data flow clear and manageable at any scale: old.observablehq.com/blog
-
Observable
@observablehq
Want to make visuals that don’t just inform — but resonate? Join us on Nov 11 for Art + science: Blending creativity and analysis in data visualization, & learn how experts balance clarity, creativity, & collaboration.
🎙️@sxywu
🎙️Tanya Shapiro
🎙️@kel_n94
streamyard.com/watch/dHiSp8q9wyan -
Observable
@observablehq
What happens when a computer scientist helps oncologists visualize patient-survey data?
Read how Dr. Philip Bogden’s interactive data app turned messy spreadsheets into insights — and reshaped collaboration in medical research.
old.observablehq.com/blog/making-science-visible-dr-phili… -
Observable
@observablehq
It's now even easier to build on-brand data visualizations in Observable Canvases. 🎨 With data-driven colors, you can define custom color scales based on categories in your data. Learn how Observable helps you create fast, consistently branded charts: observablehq.github.io/documentation/canvases/
This media couldn't be displayed. See it on the original post. -
Observable
@observablehq
🕸️ For our final Observa-bite of the month we are adding radar charts (aka spider charts) to Observable Canvases. Check out radar charts, and all of our advanced chart types, available in canvases: observablehq.github.io/documentation/canvases/
-
Observable
@observablehq
Great data viz is both art and science. 🎨📊 Join Observable’s @allison_horst + our powerhouse panel for an inspiring discussion on where the two converge.
🎙️@sxywu
🎙️Tanya Shapiro
🎙️@kel_n94
streamyard.com/watch/dHiSp8q9wyan -
Observable
@observablehq
Observable’s built-in charts are designed by top data visualization developers, interactive by default, & fast — even with big data. We recently added advanced charts including Sankeys, beeswarms, arc maps & more. Meet our state-of-the-art visualizations 👉old.observablehq.com/blog
-
Observable
@observablehq
Table nodes in Observable Canvases are powerful for fast, UI-based data wrangling. In addition to interactive filtering and column management, you can now derive new columns, convert data types, and limit rows — all in the same place. Learn more: observablehq.github.io/documentation/canvases/
-
Observable
@observablehq
Ever built a chart that was technically correct, but still led people astray? Accuracy alone doesn’t guarantee clarity. Fast forward to 23:02 of the storytelling with data podcast to hear examples & how to balance accuracy, clarity, & audience engagement:
www.storytellingwithdata.com/podcast/why-dasboards-die -
Observable
@observablehq
Data exploration should inspire new questions & analyses. But BI tools can make exploration cumbersome, discouraging new exploration paths. Observable Canvases are designed for fast, fluid, iterative data exploration. Meet 8 features that make it possible: old.observablehq.com/blog
-
Observable
@observablehq
🪄 Chart theming is here! Now, in Observable Canvases, you can apply custom color palettes and fonts to create dashboards that are automatically on-brand. Get started with dashboards and chart theming here: observablehq.github.io/documentation/canvases/
-
Observable
@observablehq
Think your dashboard is done? Think again. “A successful dashboard isn't ever done…it should evolve to stay relevant as a hub for discussion & decision-making.” -Allison Horst, DevRel at Observable. Hear more on the storytelling with data podcast → www.storytellingwithdata.com/podcast/why-dasboards-die
-
Observable
@observablehq
😱 Horrified by the hours you've spent building dashboards that end up rotting away in forgotten bookmarks? Observable Canvases simplify development, boost collaboration, & put interactive charts at your fingertips for dashboards that stay alive long-term: old.observablehq.com/blog
This media couldn't be displayed. See it on the original post. -
Observable
@observablehq
Despite claims that dashboards are dead, they remain a highly requested BI deliverable.
New features in Observable Canvases, like a streamlined viewer experience + control nodes, make dashboards easier to build & better to use, so they stay alive & well: old.observablehq.com/blog -
Observable
@observablehq
🐝 Beeswarm charts are a powerful way to explore quantitative variable distributions, and a useful alternative to more aggregated options like histograms & box plots. Meet our expanding suite of state-of-the-art, interactive charts in Observable Canvases: old.observablehq.com/blog
This media couldn't be displayed. See it on the original post. -
Observable
@observablehq
📣 Calling all data professionals! We just launched a new survey on the state of business intelligence and analytics tools, and we want to hear from you. Share your POV here: forms.gle/GcMT6c6pRPMvALfS8
-
Observable
@observablehq
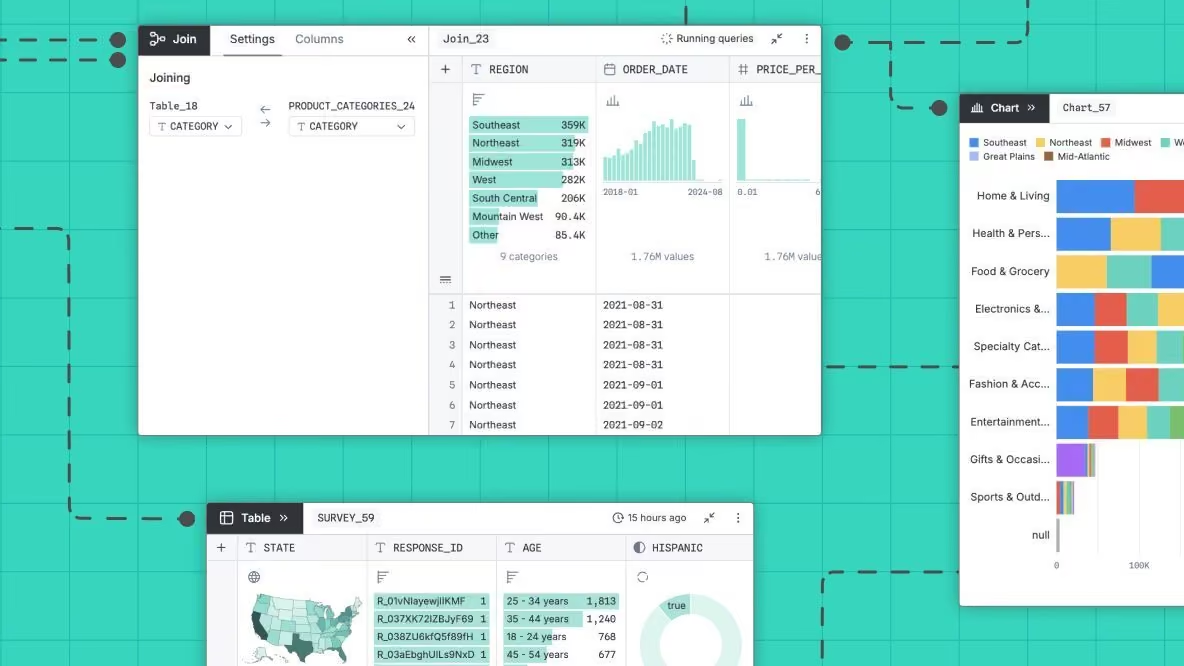
Data joins are everywhere in analytics, but it's tricky to build UI-based joins in a reactive canvas.
In Observable Canvases, we’ve built robust joins that avoid SELECT *, deduplicate columns, and handle upstream changes. Learn more: old.observablehq.com/blog -
Observable
@observablehq
We recently announced Observable Notebooks 2.0 with a new, open notebook file format + desktop app. Now, we’ve added Python & Node.js data loaders — special cells that run at build time, for better stability and performance.
Learn more 👉 observablehq.github.io/notebook-kit/data-loaders -
Observable
@observablehq
Slow-loading tables & overworked browsers can bog down analysis when you're exploring large datasets. Learn how table virtualization in Observable Canvases keeps data work fast & fluid — even with big data, and when viewing complex, branching analyses: old.observablehq.com/blog
This media couldn't be displayed. See it on the original post. -
Observable
@observablehq
Treemaps help you go beyond donut charts and stacked bars to visualize parts of a whole for hierarchical data. Learn how canvases put state-of-the-art, interactive charts like treemaps, Sankey diagrams, bump charts, and more at your fingertips: observablehq.github.io/documentation/canvases/
This media couldn't be displayed. See it on the original post. -
Observable
@observablehq
Self-serve analytics sounds great — that is, until tools overwhelm or constrain users, and adoption tanks. Our VP of Sales, Trevor Eddy, shares how collaborative analytics delivers insights and finally fulfills the promise of self-serve BI: old.observablehq.com/blog
-
Observable
@observablehq
Sankey diagrams make it easy to see how quantities flow through a system, but they're tough to build from scratch.
In Observable Canvases, you can create Sankey diagrams (plus maps, beeswarms, & more) in minutes — all optimized for clarity & performance: old.observablehq.com/blog -
Observable
@observablehq
Bump charts show how rankings shift over time, and are a great option when order matters more than absolute values. In Observable Canvases, you can now build & share responsive bump charts with just a few clicks. See what's new in our summer release: old.observablehq.com/blog
-
Observable
@observablehq
For one of the most common operations in all of data wrangling, implementing UI-based data joins is anything but straightforward. Software engineer Tony Sullivan shares some unexpected challenges behind joins and how we handle them in Observable Canvases: old.observablehq.com/blog
-
Observable
@observablehq
Observable Canvases make it lightweight to share interactive charts and tables as a natural extension of your data analysis. Embed canvas nodes into internal data apps, or draw a frame around part of your canvas to generate a tidy dashboard. Learn more: old.observablehq.com/blog
-
Observable
@observablehq
In Observable Canvases, we’re putting advanced, interactive charts at your fingertips. Make Sankey diagrams, beeswarm charts, arc maps, bump charts, and more in just a few clicks. Learn how canvases streamline data visualization and analysis: old.observablehq.com/blog
-
Observable
@observablehq
Observable Canvases just got a major upgrade. Join our live webinar on September 4 at 10 AM PT to learn about new chart types, extended sharing options including quick embeds, improved workspace permissions, and more: streamyard.com/watch/jsq5zngf4RfF
-
Observable
@observablehq
Today we’re announcing big updates in Observable Canvases. Learn about our growing suite of built-in interactive charts (Sankey diagrams, arc maps, + more), new embeds and dashboards for fast sharing, added Postgres and @databricks support, and more: old.observablehq.com/blog
-
Observable
@observablehq
It's easy to build data visualizations with Observable Plot. Check out some common chart types you can build, along with example code snippets to help you hit the ground running: old.observablehq.com/blog/essential-charts-code-snippet-o…
-
Observable
@observablehq
Grid cartograms trade realistic geospatial borders for geometric tiles that make small regions visible, and values more easily comparable. Read our new post for grid cartogram essentials, examples, pros/cons, and resources to build your own in Observable: old.observablehq.com/blog/what-is-a-grid-cartogram
-
Observable
@observablehq
AI adoption doesn’t have to be top-down. At Observable, we’re supporting our team to explore and use AI tools in ways that work for them. The result? A culture where AI feels natural and useful, not forced.
👉 Learn how our team boosted AI adoption: old.observablehq.com/blog/fostering-company-culture-ai-ad… -
Observable
@observablehq
AI can speed up steps in throughout data analysis from initial data profiling to final chart development. For exploratory analysis, use AI to summarize database schemas and contents, automate tedious data wrangling tasks, and draft new charts. Learn more: observablehq.com/about
-
Observable reposted
Mike Bostock
@mbostock
Notebooks 2.0 is here! 📓🔮 Previewing today: Notebook Kit, an open notebook file format and tooling for building static sites; and Observable Desktop, a macOS desktop application for editing notebooks as local files, with a radical new approach to AI. observablehq.com/notebooks/2/
-
Observable
@observablehq
In Observable Canvases, AI is transparent and verifiable, so you can confidently use it throughout your data analysis. Discover how AI streamlines data exploration by accelerating data profiling, automating data wrangling, and drafting interactive charts: old.observablehq.com/blog/three-ways-to-use-ai-for-explor…
-
Observable
@observablehq
AI can fast-track your data analysis, but only if you can trust its outputs. In Observable Canvases, you can see, verify, and interpret AI outputs every step of the way. Learn how our transparent AI gets you from messy tables to trusted insights, faster: old.observablehq.com/blog
-
Observable
@observablehq
AI in Observable Canvases is transparent, so you can boost your data analysis while maintaining confidence in the results. We expose the logic and code at each step for AI outputs that you can immediately verify, and more easily interpret. Learn more: old.observablehq.com/blog
-
Observable
@observablehq
Big data usually means slow charts, but not in Observable Canvases. Our optimized queries power fast, interactive visualizations so you can explore more, and wait less, to find insights faster. Learn how we keep charts fast, even with big data: old.observablehq.com/blog
-
Observable
@observablehq
The hardest part about reusing charts can be getting your data into the expected shape. Learn common data formats consumed by Plot & D3 — and how to transform your data to match — so you can quickly reuse thousands of stunning, interactive visualizations: old.observablehq.com/blog/reshaping-data-plot-d3
-
Observable
@observablehq
When working with big data for BI, data visualizations can be painfully slow to load. That stifles exploration and iteration, which means you might be missing out on business insights. In our new post, learn how we keep charts fast in Observable Canvases: old.observablehq.com/blog
-
Observable
@observablehq
Update: The Heroku outage we reported on earlier today, which may have temporarily caused issues with data connectors in Observable products, is now resolved.
-
Observable
@observablehq
Due to an ongoing Heroku outage, we are experiencing issues with data connectors. This may impact your use of Observable or cause further disruptions to our services. We will monitor the situation and provide updates as appropriate.
-
Observable
@observablehq
Histograms are incredibly useful, interpretable, and common in BI. But building histograms that work well out of the box for any data is tricky. We share some of the challenges faced, and decisions made, when designing histograms for Observable Canvases: old.observablehq.com/blog
-
Observable
@observablehq
Data analysts spend their days knee-deep in company data, so they are uniquely positioned to help teammates find, use, and trust analyses that can improve their work. Learn how analysts can contribute to a stronger data culture across their organization: old.observablehq.com/blog/how-to-build-data-culture
-
Observable
@observablehq
When data visualization is confined to initial exploration and final storytelling, you can miss out on insights, anomalies, and mistakes that get revealed in between. Learn how end-to-end visual data analysis helps your team uncover insights, and errors: old.observablehq.com/blog/visual-data-analysis
-
Observable
@observablehq
Most BI tools let you make histograms with one click. So, you might think that designing good default histograms is simple. Turns out, it's harder than it sounds. Learn how we handle common challenges to make better out-of-the-box histograms in canvases: old.observablehq.com/blog
-
Observable
@observablehq
Including collaborators and stakeholders throughout analysis helps to avoid redundant work, crossed wires, and rehashing decisions at the project finish line. Learn how collaborative analytics gets you from raw data to trusted business decisions, faster: old.observablehq.com/blog/collaborative-analytics
-
Observable
@observablehq
With end-to-end visual data analysis, you can keep eyes on your data throughout the analysis process. Learn how that helps you discover unexpected value in your data, catch mistakes earlier, and improve cross-functional collaboration: old.observablehq.com/blog/visual-data-analysis
-
Observable
@observablehq
Collaborative analytics brings data teams and stakeholders into the analysis process from ideation to final product. Discover how that helps you all reach the finish line, faster: old.observablehq.com/blog/collaborative-analytics
-
Observable
@observablehq
Join us May 20 at 10 AM PT for a first look at Observable Canvases. Learn how canvases support fast, visual data exploration and analysis, with whiteboarding tools that let data teams and stakeholders all participate in the same place. Sign up today: streamyard.com/watch/vpmmiyXKuPAT
-
Observable
@observablehq
In Observable Canvases, data teams can break free from linear workflows to explore data in branched, visual analyses across an infinite canvas. Work seamlessly between code and UI, and collaborate with stakeholders using whiteboarding tools: old.observablehq.com/blog
-
Observable
@observablehq
Ever built a chart only to have people misread it, or miss key insights? Annotations can make all the difference. Here are five ways you can uplevel your chart annotations for improved context, clarity, and interactivity (with reusable examples and code): old.observablehq.com/blog/five-techniques-to-improve-char…
-
Observable
@observablehq
In Observable Canvases you can write queries in SQL, build custom charts in JS, or wrangle and visualize data using UI options. Seamlessly mix methods across the infinite canvas, with the freedom to choose how you work with data at each step. Learn more: observablehq.com
-
Observable
@observablehq
Observable Canvases get data teams and stakeholders all in one place, with the context they need to fearlessly explore and analyze data together. Learn how canvases (now in early access) can help teams make faster, better, more trusted business decisions: www.youtube.com/watch?v=ewU4JaE5gvA
-
Observable
@observablehq
Say hello to the collaborative data canvas. Observable Canvases give teams a faster, more flexible way to work with data — explore freely, think visually, and uncover better insights, together.
Now in early access: old.observablehq.com/blog -
Observable
@observablehq
You know that databases are where most data lives, but do you understand how they work? In this series, we'll walk you through what tables and relations are, how data is organized, how you filter and aggregate, and how joins work. Read more: old.observablehq.com/blog/databases-101-basics-data-analysts
-
Observable
@observablehq
Data visualizations should inspire curiosity, encourage exploration, and leave users excited for more. We spoke with data viz developer Kelsey Nanan to understand her process and guiding principals. Learn more: old.observablehq.com/blog/kelsey-nanan
-
Observable
@observablehq
When used carelessly, animation can distract from data visualizations. Check out these best practices for delivering better animations in data visualizations. old.observablehq.com/blog/effective-animation
-
Observable
@observablehq
Charts should speak for themselves — but too often, key insights get lost. Smart annotations help guide the story. Here are five ways to make your charts clearer, more interactive, and more impactful. old.observablehq.com/blog/five-techniques-to-improve-char…
-
Observable
@observablehq
Large language models (LLMs) and AI tools have proven to be very useful for programming, but how do they do when writing D3 code? In this blog post, we explore Claude's ability to create and modify some basic charts from time series data.
old.observablehq.com/blog/ai-tools-llms-d3-code -
Observable
@observablehq
When it comes to data viz and app development, Kelsey Nanan thinks that collaboration between designers and developers is key to overcoming hard challenges, unlocking creativity, and finding unique solutions: www.youtube.com/watch?v=gRBVR-PI6pw
-
Observable
@observablehq
With Observable Plot, you get built-in options for interactive tooltips, spatial interpolators, curve variations, rounded mark corners, and much more. Learn about eight underused Plot options that can instantly uplevel your charts: old.observablehq.com/blog/underused-options-observable-plot
-
Observable
@observablehq
These days, treemaps are commonplace in BI dashboards. In our new post, learn about the origins of treemaps, how they've changed over time, and how they’re used for business intelligence and data visualization today: old.observablehq.com/blog/treemaps-history
-
Observable
@observablehq
Many chart types are useful for lots of different data, and some work well for specific kinds of data. Then, there's the radar chart. Learn how radar charts work, how they represent data, and why they're really never a good choice for effective data viz: old.observablehq.com/blog/avoid-radar-charts
-
Observable
@observablehq
Here's how IOP Systems used Observable to remove hurdles from the development pipeline, and create expressive, personalized data experiences for their customers. old.observablehq.com/customer-stories/iop-systems
-
Observable
@observablehq
When done right, animation can be a great tool for engaging users through data visualizations. Here's how: old.observablehq.com/blog/effective-animation
-
Observable
@observablehq
Small details make a big difference in data visualizations, and Observable Plot has a trove of built-in options for chart customization. In this post, we share eight Plot options that fast-track updates to chart styles, scales, and interactivity: old.observablehq.com/blog/underused-options-observable-plot
-
Observable
@observablehq
Happy Pi(e) Day! When can and should you use pie charts? What about donut charts? And did you know that we don't actually know how we even read pie charts? Check out our blog post to learn all about pie charts, on this most nerdy of made-up holidays!
old.observablehq.com/blog/truth-about-pie-charts -
Observable
@observablehq
Knowing your data is crucial for data analysis. In our new blog post, we list a few steps that will help you make sure that your analysis is true to the data and useful to the people who might be making decisions based on what you’ve uncovered.
old.observablehq.com/blog -
Observable
@observablehq
Categorical and temporal data, bar and line charts — which one do you use for what and why? In this blog post, we show the reason bar charts are used for categorical data and how the choice is a bit more complicated for time series.
old.observablehq.com/blog/bars-vs-lines-time-series-data -
Observable
@observablehq
When it comes to temporal data, you might use bar or line charts. But when should you use which? And why are line charts different from bar charts, anyway? Learn all about these most common of chart types in our new blog post: old.observablehq.com/blog/bars-vs-lines-time-series-data
-
Observable
@observablehq
Take it from Observable data visualization engineer Fil Rivière: no matter how long you've been doing it, building good maps and data visualizations is hard. Hear Fil's views on effective maps, work he's proud of, and what he's excited about next: old.observablehq.com/blog/maps-and-data-visualization-wit…
-
Observable
@observablehq
Elevate your next dashboard by including lesser-known chart types that help users reach insights faster. old.observablehq.com/blog/five-underused-charts-for-riche…
-
Observable
@observablehq
Building dashboards is a lot of work, but they often end up not being used by their intended audience. In this webinar, Data Visualization Developer Robert Kosara discussed how to avoid this problem, and build better dashboards that your users will love. www.youtube.com/watch?v=TygdZACjX9g
-
Observable
@observablehq
We interviewed Observable's own data visualization engineer Fil Rivière to ask him about all things maps. In our new post, hear Fil's thoughts on what makes a map impactful, why they're hard to do well, and why he's pondering a "slow cartography movement": old.observablehq.com/blog/maps-and-data-visualization-wit…
-
Observable
@observablehq
Good data design makes the most of every pixel. From compact charts to smart interactivity, learn how to create clear, effective visualizations in small spaces: old.observablehq.com/blog/big-insights-small-spaces
-
Observable
@observablehq
Linked brushing puts viewers in the driver's seat, allowing them to explore patterns across variables, dig into trends in complex geospatial data, and zoom in on hi-res time series data. Learn more and see examples in our new blog post: old.observablehq.com/blog/linked-brushing
-
Observable
@observablehq
You know what special day it is today? That's right, only one month to Pi Day! To help you prepare, we've written a blog post that dispels some of the myths around pie and donut charts, shows what they're useful for, and presents the science around them.
old.observablehq.com/blog/truth-about-pie-charts -
Observable
@observablehq
We recently spoke with @palewire about building better data pipelines for data journalism. Learn how he's reducing the time journalists spend on data access and prep, so they can spend more time telling stories that matter: old.observablehq.com/blog/ben-welsh
-
Observable
@observablehq
Gabriel Coch uses Observable to map greenhouse data with AgroPatterns, helping Colombian farmers spot pests early, protect crops, and reduce chemical use. 🌱
old.observablehq.com/blog/agropatterns-observable-greenho… -
Observable
@observablehq
Does your product or application include user-facing analytics? Check out our recent webinar for an overview of how to build successful user-facing analytics experiences: www.youtube.com/live/Orvj9AtZWCQ?cbrd=1&ucbcb=1
-
Observable
@observablehq
The Observable platform helped IOP Systems turn complex data into actionable insights for their customers. Read more: old.observablehq.com/customer-stories/iop-systems
-
Observable
@observablehq
Bar charts are an essential chart type that show data grouped into categories or counts of items in a dataset. This blog post will teach you how they work and when to use them, and even comes with Observable Plot code.
old.observablehq.com/blog/simplicity-bar-charts -
Observable
@observablehq
Building a data app for external audiences? Our team walks through some considerations for designing successful user-facing data apps: old.observablehq.com/blog/how-build-successful-user-facin…
-
Observable
@observablehq
Even if you're a seasoned data viz pro it can be helpful to go back to the basics. Make sure your dashboards have an impact with these seven design considerations: old.observablehq.com/blog/seven-ways-design-better-dashbo…
-
Observable
@observablehq
Interesting relationships across variables can be overlooked if they're displayed in separate, isolated charts. Learn how linked brushing helps viewers to investigate patterns across metrics, dive into spatial trends, and focus on time periods of interest: old.observablehq.com/blog/linked-brushing
-
Observable
@observablehq
People have strong opinions about pie charts — but are they based on rigorous research, or just personal preference? Learn what studies tell us about the chart type that everyone loves to hate in our new blog post: old.observablehq.com/blog/truth-about-pie-charts
-
Observable
@observablehq
When it comes to data storytelling, data visualization developer Kelsey Nanan always puts the data in the driver's seat. Learn how she finds inspiration, prioritizes accessibility, and follows the data wherever it takes her in our new creator feature: old.observablehq.com/blog/kelsey-nanan
-
Observable
@observablehq
Pie and donut charts get a bad rep, but they work well if used for the right data and tasks. Read about what the science has to say about them in our new blog post: old.observablehq.com/blog/truth-about-pie-charts
-
Observable
@observablehq
Kelsey Nanan's journey into data visualization began with curiosity and evolved into a career crafting impactful, human-centered stories from complex data. Her work showcases collaboration, creativity, and how to let the data lead. Read more: old.observablehq.com/blog/kelsey-nanan
-
Observable
@observablehq
At Insight 2024, Kaitlyn Trudeau (Senior Research Associate at Climate Central) shared how interactive data visualizations help viewers explore and understand local impacts of climate change. Learn more about Kaitlyn's work in our Creator Spotlight: www.youtube.com/watch?v=A2i3Yh_JwNs
-
Observable
@observablehq
Learn why and how @karim_douieb (data scientist and co-founder of jetpack.ai) used Observable to re-envision U.S. election maps using a dynamic cartogram, for a more intuitive, representative, and engaging view of election results: www.youtube.com/watch?v=1dxP8DK9jHI
-
Observable
@observablehq
Data visualizations are much more engaging when cross-functional team members collaborate outside of their respective roles. Watch this video to learn how data viz developer Kelsey Nanan (@knanan) unites designers and developers for stronger outcomes: www.youtube.com/watch?v=gRBVR-PI6pw
-
Observable
@observablehq
Thoughtful animation draws viewers into your data, revealing new perspectives and keeping them engaged. See some of our favorite tactics for using animation effectively in your data visualizations: old.observablehq.com/blog/effective-animation
-
Observable
@observablehq
As the year comes to a close, we look back at 2024 in a blog post, and present 24 insights: from insightful data apps and notebooks, to inspiring blog posts and an insight on how people use our open-source tools, and of course the Insight conference.
old.observablehq.com/blog/observable-wrapped-2024 -
Observable
@observablehq
We recently met up with Jason Forrest, data viz designer and Editor-in-Chief of Nightingale, to chat about creating data visualizations that inspire conversation. Learn how Jason and team foster dialogue through collaboration, art, and "tuning the hi-hat": old.observablehq.com/blog/jason-forrest
-
Observable
@observablehq
Are your dashboards in need of a refresh? We recapped seven tips and best practices to help you design more engaging dashboards: old.observablehq.com/blog/seven-ways-design-better-dashbo…
-
Observable
@observablehq
Missed Insight, our half-day virtual conference? 🎥 Catch up on all the great talks and sessions now on our YouTube channel! Explore, learn, and get inspired: www.youtube.com/playlist?list=PLOHIJAFwtkEeMHFwEoMX-6a4zt…
-
Observable
@observablehq
Animation can be a gimmicky distraction in data visualization. But when used with care, animation can improve user experiences and help viewers track patterns across charts and metrics. We share five ways you can use animation for more effective data viz: old.observablehq.com/blog/effective-animation
-
Observable
@observablehq
Want to create impactful data visualizations for tight spaces? Learn how sparklines, treemaps, interactivity, and responsive layouts can help charts pack a punch when you’re building with limited screen space in mind. old.observablehq.com/blog/big-insights-small-spaces
-
Observable
@observablehq
Observable now supports embedded analytics. Give your users the best data visualizations and experiences — with all the benefits of Observable Framework — without rebuilding your website from scratch. Read the announcement to learn more: old.observablehq.com/framework/embeds
-
Observable
@observablehq
Last chance to register for Insight! From talks about how designers & developers can build better data visualizations by working together to new approaches for common charts, like election maps, there's something at Insight for everyone. Sign up today --> observablehq.com/insight/2024
-
Observable
@observablehq
Ben Welsh (@palewire), data journalist & news applications editor at Reuters, wants people to spend less time coding to make more time for telling important stories. Learn how he thinks about building data pipelines, AI, static sites, & "medium data": old.observablehq.com/blog/ben-welsh
-
Observable
@observablehq
Give your users the best embedded analytics, without having to overhaul your app. Learn how to export JS modules, files, or use iframe embeds to bypass tooling and team bottlenecks to deliver fast interactive visuals in your existing apps: www.youtube.com/watch?v=lWfd7tnGvnA
-
Observable
@observablehq
You can now embed interactive visualizations directly in your custom applications! Enjoy instant load times with precomputed data snapshots, seamless JavaScript integration, and hassle-free CORS setup. Dive into the details on our blog: old.observablehq.com/framework/embeds
-
Observable
@observablehq
We chatted with award-winning journalist and Reuters applications editor @palewire about building back-end data pipelines for data journalism. Learn how he's cutting down the time data journalists spend writing code, to make time for more important work: old.observablehq.com/blog/ben-welsh
-
Observable
@observablehq
Insight is less than a month away! Join us for live demos, fresh approaches to data viz challenges, and inspiring examples.
observablehq.com/insight/2024 -
Observable
@observablehq
Check out our conversation with developer Ryan Murphy for a behind the scenes look at the "why" and "how" of building his wildly popular ActBlue Ticker Tracker on Observable: old.observablehq.com/blog/ryan-murphy-actblue
-
Observable
@observablehq
Users expect interactive analytics to be clear and performant — no matter what device they're on. Learn about strategies for delivering great data visualizations and user experiences in cramped spaces, on mobile phones, and as part of dense dashboards: old.observablehq.com/blog/big-insights-small-spaces
-
Observable
@observablehq
🧟 Slowly loading data apps and visualizations? Over our dead bodies. 💀
Observable's baked data architecture means your users get the fastest interactive pages and graphics, every time.
🧹 It's not witchcraft, but it sure feels like it. Learn more: observablehq.com -
Observable
@observablehq
Most data viz grammars try to nudge you toward better bar charts by preventing you from cropping the y-axis. We dive into mechanisms of cropping axes in Observable Plot, propose better alternatives, and explore similar issues in maps and scatterplots: old.observablehq.com/blog/why-never-crop-y-axis-part-2-ho…
-
Observable
@observablehq
If "improve our embedded analytics" is on your product roadmap, then you won't want to miss Insight, Observable's half-day virtual conference. Learn more and sign up today: observablehq.com/insight
-
Observable
@observablehq
Whether you're prototyping charts in notebooks or building customer-facing data apps, Observable lets you share your path from raw data to insights. Expand how users can explore your code, data, & visualizations for increased confidence and understanding: observablehq.com
-
Observable
@observablehq
When done right, user-facing analytics can drive increased engagement with your product or app, and help move the needle on core product KPIs. Learn more in the recap of our recent webinar: www.youtube.com/watch?v=Orvj9AtZWCQ
-
Observable
@observablehq
The Insight call for speakers is now open! Are you a data viz expert with some wisdom to share? An Observable wiz who wants to give a behind-the-scenes look into how you work? We want to hear from you!
Submit your talk here: docs.google.com/forms/d/e/1FAIpQLSfIWRQIV6FCi6TvL-7k3DGnp… -
Observable
@observablehq
🧟 Dashboards aren't dead. But far too often, poor design and bad user experiences cause them to rot away in obscurity.
🌱 Build better dashboards and data apps that stay alive and keep your users engaged by following these seven design guidelines: old.observablehq.com/blog/seven-ways-design-better-dashbo… -
Observable
@observablehq
Bespoke annotations and interactions can take your charts from meh to mesmerizing. In our recent post, Data Visualization Engineer Fil Rivière shares techniques to improve chart annotations for engaging data apps, with reusable examples in Observable Plot: old.observablehq.com/blog/five-techniques-to-improve-char…
-
Observable
@observablehq
Curious how donations to candidates spike & ebb in response to current events? So was Ryan Murphy, creator of the popular ActBlue Ticker Tracker notebook on Observable. Ryan joined us to share a behind the scenes view into why & how he made it: old.observablehq.com/blog/ryan-murphy-actblue
-
Observable
@observablehq
📣Registration is now open for Insight — Observable’s half-day virtual conference on Dec 3. Featuring new product demos, best practices from our team, and community spotlights, you’ll leave Insight with a few new skills and lots of inspiration. Learn more: observablehq.com/insight/2024
-
Observable
@observablehq
For Crankstart’s new Streets to Stability report, @jasonforrestftw & team used Observable Framework to build a customized, interactive site highlighting the current state of homelessness in SF, and reimagining a future state.
See the impactful new piece: streetstostability.com -
Observable
@observablehq
Do the analytics in your app or digital product delight or disappoint your users? We’re sharing best practices for building engaging user-facing analytics at our next webinar on Oct 23. Sign up to join us live or to receive the recording after the event! streamyard.com/watch/KkwS4StEd6sN
-
Observable
@observablehq
The vertical axis should always start at 0! Have you heard this rule? In this new blog post, we look at why truncating the y-axis can be problematic, look at the science, and find a rule that helps decide when to crop the axis in line charts.
old.observablehq.com/blog/never-okay-crop-y-axis-except-w… -
Observable
@observablehq
Are your user-facing analytics dashboards in need of a facelift? Tune in on October 23 for a webinar where we’ll showcase how to design analytics solutions that delight users, build loyalty, and contribute to core product KPIs like DAU and repeat users. streamyard.com/watch/KkwS4StEd6sN
-
Observable
@observablehq
New release! Framework 1.12 ✨ Exported modules, support for JSR imports, new config options to customize your sidebar (incl. logos!), and more. Check out the release notes: observablehq.com/release-notes/2024-10-01-framework-1-12-0
-
Observable
@observablehq
Deploy your way with Observable Cloud. Learn more: observablehq.github.io/documentation/data-apps/deploys
-
Observable
@observablehq
It’s not all about AI. At Observable, we’re obsessed with hand-crafting the bespoke charts you won’t get from point-and-click tools. In our new post, Data Visualization Engineer Fil Rivière (@recifs) shares 5 techniques to improve chart annotations: old.observablehq.com/blog/five-techniques-to-improve-char…
-
Observable
@observablehq
Your users want more from your data app’s analytics. Follow these best practices to ensure your user-facing analytics deliver a better data experience: observablehq.com/blog/how-build-successful-user-facing-da…
-
Observable
@observablehq
Data app users expect rich, interactive data visualizations and a great user experience, even when viewing them on small screens. Read our newest post to learn about chart types and strategies that deliver big insights in small spaces: observablehq.com/blog/big-insights-small-spaces
-
Observable
@observablehq
Observable Cloud gives you fine-grained access control for hosted data apps, so you can confidently share with just the right people. Learn how Cloud helps data teams deliver fast, custom data apps at scale: observablehq.com/platform/cloud
-
Observable
@observablehq
Watch the recording from last week's webinar to learn how Observable Cloud helps data teams deliver fast, secure data apps powered by "baked data" architecture, with built-in support for scheduled builds, fine-grained access control, analytics, and more: www.youtube.com/watch?v=WRWIyTwte3U&t
-
Observable
@observablehq
From exploratory analysis and testing in Notebooks to building fast, custom data apps with Framework, Observable puts your team on the fast track to production-ready data displays. Learn where Notebooks and Framework shine in your data analysis lifecycle: observablehq.com/blog/from-data-exploration-to-data-apps-…
-
Observable
@observablehq
User-facing data apps have different users, and use cases, than traditional internal-facing BI dashboards. Learn about the differences and strategies for creating successful data apps for users external to your organization.
observablehq.com/blog/how-build-successful-user-facing-da… -
Observable
@observablehq
Observable makes it easy to deploy and manage data apps. See how in our next live webinar. Our team will demo our latest features and answer audience questions. Save your spot: streamyard.com/watch/fCr9uiVxDtyb
-
Observable
@observablehq
Observable Cloud lets you build your data apps any way you want. Connect your GitHub repo and build from the Observable UI, on push to your repo, or on a schedule! Learn more: observablehq.com/documentation/data-apps/github
-
Observable
@observablehq
See how easy it is to deploy, manage, and optimize your data apps by joining our next live webinar. We’ll demo our newest features and leave lots of time for questions. Sign up now! streamyard.com/watch/fCr9uiVxDtyb
-
Observable
@observablehq
🚀 Big news! We’ve launched Observable Cloud — a game-changer for deploying and managing Framework data apps. Deliver performant data apps with scheduled builds and deploy-on-commit for dashboards that are smarter, always up-to-date, and CI/CD ready. observablehq.com/blog/announcing-observable-cloud
-
Observable
@observablehq
Rich, interactive data displays are the heroes of Observable Framework data apps. But behind the scenes are software, tools, and architectures that make apps fast & flexible. Our new post highlights 8 things teams should know when building w/Framework: observablehq.com/blog/framework-essentials-for-data-teams
-
Observable
@observablehq
From notebooks for exploration to Observable Framework for building production-ready data apps, Observable has the right tool for the task at hand. Learn more about how notebooks and Framework fit together: observablehq.com/blog/from-data-exploration-to-data-apps-…
-
Observable
@observablehq
✨ New! Embed @Datawrapper charts as web components in Framework data apps using Datawrapper's script embed API. Or, write a 🐍 Python data loader right in Framework to dynamically generate a Datawrapper chart! Learn more from @palewire's new example: observablehq.observablehq.cloud/framework-example-datawra…
-
Observable
@observablehq
📈 @ClimateCentral builds data-driven visuals highlighting local impacts of climate change, which are used by media partners worldwide. Learn how Observable helps the Climate Matters team quickly create & share high-quality maps & graphics, on a schedule: observablehq.com/customer-stories/climate-central
-
Observable
@observablehq
A good dashboard helps people quickly understand data and make decisions. In our new blog post, we present seven ideas and guidelines to help you make better dashboards – from visual hierarchies and the use of color to big numbers and interaction. observablehq.com/blog/seven-ways-design-better-dashboards
-
Observable
@observablehq
Questions about building data apps with Observable? Join our live demo TOMORROW for a full walkthrough and Q&A: streamyard.com/watch/cbfBpvzUjh5P
-
Observable
@observablehq
Custom data apps are powerful, but can be very time consuming to build and difficult to maintain. Learn how Observable makes building data apps faster and easier in our recent blog post: old.observablehq.com/blog/observable-makes-building-data-…
-
Observable
@observablehq
🧇 It’s National Waffle Day! Did you know that Observable Plot has a new waffle mark? Quickly create charts that make it easier to compare exact quantities. Update colors, units, rounding, and more with built-in options. Learn more: observablehq.com/plot/marks/waffle
-
Observable
@observablehq
Static site generators are typically used for blogs or docs sites. But the architecture is actually great for data apps. Learn more with the recap of our recent webinar: www.youtube.com/watch?v=yfL5PmHv19Q
-
Observable
@observablehq
💫 If you’ve been developing visualizations in Observable Notebooks but haven’t made the leap to Framework, now is the time! Our new convert command (beta) helps you convert notebooks to Markdown for use in Framework data apps. Learn more here: observablehq.observablehq.cloud/framework/convert
-
Observable
@observablehq
If you’re new to Observable, or just interested in learning more about our platform, don’t miss our live demo webinar on Thursday, August 29. Bring your questions — this comprehensive demo will be a great way to learn more about our technology:
streamyard.com/watch/cbfBpvzUjh5P -
Observable
@observablehq
-
Observable
@observablehq
Deliver faster and more expressive data apps through static site generators. Register now and tune in live tomorrow at 10AM PT for our webinar: streamyard.com/watch/DvVwaeUTqgJG
-
Observable
@observablehq
Our webinar on building fast and interactive data apps with static site generators is coming up fast. Register now for the discussion and live Q&A on Aug 20 at 10AM PT: streamyard.com/watch/DvVwaeUTqgJG
-
Observable
@observablehq
From exploratory analysis and testing in Notebooks to building fast, custom data apps with Framework, Observable puts your team on the fast track to production-ready data displays. Learn where Notebooks and Framework shine in your data analysis lifecycle: old.observablehq.com/blog/from-data-exploration-to-data-a…
-
Observable
@observablehq
Data apps built with a static site generator. Yes, really!
Tune in to our webinar to find out how static sites can help your data team build expressive and performant dashboards. streamyard.com/watch/DvVwaeUTqgJG -
Observable
@observablehq
Quickly update the look and feel of your Framework data apps by configuring page themes. Choose from built-in themes made by Observable designers, or add your own stylesheet for apps that are perfectly on brand. Learn more: observablehq.github.io/framework/themes
-
Observable
@observablehq
Looking to build fast, interactive dashboards & data apps? Now, the simplicity & speed of static site generators is available for data apps. Join our upcoming webinar to see how you can create fast, expressive, interactive data apps with minimal hassle. streamyard.com/watch/DvVwaeUTqgJG
-
Observable
@observablehq
When you host data apps with a Pro or Enterprise workspace on Observable, you can use secret link sharing to allow viewers to see apps privately, no account or sign-in required. Learn how Observable helps data teams securely build & host custom data apps: observablehq.com
-
Observable
@observablehq
Static site generators can be used for more than just documentation and blogging. Find out how to build fast, expressive, interactive data apps with static site generators in our next webinar: streamyard.com/watch/DvVwaeUTqgJG
-
Observable
@observablehq
We recently published six showcase examples that highlight what’s possible when you build dashboards with code. In this post, we share how Framework’s flexibility, components, and unlimited customization let us quickly build exactly how and what we wanted: old.observablehq.com/blog/takeaways-from-building-showcas…
-
Observable
@observablehq
Common charts used in dashboards — bar and line charts, scatter plots, etc. — are clear and effective. But, in some cases, their simplicity can limit insights from data. In our new post, learn about 5 underused charts for richer data apps dashboards: old.observablehq.com/blog/five-underused-charts-for-riche…
-
Observable
@observablehq
To explore trends in labor statistics, hospital ownership, and healthcare fraud, @junghoon_sonMD created a data app using Observable Framework to display "data insights with unlimited versatility." Learn more about how the dashboard was built, and see the live version👇
-
Observable
@observablehq
“Static site generator” might not sound like the way to create better dashboards, but it is! In
this video, we show you how it works, and how it leads to faster dashboards, less database load, and more control over data updates. www.youtube.com/watch?v=FQL2J7809a8 -
Observable
@observablehq
Data loaders in Observable Framework let you precompute static snapshots of data at build time, cutting down client-side data processing to make your data apps super speedy. Learn more about why data loaders are awesome in this post: old.observablehq.com/blog/data-loaders-for-the-win
-
Observable
@observablehq
Explore our technique examples for reusable examples of common development tasks like querying databases, creating charts, and writing data loaders. Copy & paste our examples, then update w/ your own data + code, to fast-track data app development: github.com/observablehq/framework/tree/main/examples
-
Observable
@observablehq
Custom data apps are powerful, but they are expensive and time-consuming to build and maintain.
Learn more about how Observable provides an alternative approach in this blog post: old.observablehq.com/blog/observable-makes-building-data-…. -
Observable
@observablehq
With traditional BI tools, you're often limited to built-in options for layouts, styling, and visualizations – and that can leave data insights on the table. Learn 3 ways that building dashboards with code helps you to build exactly how and what you want: old.observablehq.com/blog/three-ways-build-better-dashboa…
-
Observable
@observablehq
Viewers get stuck in the weeds when dashboards display data at a higher resolution than needed for making informed decisions. Learn how to align dashboards with the scales of business decisions to help viewers get from charts to decisions quickly. old.observablehq.com/blog/align-dashboards-with-scales-of…
-
Observable
@observablehq
Modern data apps should seamlessly work on different devices, from large screens to mobile phones. In our new video, learn how Observable Framework dashboards respond to window resizing by updating chart dimensions and layout, no matter the device. www.youtube.com/watch?v=CWhSfRjUQnQ
-
Observable
@observablehq
Yesterday, we hosted a webinar on “Strategies to fight dashboard rot” with Data Visualization Developer Robert Kosara (@eagereyes). If you weren’t able to join us, don’t worry — you can watch the recording here: www.youtube.com/watch?v=TygdZACjX9g
-
Observable
@observablehq
Wondering why your dashboards aren’t being used as much as they should be? Join us tomorrow for a webinar on fighting dashboard rot with Data Visualization Developer, Robert Kosara. You don’t want to miss it! streamyard.com/watch/pYcw3ThJH78b
-
Observable
@observablehq
Developers in the real estate industry can quickly combine digital 3D floor plans w/ data layers for fast interactive dashboards using @smplrspace + Observable. Learn how Smplrspace CTO @tibotiber uses Observable for user-facing analytics & internal BI:
old.observablehq.com/customer-stories/smplrspace -
Observable
@observablehq
The first step in fighting dashboard rot is making sure you’re building the right dashboards in the first place. Learn tips on how you can build and maintain better dashboards in next week’s webinar. streamyard.com/watch/pYcw3ThJH78b
-
Observable reposted
Ben Welsh
@palewire
⚡ The @observablehq docs now include an example of how we use its static-site framework at Reuters.
observablehq.observablehq.cloud/framework-example-loader-…
The new page shows how we publish data-heavy viz made in JS as lightweight PNGs. I used to take gnarly screenshots. Now I can easily automate the job! -
Observable
@observablehq
We recently published 6 examples to highlight what's possible when you build dashboards w/ code. In our new post, we share how Framework's flexibility (re: tools + workflows), components, & unlimited customization let us build exactly how & what we wanted: old.observablehq.com/blog/takeaways-from-building-showcas…
-
Observable
@observablehq
📣 Observable Framework now supports JSX + React ⚛️ Add JSX in a fenced code block (```jsx), then render content using our built-in display function. Learn more: observablehq.github.io/framework/jsx
-
Observable
@observablehq
Dashboards are critical for businesses, but maintaining them can be a pain. Join our webinar with Data Visualization Developer Robert Kosara (@eagereyes) to learn how to fight dashboard rot and ensure your dashboards stay relevant for the long haul: streamyard.com/watch/pYcw3ThJH78b
-
Observable
@observablehq
In our new example dashboard, we explore conditions of 91k+ U.S. dams. Features maps made w/ deck.gl, charts built w/ Observable Plot, and an R data loader to access & wrangle data on the back-end.
👉 See the dashboard & code: observablehq.observablehq.cloud/framework-example-us-dams/ -
Observable
@observablehq
What exactly is a static site generator, and why would it be a good thing? In this video, we describe how it works, and why it gives you faster dashboards, less load on your database servers, and more control over when your data updates.
www.youtube.com/watch?v=FQL2J7809a8 -
Observable
@observablehq
Frustrated with building dashboards that no one uses? In our upcoming webinar, Observable’s Robert Kosara (@eagereyes) will share strategies to fight dashboard rot. Learn what and when to build, how to keep your dashboards relevant, and more. streamyard.com/watch/pYcw3ThJH78b
-
Observable
@observablehq
Building dashboards is hard work — don’t let it go to waste. Learn how to prevent dashboard rot with strategies from Data Visualization Developer Robert Kosara (@eagereyes) in our upcoming webinar, July 16 at 10 AM PDT. Sign up today: streamyard.com/watch/pYcw3ThJH78b
-
Observable
@observablehq
Add interactivity to charts and tables to let viewers dive deeper into your data with checkboxes, sliders, radio buttons, etc. Choose an input from the Observable Inputs library, and update charts or tables to change based on its value.
observablehq.com -
Observable
@observablehq
When you build with code you can create fast, custom data apps and dashboards — without the constraints of legacy BI tools. Explore our showcase examples to see what’s possible: github.com/observablehq/framework/tree/main/examples
-
Observable
@observablehq
When dashboards focus on data recorded at a much higher resolution than what's needed to make decisions, viewers get stuck in the weeds. Learn how to align dashboards with the scales of business decisions to help viewers get from chart to decision, faster: old.observablehq.com/blog/align-dashboards-with-scales-of…
-
Observable
@observablehq
Unlock the power of code with Observable Framework. Use tools in our standard library to quickly build custom, interactive charts (with D3, Plot, deck .gl, Mosaic vgplot & more), or import any other JS library or component.
-
Observable
@observablehq
New examples just dropped! Get up and running with Observable Framework, faster. Explore and reuse code to customize pages, write and access outputs from data loaders (written in Python, SQL, R, JS, Rust, Julia, etc), and more: github.com/observablehq/framework/tree/main/examples
-
Observable
@observablehq
In Observable Framework you can build custom data apps with code, using the best tools for each job. Prep data snapshots in your language of choice — Python, SQL, Rust, R, or anything else. Then create fast, rich, interactive charts in JS. Learn more: old.observablehq.com/blog/write-troubleshoot-data-loaders
-
Observable
@observablehq
With Observable Framework you can import code into your data apps from npm, node_modules, local files, remote URLs, and libraries such as D3, Observable Plot, or DuckDB. Learn more: www.youtube.com/watch?v=MWbEWZEMx0o
-
Observable
@observablehq
Curious to try data loaders, but not sure where to start? Allison, our Developer Marketing Manager, broke down the what, why, and how of data loaders in a recent webinar. In under 20 minutes, learn the essentials you need to start writing your own: www.youtube.com/live/GHo0lwVZqfw?t=121&cbrd=1&ucbcb=1
-
Observable reposted
Mike Bostock
@mbostock
Observable Framework 1.9 🆕 is BIG! We now support JSX + React ⚛️, and significantly improved inline expression ${…} parsing and rendering. github.com/observablehq/framework/releases/tag/v1.9.0
-
Observable
@observablehq
We believe that better dashboards are built with code — but how? Our newest blog explores the benefits you unlock when you use code instead of legacy BI tools. old.observablehq.com/blog/three-ways-build-better-dashboa…
-
Observable
@observablehq
Dashboards are only valuable if they are used. Learn how you can create dashboards and data apps that maintain their value and engagement long term in our latest post. old.observablehq.com/blog/five-strategies-fight-dashboard…
-
Observable
@observablehq
A practical introduction to Observable Framework's data loaders: tips from the Observable team x.com/i/broadcasts/1djGXNPdQgoxZ
-
Observable
@observablehq
We ❤️ how @Smplrspace CTO @tibotiber uses Observable to interactively display air quality data, from exploration in notebooks to a final, production-ready dashboard in Observable Framework. This example features charts made w/ Plot and inputs & tables made w/ Observable Inputs.
Smplrspace
@smplrspace
We bring our visualization capabilities in the environment that your team relies on! This is Smplrspace used in @observablehq, the code-first BI tool for data teams. First, in Notebooks for data exploration, then in Framework for production-ready dashboards for decisions makers.
-
Observable reposted
Smplrspace
@smplrspace
We bring our visualization capabilities in the environment that your team relies on! This is Smplrspace used in @observablehq, the code-first BI tool for data teams. First, in Notebooks for data exploration, then in Framework for production-ready dashboards for decisions makers.
-
Observable
@observablehq
🕒 Final reminder! Tomorrow, June 6, join Observable team members for a practical introduction to data loaders. Learn how to write your own data loaders in any language, and using your favorite libraries, to create faster and richer data apps.
streamyard.com/watch/SucXSJZmsGar -
Observable
@observablehq
Observable Framework data apps use JavaScript for the front-end but allow you to use any language on the back-end to write data loaders. In this short video, see data loader examples in Python, R, shell scripts, and Julia.
www.youtube.com/watch?v=Q6lQRUTZpnU -
Observable
@observablehq
Welcome to June! Catch up on the latest from Observable with our newest blog posts and videos:
• Learn about how to write and troubleshoot data loaders in this blog post: old.observablehq.com/blog/write-troubleshoot-data-loadersPost not available here, view on X
Observable
@observablehq
• See examples of data loaders in Python, R, Julia and shell/DuckDB in this video: www.youtube.com/watch?v=Q6lQRUTZpnU
Observable
@observablehq
• Explore the end-to-end basics of Observable Framework in our latest video. Learn how to create a project, update themes, deploy to Observable, and view project analytics www.youtube.com/watch?v=HlZh4CcO3B4
-
Observable
@observablehq
Don't settle for slow data apps & dashboards. Join us June 6 for a practical introduction to data loaders. Learn how to write data loaders in any language, with your favorite libraries, to push time-consuming processing to build time for faster page loads: streamyard.com/watch/SucXSJZmsGar
-
Observable
@observablehq
When you've put so much effort into building a dashboard, you don't want to see it rot in obscurity. Here are five strategies for building better, more useful dashboards that retain their value (and visitors!) long term:
old.observablehq.com/blog/five-strategies-fight-dashboard… -
Observable
@observablehq
On June 6, join Observable team members for a practical introduction to data loaders in Observable Framework. Learn how to write and optimize data loaders that push time-consuming queries and analyses to build time for faster data apps. Sign up: streamyard.com/watch/SucXSJZmsGar
-
Observable
@observablehq
🚀 Ready to speed up your data apps? Join us on June 6 to learn how Observable Framework’s data loaders improve app performance and transform developer workflows. Don't miss out! streamyard.com/watch/SucXSJZmsGar
-
Observable
@observablehq
Quickly update the look and feel of your Framework data apps by setting themes for individual pages or the entire project. Choose from built-in themes made by Observable designers, or add your own stylesheet for limitless customization. Learn more: observablehq.github.io/framework/themes
-
Observable
@observablehq
Data loaders speed up data apps by pushing bulky data processing to build time and minimizing what's sent to the client. In our new post, the Observable team shares tips to write and troubleshoot data loaders, so you can start creating your own today: old.observablehq.com/blog/write-troubleshoot-data-loaders
-
Observable
@observablehq
In a new Observable Framework dashboard, @smplrspace CTO @tibotiber combines a 3D indoor CO2 heatmap with interactive charts made with Observable Plot. See it live: tibotiber.observablehq.cloud/smplrvable/, and start building with Observable today: observablehq.com
-
Observable
@observablehq
One of the benefits of using Observable Framework is that you can create faster data apps by writing data loaders to precompute static snapshots at build time. In our new blog post, our team shares their best tips to help you get started with data loaders: old.observablehq.com/blog/write-troubleshoot-data-loaders
-
Observable reposted
Mike Bostock
@mbostock
Observable Framework 1.7.1 🆕 outputs page stats during build so you can easily keep an eye on page weight for a great user experience! (We fixed a bunch o’ bugs, too.) github.com/observablehq/framework/releases/tag/v1.7.1
-
Observable
@observablehq
Interested in trying Observable Framework, but don't know where to start? Our new getting started video series is for you! See how easy it is to:
✨ Create your first data app
✏️ Write a data loader
🎨 Update page layout
🚀 Deploy to Observable
www.youtube.com/playlist?list=PLOHIJAFwtkEcuVZO6WK-Uuswd0… -
Observable reposted
matt rothenberg
@mattrothenberg
Here's the code for this @observablehq + React tooltip demo.
A few implementation details in 🧵
mattrothenberg.github.io/observable-plot-tooltip/ -
Observable
@observablehq
In our recent webinar, @mbostock discusses the “last mile” problem in data and shares how Observable Framework's data loaders offer a better solution.
👉 Watch now: www.youtube.com/watch?t=120&v=n5gFBQTClxc -
Observable
@observablehq
The best place to host your Framework data apps & dashboards is on Observable. Deploy (& redeploy) by following helpful prompts. Track usage with built-in analytics, control who has access, & manage settings all from your Projects page. Learn more: observablehq.com
-
Observable
@observablehq
Build the fastest data apps and dashboards with Observable Framework. It’s all code and file-based, so you can develop without limits using tools and languages you already know. Create, edit, and deploy your first project in minutes: observablehq.com
-
Observable
@observablehq
We had a busy April! Here are a few new resources from the Observable team that you might have missed:
● In our recent webinar, Observable founder Mike Bostock spoke about how to solve the last-mile problem in data apps. Watch it here: www.youtube.com/live/n5gFBQTClxc?cbrd=1&ucbcb=1
Observable
@observablehq
● We recently launched embedded analytics for data apps hosted on Observable. Paul Buffa (Director of Business Intelligence at Observable) shares how that helps you manage and track deployed apps: old.observablehq.com/blog/how-to-track-dashboards-enhance…
Observable
@observablehq
● Explore data loader examples in Python, R, Julia, and a shell script running DuckDB: old.observablehq.com/blog/data-loader-examples-r-python-s…
● Learn how to quickly deploy Framework projects to Observable in our new short video: www.youtube.com/watch?v=ed3RfgPPZ2w -
Observable
@observablehq
Explore data loader examples across R, Python, shell scripts, and Julia with Observable Framework in our latest blog post. Learn more and start coding: old.observablehq.com/blog/data-loader-examples-r-python-s…
-
Observable reposted
Mike Bostock
@mbostock
Observable Framework 1.7 🆕 changes the default source root to `src`, adds a new `typographer` markdown-it config option for smart quotes, improves node import compatibility, and offers faster incremental deploys to Observable! 🚀 github.com/observablehq/framework/releases/tag/v1.7.0
-
Observable
@observablehq
When you host Framework projects on Observable, analytics for your data apps are automatically built-in. That means you can immediately start tracking usage patterns with no additional setup. We agree with Brent: that really rocks.
Learn more: old.observablehq.com/blog/how-to-track-dashboards-enhance… -
Observable
@observablehq
Some built-in sample datasets (observablehq.com/@observablehq/sample-datasets) are failing to load in notebooks. We’re looking into it.
Observable
@observablehq
This has been resolved. Thank you for your patience!
-
Observable
@observablehq
Solving data’s last mile problem with Observable x.com/i/broadcasts/1yoKMwVXAXpJQ
-
Observable
@observablehq
The best place to host data apps built w/ Framework is on Observable. Deploy painlessly, control viewer access, manage project settings, & track app usage w/ built-in project analytics—all from your Observable account. Deploy a project in minutes: www.youtube.com/watch?v=ed3RfgPPZ2w
-
Observable
@observablehq
📢 Webinar tomorrow, April 25 @ 10AM PDT! Join founder Mike Bostock as he discusses the "last mile" problem in data. Discover how our innovative architecture & data loaders help you create richer, better, faster data apps. Register to secure your spot: streamyard.com/watch/NqWNUC9EqDnb
-
Observable
@observablehq
Build the fastest data apps and dashboards with Observable Framework. It’s all code and file-based, so you can develop without limits using tools and languages you already know. Create, edit, and deploy your first project in minutes: observablehq.com
-
Observable
@observablehq
Earlier this week we announced an exciting new feature: Framework projects hosted on Observable now include built-in analytics. Track trends in project and page traffic, and see regular visitors, to better manage your data apps and dashboards. Learn more: old.observablehq.com/blog/how-to-track-dashboards-enhance…
-
Observable
@observablehq
Don’t miss our webinar next week on Thursday April 25th with our founder, @mbostock. Learn more about data’s “last mile” problem and see how Observable Framework’s data architecture, developer experience & workflows help you build faster, richer data apps. streamyard.com/watch/NqWNUC9EqDnb
-
Observable
@observablehq
Observable Framework projects hosted on Observable now include built-in analytics! See project status, visitor engagement, and page visit timeline. observablehq.com/blog/how-to-track-dashboards-enhanced-an…
-
Observable
@observablehq
Join our Apr 25 webinar w/ founder @mbostock to learn about Observable’s end-to-end solution for data analysis & presentation. See how Framework's data architecture, developer experience & workflows help you build faster, richer data apps: streamyard.com/watch/NqWNUC9EqDnb
-
Observable reposted
Mike Bostock
@mbostock
Observable Framework 1.6 🆕 adds importing from node_modules! 📦 This lets you manage dependencies with npm or Yarn, import private packages, or import from a different package registry such as GitHub. github.com/observablehq/framework/releases/tag/v1.6.0
-
Observable
@observablehq
Happy Monday! Here are of our some recent posts you might have missed:
- Sign up for our webinar on April 25th with founder Mike Bostock, Solving data’s last-mile problem with Observable: streamyard.com/watch/NqWNUC9EqDnb
1/2
Observable
@observablehq
- Read our latest blog post Crafting data colors and staying on brand: observablehq.com/blog/crafting-data-colors
- Watch our latest short video Grids, cards, and themes: customize the look and layout of Framework pages: youtu.be/HuYRuRdQMeU
2/2 -
Observable
@observablehq
In our new video, learn how to customize the look & layout of Observable Framework projects in minutes. Choose from built-in themes to update an entire project or individual pages. Use grid & card classes to organize content in dashboards & data apps. www.youtube.com/watch?v=HuYRuRdQMeU
-
Observable
@observablehq
📣 Upcoming webinar alert! Hear directly from our founder, @mbostock, about the last-mile problem that data teams face and how better data architecture (and data loaders!) can help you build faster, richer data apps. RSVP to join us on April 25th: streamyard.com/watch/NqWNUC9EqDnb
-
Observable
@observablehq
🎨 The right color choices can bring your charts and dashboards to life. Learn best practices for effectively choosing colors for your displays of data in this new blog post. observablehq.com/blog/crafting-data-colors
-
Observable
@observablehq
Some Observable users reported issues with notebooks loading and running properly over the past ~5 hours. The issue was related to our recent network maintenance and is now resolved. Please reach out if you continue to experience any problems!
-
Observable
@observablehq
Observable Framework makes data journalists go "asdlfjkhalsdfhjlkasdhfjklahdsfjkljadkslfhjkadshfjlasd" — in a good way! Learn how Framework helps data viz developers build & deploy fast, custom apps & dashboards using tools they already know & love: observablehq.com
-
Observable
@observablehq
ICYMI, here are some of our recent posts and videos:
- Learn how a dashboard is put together with code, using Framework and Plot: observablehq.com/blog/how-to-build-dashboards-observable-…
- Then add an interactive control to the dashboard that lets the user pick the data: observablehq.com/blog/how-to-add-interactivity-observable…
(1/3)
Observable
@observablehq
- Create your first Framework project by following this detailed walkthrough video, in <5 minutes: youtu.be/N2qiGG2RqwY
- Now that your project is up and running, write a data loader to access your data from any source: youtu.be/HtlNctuB8ho
(2/3)
Observable
@observablehq
- Finally, go into more depth on how to use SQL and DuckDB in your project: youtu.be/Urf_bPFyhIk
We’ve released several updates to Framework, like querying remotely-hosted data, live updates to the project config, easier project sharing, etc: observablehq.com/release-notes
(3/3) -
Observable
@observablehq
Our site was just unavailable for about ten minutes; it seems to be working now, but let us know if you have issues. We are looking into it.
Observable
@observablehq
Our database outage is resolved. The site should be fine now, but, as ever, let us know if you see any issues. We’re sorry for the disruption.
-
Observable
@observablehq
🎛️ 📊 Interactive dashboards: Our latest blog expands on building dashboards with Observable Framework and Plot, showing how to add interactivity and deliver higher value insights to end-users.
Dive in! observablehq.com/blog/how-to-add-interactivity-observable… -
Observable reposted
Mike Bostock
@mbostock
Observable Framework 1.5 is out! 🆕 Config changes now live-update during preview; the socket automatically reconnects if the preview server restarts; external links now have rel=noreferrer by default; and more in the release notes. 👇 github.com/observablehq/framework/releases/tag/v1.5.0
-
Observable
@observablehq
Just 2 steps to start writing client-side SQL queries powered by DuckDB in Observable Framework:
1️⃣ Register tables (from local or externally-hosted files) in page front matter
2️⃣ Write queries in SQL fenced code blocks
Learn more in our new video! www.youtube.com/watch?v=Urf_bPFyhIk
Observable
@observablehq
Read about more options to work with SQL in Framework projects, and stay up to date with new additions & developments, in our Framework docs: observablehq.com/framework/sql
-
Observable
@observablehq
In Observable Framework, you can build faster data apps & dashboards by writing data loaders that minimize files & client-side data processing. Read more about why we embrace data loaders for speed, polyglot workflows, & thoughtful dashboard design: observablehq.com/blog/data-loaders-for-the-win
-
Observable
@observablehq
Same, Stephanie. Observable Framework is made for developers who want to build fast, expressive data apps and dashboards with their existing tools and workflows — and without constraints. Learn more at observablehq.com
-
Observable
@observablehq
Our scheduled maintenance is now complete and all systems are operating normally. Thank you for your patience!
-
Observable
@observablehq
The Observable platform will be undergoing scheduled maintenance for the next 30 minutes and the site may be unavailable during this time. We will post an all-clear once the maintenance is complete.
-
Observable
@observablehq
We 💚 hearing how folks are building with Framework!
👉Learn how @eng_mclare built and deployed a Framework project mapping potential retrofit solutions to reduce carbon emissions from Boston buildings: mclare.blog/posts/building-oss-map-apps-with-observable-f… -
Observable
@observablehq
ICYMI, we've made big updates to Observable Framework since launch, including:
- Windows support
- Support for Node 18 & self-hosted npm imports
- SQL code blocks powered by DuckDB
- Mosaic vgplot integration
+ more!
See what's new in our release notes👇
observablehq.com/release-notes -
Observable reposted
Mike Bostock
@mbostock
Observable Framework 1.4 🆕 supports externally-hosted (live) SQL data sources, the DuckDB database file format, local assets in head/header/footer, file.lastModified, decoupled build & deploy, and more! github.com/observablehq/framework/releases/tag/v1.4.0
-
Observable
@observablehq
In our new blog post, learn about data loaders in Observable Framework, and why we see them as a "win-win-win" for building data apps and dashboards — a win for polyglot developers and teams, a win for performance, and a win for decision-makers. observablehq.com/blog/data-loaders-for-the-win
-
Observable
@observablehq
With Observable Framework, you can write data loaders in any language to generate static data snapshots at build time. In our new video, learn how you can quickly add a data loader, access the output in a page, and see updates in the preview server: www.youtube.com/watch?v=HtlNctuB8ho
-
Observable
@observablehq
You can paste @thisritchie’s example into an Observable Framework project to load a Google Sheet and get a table view thanks to @duckdb:
```sql echo
SELECT *
FROM read_csv_auto('docs.google.com/spreadsheets/export?format=csv&id=1GuEPkw…', normalize_names=True);
```
Learn more: observablehq.com/framework/sql -
Observable reposted
Mike Bostock
@mbostock
Observable Framework 1.3 🆕 integrates @uwdata’s Mosaic vgplot, which can concisely expressive performant coordinated views of millions of data points. observablehq.com/framework/lib/mosaic
-
Observable
@observablehq
Observable Framework combines JavaScript on the front-end for interactive graphics, with any language (Python, SQL, R, or anything else) for data wrangling & analysis on the back-end, bridging the gap between data work & app development.
Learn more: observablehq.com -
Observable
@observablehq
In our new video, learn how you can create an Observable Framework project, make updates in whatever editor you choose, and see changes instantly in live preview as you iterate — all in just a few minutes: youtu.be/N2qiGG2RqwY
-
Observable reposted
Mike Bostock
@mbostock
Observable Framework 1.2 is now out, adding SQL code blocks and sql tagged template literal powered by @duckdb! github.com/observablehq/framework/releases/tag/v1.2.0
-
Observable
@observablehq
Learn how we used Observable Plot and Observable Framework to create our primary mortgage market survey example by reading our latest blog post from @eagereyes observablehq.com/framework/examples/mortgage-rates/
observablehq.com/blog/how-to-build-dashboards-observable-… -
Observable reposted
Mike Bostock
@mbostock
Observable Framework 1.1 is out! 🚀 A HUGE release less than three weeks from launch (+2,508 -1,805 to src). Highlights: Windows, self-hosted npm: imports, Node 18+, Yarn Berry, CommonMark compatibility, draft mode, markdown-it plugins. More below. 👇 github.com/observablehq/framework/releases/tag/v1.1.0
-
Observable reposted
Simon Willison
@simonw
I wrote about the interesting ideas in the new Observable Framework system for building and publishing statically hosted interactive dashboards - @observablehq
simonwillison.net/2024/Mar/3/interesting-ideas-in-observa… -
Observable
@observablehq
For a comprehensive view of Observable Plot repo stats, we built an Observable Framework project using TypeScript data loaders on the back-end to create this bento box style dashboard. See it in action: observablehq.com/framework/examples/plot/
-
Observable
@observablehq
We used Observable Framework to visualize >7M individual requests and to uncover hidden patterns in our web traffic. See how Framework is helping us reveal bugs, optimize routes, and manage traffic in this example: observablehq.com/framework/examples/api/
-
Observable
@observablehq
Conventional dashboards are slow to load and surface only shallow insights. Observable Framework uses data loaders that run queries on build so your data apps load instantly. Since data loaders run on your servers you control privacy and security. observablehq.com/framework
-
Observable
@observablehq
Observable Framework is the tool we’ve always wanted for building data apps. It’s the polyglot developer’s dream, open-source, and integrates seamlessly with your workflow — develop locally, use any language and any library. observablehq.com
-
Observable
@observablehq
When you build data apps, dashboards, and reports with Observable you combine the power of JavaScript on the front-end for interactive graphics with any language on the back-end for data preparation and analysis. Learn more in the docs: observablehq.com/framework
-
Observable
@observablehq
Today we’re launching a bold new vision: an open-source static site generator — Observable Framework — for creating fast, beautiful data apps you can host anywhere. Use JavaScript for interactive graphics with Python, R, or any language for data analysis. observablehq.com
-
Observable
@observablehq
Inspired by the tips in @sarah_h_cohen’s book “Numbers in the Newsroom: Using Math and Statistics in News”, @palewire is building a calculator collection. Margins of error, all sorts of rates, & even a guideline for how many stats to cram into a sentence: observablehq.com/collection/@palewire/numbers-in-the-news…
Ben Welsh
@palewire
For the first time in a bit, I had to run some z-scores.
To cement the math in my mind, I slapped together this @observablehq calculator.
observablehq.com/@palewire/z-score-calculator
It's the latest add to my "Numbers in the Newsroom" @sarah_h_cohen tribune act.
Hope it helps. Z's are useful! -
Observable reposted
Harry Stevens
@Harry_Stevens
As always, I published the code to process the data and produce the charts on @observablehq.
🌡️ Air temperature: observablehq.com/@climatelab/global-air-temperature-month…
🌊 Sea surface temperature: observablehq.com/@climatelab/global-sea-surface-temperatu…
🧊 Arctic sea ice extent: observablehq.com/@climatelab/arctic-sea-ice-extent-monthl… -
Observable
@observablehq
Lately we’ve been trying to reduce clutter. We removed hovercards, tags, and insights from the notebook and we reverted to the smaller add cell menu to stay out of your way while you code. See these changes and more at our revamped release notes: observablehq.com/release-notes
-
Observable
@observablehq
📈 Learn how to swiftly connect D3 visualizations with SQL queries in Observable, which will empower you to refine your visualizations using SQL code.
👉 www.youtube.com/watch?v=M4HOv62act4 -
Observable
@observablehq
🖼️ Our D3 gallery has 160+ mind-blowing visualizations, from sleek line charts to mind-boggling bivariate choropleths.
Check it out here: observablehq.com/@d3/gallery -
Observable
@observablehq
#icymi when you work together in a notebook, you'll see live updates when it's shared, paused or renamed. You can now seamlessly stay in sync with your team! 🤝
-
Observable
@observablehq
💫 Notifications for Pro and Enterprise users is now in public beta. You can send charts, CSVs, and other messages to email and Slack from a notebook on a schedule you choose.
📰 Read more: observablehq.com/blog/scheduled-notifications -
Observable
@observablehq
⬇️ Let us know what you think of Observable Plot 0.6.12!
Mike Bostock
@mbostock
Full release notes here. Please send us your suggestions and feedback! github.com/observablehq/plot/blob/main/CHANGELOG.md
-
Observable reposted
Mike Bostock
@mbostock
Observable Plot 0.6.12 is here! 🎉 Featuring: a universal rect mark, new default categorical colors, a difference mark for comparing metrics, and more! 🧵 github.com/observablehq/plot/releases/tag/v0.6.12
-
Observable
@observablehq
Right now our notifications feature only supports email and Slack.
🧐 What would you most want Observable to be able to send to? (You might be able to do it today, especially with a CORS proxy.) -
Observable
@observablehq
💡 Did you know Slack has a great no-code “Block Kit Builder” app.slack.com/block-kit-builder/ for constructing message layouts, which you can now send from a notebook.
👉 See how in docs: observablehq.com/documentation/notebooks/notifications -
Observable reposted
DEEPSHA MENGHANI
@bigdatadipper
#30daymapchallenge - That’s a wrap folks. These challenges are so helpful to learn new things and most importantly to find that amazing community of support and growth.
@observablehq collection of all plots: observablehq.com/collection/@deepsha/30-day-map-challenge -
Observable
@observablehq
🤔What notebook do you check most often?
💡Maybe you should schedule it to send its key chart or metric as a daily notification:
observablehq.com/documentation/notebooks/notifications -
Observable reposted
Reony
@megaroeny
Okay, if you're looking for #datavisualization inspiration, you gotta check out @observablehq!! 🤩
Been playing with it for a couple days, and it's very intuitive. Basic understanding of JSON/CSV is needed.
There's even an embedded AI chat to assist you with creating them! -
Observable reposted
DEEPSHA MENGHANI
@bigdatadipper
Day 14 - Europe #30daymapchallenge , hydro energy distribution with Norway topping the chart.
@observablehq code: observablehq.com/d/9aeb73c82fedc8a4 -
Observable
@observablehq
💫Notifications for Pro and Enterprise users is now in public beta. You can send charts, CSVs, and other messages to email and Slack from a notebook on a schedule you choose.
📰Read more: observablehq.com/blog/scheduled-notifications
Observable
@observablehq
We’ve had that chart of Observable Plot npm downloads in a notebook for years, but now we get it daily in Slack. Instead of having to check the notebook (and tell people about it), we can all react 💯 every time it hits new highs.
Observable
@observablehq
Any DOM cell, like charts and tables, is rasterized as an image. Data is serialized as CSV (if tabular) or JSON and sent as an attachment.
💡Let us know if you have questions, and tell us how you want to use this! -
Observable
@observablehq
📊 In our latest Observabyte @allison_horst shows you how to use the Chart cell to craft and refine your visuals, starting with simple plots to fully customized JavaScript creations.
It's plotting made simple. 👍
Watch here: www.youtube.com/watch?v=SsFyayu5csc -
Observable
@observablehq
📈 Our Observable documentation is your go-to guide for everything from inputs to embeds.
Explore, learn, and create with us. 🛠️
👉 observablehq.com/documentation/ -
Observable
@observablehq
Halloween may be over but always fun to see what stories keeps our fear going. 👻
Check out this notebook below by @DeepaliKank!
Deepali Kank
@DeepaliKank
#tidytuesday week 44 - Horror Legends. This one is created in Observablehq.
Code: observablehq.com/d/bcc90111d5347ea7
#dataviz -
Observable
@observablehq
⚡ Join us tomorrow for our FINAL session of our Introduction to Data Viz in Observable Plot series with @allison_horst
🎟️ Register here for free: observablehq.com/@observablehq/introduction-data-visualiz…
📼 Missed previous sessions? No problem watch and catch up starting here: www.youtube.com/watch?v=tHorkp-WCQY&t=4s -
Observable
@observablehq
📈 Day 2 of our Data Viz in Observable Plot course with @allison_horst is tomorrow!
🧠 Whether you're new to JavaScript or an experienced dev, this course has you covered. Sign up for free: observablehq.com/@observablehq/introduction-data-visualiz…
📼 Missed Day 1? Watch it here: www.youtube.com/watch?v=tHorkp-WCQY&t=4s -
Observable
@observablehq
💡Discover core concepts and build interactive charts with our 4-part course series on Observable Plot with @allison_horst.
📊From scatterplots to tooltips, we've got you covered.
🎟️ Join us and register here for free: observablehq.com/@observablehq/introduction-data-visualiz… -
Observable
@observablehq
💡New to Observable Plot or D3? AI Assist can help!
🧠AI Assist is your reliable coding partner, helping you generate initial charts, customize, and troubleshoot. Plus, get 70,000 tokens for Pro and Enterprise users this October!🎁
Read about it here: old.observablehq.com/blog/improving-ai-assist -
Observable reposted
Allison Horst
@allison_horst
📢Tomorrow at 9am PT!!! Join me, @tanya_shapiro and @bigdatadipper for a fun discussion about the Why and How of getting started w/ data visualization in JavaScript with Observable Plot ✨
Observable
@observablehq
🌐 Web dev evolves; JavaScript's key for visuals. Discover Observable Plot by D3 creators.
🗣 Join a chat with experts @tanya_shapiro & @bigdatadipper, hosted by @allison_horst. ✨
💡 Curious about JavaScript in data viz? Then register here: lu.ma/zyvijww3 -
Observable
@observablehq
🌐 Web dev evolves; JavaScript's key for visuals. Discover Observable Plot by D3 creators. 📷 Join a chat with experts @tanya_shapiro & @bigdatadipper, hosted by @allison_horst!
📷 Register here and join us Thursday: lu.ma/zyvijww3 -
Observable
@observablehq
🌟 Learn Data Visualization with @allison_horst in Observable Plot!
🔗 Join Observable for hands-on experience & a certificate: observablehq.com
🎟 Register here: observablehq.com/@observablehq/introduction-data-visualiz…
#dataviz -
Observable
@observablehq
🌐 Web dev evolves; JavaScript's key for visuals. Discover Observable Plot by D3 creators.
🗣 Join a chat with experts @tanya_shapiro & @bigdatadipper, hosted by @allison_horst. ✨
💡 Curious about JavaScript in data viz? Then register here: lu.ma/zyvijww3 -
Observable
@observablehq
UPDATE: As of 8am PT/11am ET maintenance is complete.
Thank you for patience.
Observable
@observablehq
Scheduled maintenance will begin today at 7am PT/ 10am ET and is expected to last approximately 60 minutes.
For any questions or concerns, please contact us at support@observablehq.com -
Observable
@observablehq
Scheduled maintenance will begin today at 7am PT/ 10am ET and is expected to last approximately 60 minutes.
For any questions or concerns, please contact us at support@observablehq.com -
Observable
@observablehq
Master the art of data viz! 💡 Learn from @allison_horst expertise in Observable Plot - tooltips, annotations, and beyond in our latest observabyte!
▶️ Watch here: www.youtube.com/watch?v=UlKpAS5xPNA -
Observable
@observablehq
💡Discover core concepts and build interactive charts with our 4-part course series on Observable Plot with @allison_horst.
📊From scatterplots to tooltips, we've got you covered.
🎟️ Join us and register here for free: observablehq.com/@observablehq/introduction-data-visualiz… -
Observable
@observablehq
👀 Explore the magic of JavaScript in data viz!
🗣️ Join us for this amazing panel with @tanya_shapiro, @bigdatadipper, and host + Data Science Advocate @allison_horst, as they discuss the power of Observable Plot. 🌐
👉 Register here: lu.ma/zyvijww3 -
Observable
@observablehq
💫🚀Transform how you visualize data! AI Assist is now your go-to for Observable Plot, D3, and real-time troubleshooting.
And here’s a treat 🎁 - 70,000 tokens for all Pro & Enterprise users this October.
Read more about it here: observablehq.com/blog/improving-ai-assist -
Observable
@observablehq
💡Discover core concepts and build interactive charts with our 4-part course series on Observable Plot with @allison_horst.
📊From scatterplots to tooltips, we've got you covered.
🎟️ Join us and register here for free: observablehq.com/@observablehq/introduction-data-visualiz… -
Observable reposted
Simon Willison
@simonw
Built an @observablehq notebook inspired by this tweet - if it doesn't crash your browser (it crashed Mobile Safari for me a few times) it will let you select any image to run object detection on it, entirely in JavaScript!
observablehq.com/@simonw/detect-objects-in-images
Per Borgen
@perborgen
Computer vision in the browser in less than 10 lines of JavaScript 🔥
-
Observable
@observablehq
🏁 It's a bar chart race! By our very own @mbostock, this chart animates the value of the top global brands from 2000 to 2019.
🏎️ Take a look here: observablehq.com/@d3/bar-chart-race?intent=fork -
Observable
@observablehq
📊 Refine your D3 visualizations using SQL!
💫 Check out our latest Observabyte video with @pbbuffa on how Observable uses @duckdb to treat any tabular data as SQL.
▶️ www.youtube.com/watch?v=M4HOv62act4 -
Observable
@observablehq
Sign up and join @allison_horst for some good plot conversation! #spooknotincluded 👻
👉 lu.ma/zyvijww3
Allison Horst
@allison_horst
🎃👻 My favorite month of the year is coming up and it is filled to the cauldron’s brim with Observable Plot events and learning opportunities. Check them out, sign up, join me for some howling good times with Observable Plot in October! 🖤🦇🧌👇👇👇
-
Observable
@observablehq
#icymi: 🚀 Psst... ever wanted to snap a PNG from your notebook? Now you can. 🖼️
📰Check out our release notes for the full scoop:
observablehq.com/blog/september-release-recap -
Observable
@observablehq
When adding a transition in D3...
-
Observable
@observablehq
Another quick-tip vid for you!
🎥 Discover the magic of Iterative Design using our History pane with @pbbuffa!
📊Perfect your D3 visualizations, auto-save every step of the way!
▶️ www.youtube.com/watch?v=m3U6Z_-cX78 -
Observable reposted
DEEPSHA MENGHANI
@bigdatadipper
I’m so excited to chat with two of my favorite people about @observablehq Plot, counting days!! 🥳🥹
Allison Horst
@allison_horst
Can't wait for this chat w/ the wonderful @bigdatadipper & @tanya_shapiro on their motivation, experience, tips & tricks, and insights on learning & building *amazing* #dataviz with Observable Plot!
Join us on October 12! 🎉
Observable
@observablehq
👀Explore the magic of JavaScript in data viz!
🗣️ Join us for this amazing panel with @tanya_shapiro, @bigdatadipper, and host + Data Science Advocate @allison_horst, as they discuss the power of Observable Plot. 🌐
👉 Register here: lu.ma/zyvijww3 -
Observable
@observablehq
#icymi Navigating your data workspace just got simpler!
🚀 Check out the latest our latest updates. From reworked navigation to default workspace settings, we’re making sure your focus stays on data:
observablehq.com/blog/september-release-recap -
Observable
@observablehq
👀Explore the magic of JavaScript in data viz!
🗣️ Join us for this amazing panel with @tanya_shapiro, @bigdatadipper, and host + Data Science Advocate @allison_horst, as they discuss the power of Observable Plot. 🌐
👉 Register here: lu.ma/zyvijww3 -
Observable
@observablehq
📊 Learn the seamless way to load any version of D3 with the help of Observable and our Head of Product Education: @pbbuffa
Watch here 👉 www.youtube.com/watch?v=akC4_8Gxw6I -
Observable
@observablehq
⚡ Thank you for being a part of Days 1 and 2 of our Intro to D3 with Observable series! Tomorrow join us for Day 3 as @pbbuffa continues our series.
🎟️ It's not too late to be a part of this experience!
Register now and elevate your D3 skills: observablehq.com/@observablehq/introduction-to-d3-course.
Observable
@observablehq
📼 For those who missed out, you can catch up here:
Day 1: www.youtube.com/watch?v=CCBTX2pI2fU&t=1600s
Day 2: www.youtube.com/watch?v=Crp8UX-eQB0 -
Observable
@observablehq
💡Discover core concepts and build interactive charts with our 4-part course series on Observable Plot with @allison_horst.
📊From scatterplots to tooltips, we've got you covered.
🎟️ Join us and register here for free: observablehq.com/@observablehq/introduction-data-visualiz… -
Observable
@observablehq
🚀Starting in just 30 minutes!
Dive into D3 with @pbbuffa! In 5 sessions, master bespoke visuals, web essentials, and dynamic animations.
🎟Whether you're a newbie or a pro, we've got you covered. observablehq.com/@observablehq/introduction-to-d3-course -
Observable
@observablehq
🚀 New feature: Navigate with ease and keep your focus on what matters with our revamped workspace experience. Content, settings, & teammates—all organized just for you.
🌟 Learn more about our workspace navigation here: observablehq.com/@observablehq/release-notes -
Observable
@observablehq
💡 New to Observable? Our live workshop, by @pbbuffa, will equip you with essential tools and methods.
🎟️ Join us and RSVP here:observablehq.com/@observablehq/learn-observable-workshop-… -
Observable
@observablehq
🖥️ @pbbuffa breaks it down: Set up Observable Inputs to your D3 viz to effortlessly test, design, and team up with non-devs.
🎞️Embrace the future of flexible visualization. Watch and learn: youtu.be/6HEC5sgfXI8 -
Observable
@observablehq
Dive into D3 with @pbbuffa! In 5 sessions, master bespoke visuals, web essentials, and dynamic animations. Whether you're a newbie or a pro, we've got you covered. 🚀
👉 observablehq.com/@observablehq/introduction-to-d3-course -
Observable
@observablehq
💡 New to Observable? Our live workshop, led by @pbbuffa, will equip you with essential tools and methods.
🎟️ Join us and RSVP here:observablehq.com/@observablehq/learn-observable-workshop-… -
Observable
@observablehq
🖥️ @pbbuffa breaks it down: Set up Observable Inputs to your D3 viz to effortlessly test, design, and team up with non-devs.
🎞️Embrace the future of flexible visualization. Watch and learn: youtu.be/6HEC5sgfXI8
Observable
@observablehq
Learn more about inputs here: observablehq.com/@observablehq/inputs
-
Observable
@observablehq
Dive into D3 with @pbbuffa! In 5 sessions, master bespoke visuals, web essentials, and dynamic animations. Whether you're a newbie or a pro, we've got you covered. 🚀
👉 observablehq.com/@observablehq/introduction-to-d3-course -
Observable reposted
Steve Krouse
@stevekrouse
our new json inspector look familiar?
thanks @observablehq for the great open source component! -
Observable
@observablehq
🎨📊 Ever wondered how top-notch web visualizations are made? Discover @d3js_org with us, from web essentials to dynamic interactions.
Whether you're a seasoned pro or just starting out, there's something for everyone.
👉 observablehq.com/@observablehq/introduction-to-d3-course -
Observable
@observablehq
💫 Discover the revamped Add Cell Menu! With faster search, sample data, and seamless database connections for Pro users, it's all about making your data tasks effortless.
👉 observablehq.com/@observablehq/release-notes -
Observable
@observablehq
💡 New to Observable? Join us TOMORROW for our workshop led by @pbbuffa, we will equip you with essential tools and methods.
🎟️ Join us and RSVP here: observablehq.com/@observablehq/learn-observable-workshop-… -
Observable
@observablehq
Want to play a game? 😏
Dive into this notebook for a fun break! 🎮 Enjoy the games and join us in revisiting some of our beloved classic notebooks.
🕹️ observablehq.com/d/43d3817f0cbcc34e -
Observable
@observablehq
🧠 #ai Assist in our platform is like that genius friend who's always got your back. From brainstorming to coding, get help right in your notebook.
➡️ observablehq.com/blog/ai-assist -
Observable
@observablehq
💡 New to Observable? Our live workshop, led by @pbbuffa, will equip you with essential tools and methods.
🎟️ Join us and RSVP here: observablehq.com/@observablehq/learn-observable-workshop-… -
Observable
@observablehq
🚀 The launch of AI Assist in Observable marks a new era, and our founder and CEO, @mmeckf, has a special message to share about this exciting new chapter!
👉 To learn more about AI Assist: old.observablehq.com/blog/ai-assist -
Observable
@observablehq
🎶 Let's make some music. Experiment and render music with this virtual piano by user Claudio Esperança.
👉 observablehq.com/@esperanc/music-experiments -
Observable
@observablehq
💡 New to Observable? Our live workshop, led by @pbbuffa, will equip you with essential tools and methods.
🎟️ Join us and RSVP here: observablehq.com/@observablehq/learn-observable-workshop-… -
Observable
@observablehq
🚀 AI Assist is here. Ask questions and get help right in your notebooks. Available in beta for Pro and Enterprise users, tap into generative AI to breeze past tedious tasks and boost your data workflow. 📊
👉 See what AI Assist can do for you: old.observablehq.com/blog/ai-assist -
Observable
@observablehq
💡 New to Observable? Our live workshop, led by @pbbuffa, will equip you with essential tools and methods.
🎟️ Join us and RSVP here: observablehq.com/@observablehq/learn-observable-workshop-… -
Observable
@observablehq
🙏🎓 We are grateful for all the positive feedback and kudos on the comments from everyone who has enrolled in our workshops and courses.
🤝 Stay connected and in the loop for upcoming events, workshops and more: luma.com/observablehq -
Observable
@observablehq
🎓🍎 Getting ready for the next semester with Observable? We get it - it's a big task.
😀 Good news: our engineers have been busy creating features to boost your teaching. As you plan, look out for these tools to smooth your prep.
👉 observablehq.com/blog/fall-23-essential-features -
Observable
@observablehq
🎨 User @Jwolondon has brilliantly reimagined William Playfair's bespoke 1822 chart using Plot.js. A modern twist to classic design.
Delve into the relationship between Wheat and Wages over centuries! 🌾💰
➡️ observablehq.com/@jwolondon/wheat-and-wages -
Observable
@observablehq
💡📊 Need some ideas for how to visualize your data? There are numerous openly shared data viz examples from our community that you can check out for inspiration, then import or fork for fast reuse and customization!
🤝 observablehq.com/community -
Observable
@observablehq
💡 New to Observable? Our live workshop, led by @pbbuffa, will equip you with essential tools and methods.
🎟️ Join us and RSVP here: observablehq.com/@observablehq/learn-observable-workshop-… -
Observable reposted
Wálé
@SQLBrethen
@observablehq >>>
-
Observable
@observablehq
🏞️ User Eric Mauvière's visuals showcase the beauty of animal transfers between farms & mountain pastures, highlighting the importance of public lands. A fresh perspective on #ecosystemservices
🔎 Explore their notebook here: observablehq.com/@ericmauviere/a-flow-map-with-plot-geo -
Observable
@observablehq
💡 New to Observable? Our live workshop, led by @pbbuffa, will equip you with essential tools and methods.
🎟️ Join us and RSVP here: observablehq.com/@observablehq/learn-observable-workshop-… -
Observable reposted
Deepali Kank
@DeepaliKank
#tidytuesday week 31: US States. Grid plot of US States in @observablehq. Editing in #figma
Code: observablehq.com/d/81d0ac1b0b29eadb
#datavisualization -
Observable
@observablehq
🎨📊 Using Figma & Observable together? We curated a mini walkthrough for you! Get ready to blend it into your workflow with @pbbuffa
➡️ www.youtube.com/watch?v=lCvF4zEBls0 -
Observable
@observablehq
😵💫Did you manage to start an infinite loop (or some other code fire that's keeping your notebook from running properly), need to troubleshoot? You can debug our notebooks in safe mode - a code-only view of your notebook where cells aren't executed.
👉 observablehq.com/@observablehq/safe-mode/safe -
Observable
@observablehq
🎓🍎 Getting ready for the next semester with Observable? We get it - it's a big task.
😀 Good news: our engineers have been busy creating features to boost your teaching. As you plan, look out for these tools to smooth your prep.
👉 observablehq.com/blog/fall-23-essential-features -
Observable
@observablehq
🧑🎨 A versatile yet simple interactive by @Deabankova: Experiments in feTurbulence' svg from grainy and fuzzy to watercolour-ish.
🎨 observablehq.com/d/ba66d5ad47960e4f -
Observable
@observablehq
🙏 Thank you for joining us for our 'Data Science workflows in JavaScript series' with @allison_horst! We hoped you gained great insight and learned a lot!
❗ Missed our sessions? Be sure to click the link below and join us next time!
📼 www.youtube.com/playlist?list=PLOHIJAFwtkEdet7H_kXI0POh5x… -
Observable
@observablehq
📉 @stackoverflow sees a significant dip in usage over the past 18 months.
Traffic is down by ~50%, mirrored by a drop in questions, answers & votes.
👉 Check out the interactive by @ayhanfuat : observablehq.com/@ayhanfuat/the-fall-of-stack-overflow -
Observable
@observablehq
🎉 Want to dive into the world of Observable? Say hello to Observa-bytes!
📹🚀 These bite-sized videos are the perfect way to kickstart your journey with us!
💻 Let's learn together, fork and explore!
👉 www.youtube.com/playlist?list=PLOHIJAFwtkEetcq38Y-oCKlBta… -
Observable
@observablehq
💡Join us TOMORROW for our final session with @allison_horst. We will explore new data wrangling methods, leveraging DuckDB for seamless JS and SQL integration & more.
🎟️ Sign up here: observablehq.com/@observablehq/data-science-workflows-in-…
Observable
@observablehq
📼 Catch up with sessions 1 & 2 here: www.youtube.com/playlist?list=PLOHIJAFwtkEdet7H_kXI0POh5x…
-
Observable reposted
Seth Walder
@SethWalder
My friend @tophtucker created this handy tool to create weighted radar charts* out of the Receiver Tracking Metrics.
You can easily compare multiple players from the same season or the same player over multiple years!
observablehq.com/@tophtucker/espn-receiver-tracking-weigh… -
Observable
@observablehq
💡 Thanks for joining us for session 2 of Data Science workflows in JS. Join us on 7/25 fo our final session with @allison_horst. We will explore new data wrangling methods, leveraging DuckDB for seamless JS and SQL integration & more.
🎟️ Sign up here: observablehq.com/@observablehq/data-science-workflows-in-…
Observable
@observablehq
📼 Catch up with sessions 1 & 2 here: www.youtube.com/playlist?list=PLOHIJAFwtkEdet7H_kXI0POh5x…
-
Observable reposted
Moritz Stefaner
@moritz_stefaner
Really impressed by the recent updates to @observablehq plot.js — this framework is maturing so thoughtfully and quickly! Kudos to @mbostock @recifs et al.
observablehq.com/@observablehq/plot-gallery -
Observable
@observablehq
📊 💻 Check out this donut-shaped graphical race by user Christophe Yamahata, showcasing the collapse of the once-dominant Netscape Navigator and the exciting transformation of web browsers. 🌐
👉 observablehq.com/@christophe-yamahata/donut-pie-chart-race -
Observable
@observablehq
💫 Join us TOMORROW for our second session in our Data Science Workflows in JS Workshop series with @allison_horst!
We will cover remote file/API access, advanced data analysis, interactive charting with Plot Inputs & much more.
🎟️ Sign up here: observablehq.com/@observablehq/data-science-workflows-in-… -
Observable
@observablehq
💫Join us TOMORROW for our second session in our Data Science Workflows in JS Workshop series with @allison_horst!
👉Sign up here: observablehq.com/@observablehq/data-science-workflows-in-…
Allison Horst
@allison_horst
k-means clustering! 👾
(static versions + alt-text here: allisonhorst.com/k-means-clustering)
We'll be doing cluster analysis (k-means + hierarchical) in our upcoming Data science workflows in JavaScript workshop (Tuesday July 18, 9am - 11am PT!). Join here: observablehq.com/@observablehq/data-science-workflows-in-… -
Observable
@observablehq
📊🚀 #icymi: Now, you can use non-linear positional and color scales directly in Chart cell, eliminating the need for Observable Plot.
❗ Plus, our refreshed user interface highlights commonly used fields.
👉 Read more about it here: observablehq.com/blog/june-release-recap -
Observable
@observablehq
💫 Thank you for joining Session 1 of Data Science in JavaScript with @allison_horst
Upcoming sessions 7/18 and 7/25 will cover remote file/API access, advanced data analysis, interactive charting with Plot Inputs & much more.
🎟️ Sign up here: observablehq.com/@observablehq/data-science-workflows-in-… -
Observable
@observablehq
This is awesome! Welcome back! 👋
DEEPSHA MENGHANI
@bigdatadipper
I have been wanting to recreate this @observablehq animation and this week's #tidytuesday had to be the one with a visible trend in global surface temperatures.
Code: observablehq.com/d/36618b1ff74350a8
#dataviz #javascript #r4ds #rstats -
Observable
@observablehq
#icymi: Convert your Chart cell to Observable Plot code and take your charts to the next level.
📊🔀 Build a baseline chart effortlessly, then transform it into code for unlimited customization possibilities.
Read more about it here: observablehq.com/blog/june-release-recap -
Observable
@observablehq
#icymi: 📊 🔓 Take control of your file storage with private file storage. Store attachments in your own organization-managed S3 bucket for enhanced data security and compliance.
👉 Read more about it here: old.observablehq.com/blog/june-release-recap -
Observable
@observablehq
🚇Check out this visualization created by @pbbuffa. It illustrates the ridership levels of buses and subways in NYC, categorized by the day of the week.
Rebuild this chart by watching his 1 min tutorial using our chart cell, a no-code tool for creating stunning visualizations.
Paul Buffa
@pstuffa
The @observablehq chart cell is pretty sweet. You can build complex charts with just a few dropdowns, and eject to code when you want to fully customize. Here's how it works, and link to notebook observablehq.com/@pstuffa/ridership-trends-by-day-of-week
This media couldn't be displayed. See it on the original post. -
Observable
@observablehq
🌟📊 Easily create and iterate on exploratory visualizations with point-and-click menus. No programming experience needed! Add a chart cell to your notebook and see how it works.
➡️ observablehq.com/@observablehq/get-started-with-chart-cell -
Observable
@observablehq
💫🎓 @jonfroehlich, Associate Professor in Human-Computer Interaction at @UW, uses Observable to open his teaching environment, providing a collaborative and accessible learning experience for fourth-year undergrads.
➡️ Read more about it here: old.observablehq.com/blog/data-educators-froehlich -
Observable
@observablehq
💡 Interested in trying out Observable? Come join our Learn Observable Workshop with @pbbuffa TOMORROW.
🧐 This workshop aims to provides methods & tools that you will need to start working with your data in Observable.
Register here: observablehq.com/@observablehq/learn-observable-workshop-… -
Observable reposted
John Alexis Guerra Gómez @johnguerra.bsky.social
@duto_guerra
I updated my library for adding nearest point selection and smart labels to your @d3js_org #dataviz.
Added @recifs occlusion library and more.
Based on @mbostock voronoy-labels example It should be faster than force plugins.
@observablehq notebook
👉🏼 observablehq.com/@john-guerra/smart-labels 👈🏼 -
Observable
@observablehq
💫 Thank you for joining Session 1 of Data Science in JavaScript with @allison_horst
Upcoming sessions 7/18 and 7/25 will cover remote file/API access, advanced data analysis, interactive charting with Plot Inputs & much more.
🎟️ Sign up here: observablehq.com/@observablehq/data-science-workflows-in-… -
Observable
@observablehq
🧐 Did you manage to start an infinite loop and need to troubleshoot?
🔧 You can debug Observable notebooks in safe mode - a code-only view of your notebook where cells aren't executed.
👉 Learn more here: observablehq.com/@observablehq/safe-mode/safe -
Observable
@observablehq
💡 Interested in trying out Observable? Come join our Learn Observable Workshop with @pbbuffa.
🧐 This workshop aims to provides methods & tools that you will need to start working with your data in Observable.
Register here: observablehq.com/@observablehq/learn-observable-workshop-… -
Observable
@observablehq
🦀Join us tomorrow with @allison_horst!
🎟️Sign up here: observablehq.com/@observablehq/data-science-workflows-in-…
Allison Horst
@allison_horst
If you want an intro to data science workflows in JavaScript, Observable notebooks, building & sharing data viz with @ObservableHQ Plot, + some new features ✨ AND fiddler crabs, join tomorrow for Session 1 of our new workshop series!
Sign up, it's free! observablehq.com/@observablehq/data-science-workflows-in-… -
Observable
@observablehq
💫 📊 Coming up in July sign up and join our Data Science Workflows in JS with @allison_horst. Discover the power of data science tools in JavaScript. Beginners welcome!
👉 Sign up here: observablehq.com/@observablehq/data-science-workflows-in-… -
Observable
@observablehq
When your whole team can work with, explore, analyze and discuss data literally on the same page, you can all get from data to insights faster - together.
👉 observablehq.com/why-observable -
Observable
@observablehq
💡 Interested in trying out Observable? Come join our Learn Observable Workshop with @pbbuffa.
🧐 This workshop aims to provides methods & tools that you will need to start working with your data in Observable.
Register here: observablehq.com/@observablehq/learn-observable-workshop-… -
Observable reposted
Allison Horst
@allison_horst
⤵️ Imports in @observablehq make it quick & easy to reuse content across notebooks 🎉 Want to make your own bank of reusable elements for consistently themed data visualizations? See how to create "Custom theme elements for reuse in Observable Plot"!👇🎨 observablehq.com/@observablehq/custom-plot-themes
-
Observable
@observablehq
💫 📊 Coming up in July sign up and join our Data Science Workflows in JS with @allison_horst. Discover the power of data science tools in JavaScript. Beginners welcome!
👉 Sign up here: observablehq.com/@observablehq/data-science-workflows-in-… -
Observable
@observablehq
📊🚀 #icymi: Now, you can use non-linear positional and color scales directly in Chart cell, eliminating the need for Observable Plot.
❗ Plus, our refreshed user interface highlights commonly used fields.
👉 Read more about it here: observablehq.com/blog/june-release-recap -
Observable
@observablehq
We are back up and running! Thank you for your patience!
Observable
@observablehq
We are currently undergoing scheduled maintenance. You may experience temporary disruptions. Should take no longer than 15min. We apologize for any inconvenience appreciate your patience.
If you have any questions or concerns us at: support@observablehq.com. Thank you! -
Observable
@observablehq
We are currently undergoing scheduled maintenance. You may experience temporary disruptions. Should take no longer than 15min. We apologize for any inconvenience appreciate your patience.
If you have any questions or concerns us at: support@observablehq.com. Thank you! -
Observable
@observablehq
We will be undergoing scheduled maintenance today starting at 5pm PT. You may experience temporary disruptions. We apologize for any inconvenience caused and appreciate your patience.
If you have any questions or concerns us at: support@observablehq.com. Thank you! -
Observable
@observablehq
#icymi: Convert your Chart cell to Observable Plot code and take your charts to the next level.
📊🔀 Build a baseline chart effortlessly, then transform it into code for unlimited customization possibilities.
Read more about it here: observablehq.com/blog/june-release-recap -
Observable reposted
Syavash
@nobarany
Highly recommend Observable Plot vis library by @observablehq. The super nice api and having a strong team behind it convinced us to pick it over other options. It's been helping us build custom interactive charts quickly.
-
Observable
@observablehq
#icymi: 📊 🔓 Take control of your file storage with private file storage. Store attachments in your own organization-managed S3 bucket for enhanced data security and compliance.
👉 Read more about it here: old.observablehq.com/blog/june-release-recap -
Observable
@observablehq
💫 📊 Coming up in July sign up and join our Data Science Workflows in JS with @allison_horst. Discover the power of data science tools in JavaScript. Beginners welcome!
👉 Sign up here: observablehq.com/@observablehq/data-science-workflows-in-… -
Observable
@observablehq
🔆 The global temperatures right now have kept many of us curious. Take a look at this notebook by @slowkow of global temperature anomalies.
📈 observablehq.com/d/b39a0b47aa65cbb4 -
Observable reposted
Paul Buffa
@pstuffa
Like Strava? But maybe want to visualize your data a little differently? Here's how you can export your Strava data and get it running in an Observable notebook in just a min! I have a template that makes it super easy observablehq.com/@pstuffa/gpx-to-json-template
-
Observable
@observablehq
📢 New to Observable? Level up your data skills with our live workshop!
🚀 Learn the core methods and tools to work with data effectively, led by
@pbbuffa tomorrow!
Register here: observablehq.com/@observablehq/learn-observable-workshop-… -
Observable
@observablehq
💫 📊 Coming up in July sign up and join our Data Science Workflows in JS with @allison_horst. Discover the power of data science tools in JavaScript. Beginners welcome!
👉 Sign up here: observablehq.com/@observablehq/data-science-workflows-in-… -
Observable
@observablehq
Indeed, Plot is awesome.
👉 observablehq.com/plot/
You can call me Al 📈
@alastairotter
Decided to take the leap and rebuild some of the charts for our #gridwatch project using @observablehq Plot (they were in D3 already so a smallish leap). Was sceptical at first but after a few hours I'm sold. Plot is awesome and super simple once you get going.
-
Observable
@observablehq
🧐 Did you know that you can suggest changes to help other users improve their notebooks?
✏️ Just fork, make edits, then send along a suggestion - the owner will be alerted, an can review before choosing to merge in some or all of the changes.
👉 observablehq.com/@observablehq/fork-suggest-merge -
Observable
@observablehq
🙏We simplify data collaboration by getting everyone in one place for data analysis, sharing, and discussions.
👋Goodbye to endless back-and-forths and miscommunication during data iteration.
🤝Engage team members, stakeholders, and managers easily for inclusive insights. -
Observable reposted
Tanya Shapiro
@tanya_shapiro
Hold up. Didn't notice Observable's "Suggestions" feature until today (I had one pending).
@duto_guerra made some mind-blowing edits to to my Drag Race 'Netwerk' notebook. Merged them in, wow - John this is brilliant, you are a wizard! 🪄
Check it out:
observablehq.com/d/f3941ff4743f26e3 -
Observable
@observablehq
✨Join us tomorrow for a plot pop-up with @allison_horst!
Allison Horst
@allison_horst
If you've been interested in learning Observable Plot & want to start with a gentle hands-on intro, join me Friday to make an interactive graph of Mono Lake levels together!
Learn some Plot essentials, tooltips, +tips & tricks for customization. Sign-up: observablehq.com/@observablehq/popup-learning-mono-lake-plot -
Observable
@observablehq
🐿️ 🏞️ There are many a squirrel that run amok in Central Park, in this notebook by @Deepalikank they map out and explore the fur diversity of the little beings.
observablehq.com/d/7ee2d890cfe313e2 -
Observable
@observablehq
💡Automated version history keeps track of edits made in our notebooks so that you and your team can edit fearlessly, knowing you can always go back to a previous version.
👉observablehq.com/@observablehq/history -
Observable
@observablehq
📢 New to Observable? Level up your data skills with our live workshop!
🚀 Learn the core methods and tools to work with data effectively, led by @pbbuffa on June 23rd
Register here: observablehq.com/@observablehq/learn-observable-workshop-… -
Observable
@observablehq
📊 🌊 Join @allison_horst for a casual learning session and build an interactive chart of Mono Lake levels with Plot. No previous experience needed.
👋 See you there! observablehq.com/@observablehq/popup-learning-mono-lake-plot -
Observable
@observablehq
💫We love having @pbbuffa part of our team! Take a look at his content below!📊
Paul Buffa
@pstuffa
I've been working with Observable for (whoa!) five years now, and it's hard to working without it. Here's an example of how easily I can build a simple data app in *literally* two min. Enjoy!
This media couldn't be displayed. See it on the original post. -
Observable
@observablehq
A nice example of ad hoc international collaboration — @EliotJacobson charted global temperature anomalies with data from climatereanalyzer.org, @slowkow made it a live-updating notebook with Plot, @angiehjort jumped in to add a color scale: observablehq.com/d/b39a0b47aa65cbb4
-
Observable
@observablehq
❔Sometimes it's hard to see how things are connected, but that shouldn't be the case with your notebook content.
🗺️The minimap gives you a condensed view of cells and how they depend on each other & lets you quickly navigate through & reorder content. observablehq.com/@observablehq/minimap -
Observable
@observablehq
🎓 We caught up with @BerkeleyData teachers Andy Reagan and Mak Ahmad to learn how they’ve used Observable to teach graduate level #dataviz to more than 600 students since 2020.
📖 Check it out here: old.observablehq.com/blog/data-educators-reagan-ahmad -
Observable
@observablehq
🔎 📊 Explore Advanced Data Visualization: Techniques, Interaction, and Data Patterns with @eagereyes starting June 13th.
🗓️ Don't miss this opportunity! Register today: observablehq.com/@observablehq/advanced-data-visualizatio…This media couldn't be displayed. See it on the original post. -
Observable
@observablehq
🙏 Did you find yourself wishing for tooltips in Observable Plot? The wait is over!
🛠️ 💡 Tooltips were recently added, with options for interactive crosshairs, pointer actions, and text annotation.
Learn more: github.com/observablehq/plot/blob/main/CHANGELOG.md -
Observable
@observablehq
All we have to decide is what to do with the time that is given to us" ... then make a Gantt chart of it. 😏
Allison Horst
@allison_horst
Explore, tinker with, and customize your own custom interactive Gantt charts to visualize project timelines with @observablehq Plot!
...or, you know...use it to make Lord of the Rings timelines 🧙♂️🧝♀️🌋
observablehq.com/@observablehq/build-your-own-gantt-chart -
Observable
@observablehq
🦹 😎 Don't want everyone to see what happens behind the scenes while you're making edits to a public notebook?
💡 You can pause live edits while working in Observable to make changes without viewers seeing them in real time: observablehq.com/@observablehq/pause-live-edits-in-public… -
Observable
@observablehq
In this notebook, @recifs steps through how to make a contour map of live air quality data from @airnow using Plot. The air in the northeast is, as you may have heard, bad. observablehq.com/@fil/dyi-live-map-of-air-quality-in-the-us
Observable
@observablehq
Map code is pretty short: contour observablehq.com/plot/marks/contour + geo observablehq.com/plot/marks/geo + dot. “PM2.5” is micrograms per cubic meter of particles smaller than 2.5 microns, i.e. level of fine particles in the air. Trickiest part is “render” transforms clipping the contours to U.S.
-
Observable
@observablehq
💡Make modifying or generating data in the Data Table cell a breeze.
📊Simplify your workflow and achieve better insights with ease.
👉 observablehq.com/blog/may-release-recap -
Observable
@observablehq
We’re happy to be around too. 🙌
Michael Hladky
@Michael_Hladky
What @observablehq does is outstanding and unique!
I’m happy they are around! -
Observable reposted
Tanya Shapiro
@tanya_shapiro
This tweet got me in my feels about Lasso. Decided to recreate one of my more recent ggplots about EPL rankings with Observable Plot.
So many things to try with Plot! Can't wait to test an interactive version with pointer events in the future 😊
Code: observablehq.com/d/aa2ed4c606d995c0
Observable
@observablehq
📊Happy Monday, everyone!
New data, new notebook - what will you be creating? -
Observable
@observablehq
💡 With our new Audit Log feature, keeping tabs on key events in your workspace just got easier.
📊 🧠 Download a CSV or JSON file with 180 days of activity, including notebook creation. Stay in control and never miss a beat!
👉 #icymi: old.observablehq.com/blog/may-release-recap -
Observable
@observablehq
📊Happy Monday, everyone!
New data, new notebook - what will you be creating? -
Observable
@observablehq
🎟️💫 Sign up for free and join us starting June 13th!
-
Observable
@observablehq
📢 Our next course is here! Advanced Data Visualization: Techniques, Interaction, and Data Patterns led @eagereyes! Join us starting June 13th at 9 AM PT/12 PM ET.
Register now and dive into the world of captivating visualizations: observablehq.com/@observablehq/advanced-data-visualizatio… -
Observable
@observablehq
📢 Our next course is here! Advanced Data Visualization: Techniques, Interaction, and Data Patterns led @eagereyes! Join us starting June 13th at 9 AM PT/12 PM ET.
Register now and dive into the world of captivating visualizations: observablehq.com/@observablehq/advanced-data-visualizatio… -
Observable
@observablehq
💡Where does inspiration strike? For our @allison_horst, it's from @TedLasso!
⚽️Lasso's endless curiosity and fun-loving nature are not just entertaining, but a blueprint for navigating the field of data.
🎬Discover more in our latest segment of 'Being at Observable'This media couldn't be displayed. See it on the original post.
Observable
@observablehq
Who strikes inspiration for you?
-
Observable
@observablehq
We’re excited to see what you create!
Tanya Shapiro
@tanya_shapiro
I was longing for better map labels. I blink, and the @observablehq team already delivers a solution. ⚡️⚡️⚡️
Excited to try this out! -
Observable
@observablehq
⭕ Circles, but not as you know them. Take a look at this notebook of transmogrifying circles by @Saneef while using D3. A visual treat!
👉 observablehq.com/@saneef/063-transmogrifying-circles -
Observable
@observablehq
👀 Take a look at this! What a thread!!
Mike Bostock
@mbostock
Observable Plot 0.6.7 is here 🎉, and with it, our first foray into interactive visualization! I’m so proud of the subtle details that make it shine. What makes it so great? 🧵 github.com/observablehq/plot/blob/main/CHANGELOG.md
-
Observable
@observablehq
⏰ Just a quick reminder! The start date for the Introduction to SQL Course, led by @pbbuffa, is just around the corner—May 30th.
Make sure you're ready to dive into the world of SQL!
👉 Sign up now: observablehq.com/@observablehq/intro-to-sql-course -
Observable
@observablehq
🎙️We continue with our 'Being at Observable' series, where we peel back the curtain to spotlight the individuals that shape our extraordinary team.
💫 Meet Data Science Advocate: @allison_horst as she shares her journey and the vital role of our data community & collaboration.This media couldn't be displayed. See it on the original post. -
Observable
@observablehq
😍 Check out why folks are loving observablehq.com/plot/!
Robin Hawkes
@robhawkes
Absolutely loving @observablehq Plot library 😍
Not only has it made the renewables charts way prettier, but it's also allowed me to make things much more sophisticated and robust – it's basically (well, it is!) D3 but much easier to use.
Using the the upcoming tooltips too ✨ -
Observable reposted
Radamés Ajna
@radamar
Exciting tool for #javascript devs from @Gradio. The new gradio/client lets you use any Gradio app as an API, providing an easier way to build custom front-end components. Check out this interactive tutorial on @observablehq
observablehq.com/@huggingface/hello-gradio-client-js -
Observable
@observablehq
📣 Update!
❗ The start date for our Introduction to SQL Course has been adjusted to May 30th. We're sorry for any inconvience this may cause and appreciate your flexibility. @pbbuffa is looking forward to diving into the world of SQL with you!
👉 observablehq.com/@observablehq/intro-to-sql-course -
Observable
@observablehq
🤔Did you know you can make temporary modifications to your notebook without changing the original?
With Tinker mode, changes to the notebook are not auto-saved so you can try out a quick modification or idea without having to fork the notebook.🛠️ -
Observable reposted
Mike Bostock
@mbostock
New video walkthrough: creating an index chart in Observable Plot to compare regional bank stock performance! youtube.com/watch?v=bn51eueIrjM
-
Observable
@observablehq
💡 Drawing inspiration from @mbostock, delve into this notebook by @tanya_shapiro exploring shot charts by @NBA player.
🏀 Check it out here: observablehq.com/d/fb34e1f49de9c53f -
Observable
@observablehq
💡 When @tannerlinsley needed a JavaScript library for building visualizations of various data models in his enterprise SEO monitoring software, his tool of choice was Observable Plot.
👉 Read about it here: observablehq.com/blog/linsley-observable-plot
@nozzleio -
Observable
@observablehq
🧠 Don't miss out on the opportunity to learn the fundamentals of #sql! Join our FREE Intro to SQL course led by our Head or Product Education: @pbbuffa and gain the skills you need!
🎟️ Sign up here: observablehq.com/@observablehq/intro-to-sql-course -
Observable reposted
Tanya Shapiro
@tanya_shapiro
quick #tidytuesday. learned some stuff about tornadoes, and learned some stuff with Observable 🌪️
working on more legible map labels...
observablehq.com/d/da399ee0cfd7c2f9 -
Observable
@observablehq
💻 Our monthly 'Learn Observable Workshop' is here!
🤔 Ideal for new users and anyone intrigued by using our platform. Experience the power of data visualization led by @pbbuffa
🎟️ Sign up here to join us this Thursday at 9am PT/12pm ET: observablehq.com/@observablehq/learn-observable-workshop-… -
Observable
@observablehq
🧐 Who do you think are the most popular women in history? Check out the notebook below by @DeepaliKank and find out!
👉 observablehq.com/d/3fabe06f08acc005 -
Observable
@observablehq
📺 The Simpsons has been on the air for over 30 years, and its ratings have fluctuated over time. This notebook shows how the show's ratings have changed since it premiered in 1989.
📈 Check it out here: observablehq.com/@observablehq/plot-simpsons-ratings -
Observable
@observablehq
Check out @chrispahm's notebook here: observablehq.com/@chrispahm/influence-of-soil-quality-and…
#qotd -
Observable
@observablehq
🧠 Don't miss out on the opportunity to learn the fundamentals of #sql! Join our FREE Intro to SQL course led by our Head or Product Education: @pbbuffa and gain the skills you need!
🎟️ Sign up here: observablehq.com/@observablehq/intro-to-sql-course -
Observable
@observablehq
🏫 Learn high-level instructions, core methods & tools that you will need to start working with your data with our FREE 'Learn to Observable' workshop with @pbbuffa on Thursday, May 18th at 9 AM PT / 12 PM ET
Register below: observablehq.com/@observablehq/learn-observable-workshop-… -
Observable
@observablehq
🎥 Curious about @Criterion's top 10 picks? Check out this notebook and see the aggregated data on top selections, countries, and film durations...a new perspective on your favorite films! 📈🎬
👉 observablehq.com/@sepans/criterion -
Observable
@observablehq
Some users may experience issues using Twitter authorization to log into their Observable accounts due to changes in our Twitter API access. All other authorization methods are working as expected.
Please contact support@observablehq.com if you experience issues. -
Observable
@observablehq
🚀 Ready to level up your data skills? Join our FREE Introduction to SQL course, led by @pbbuffa. Master the basics, explore advanced topics and so much more. Perfect for data enthusiasts at any level.
👉 Sign up here: observablehq.com/@observablehq/intro-to-sql-course -
Observable reposted
John Alexis Guerra Gómez @johnguerra.bsky.social
@duto_guerra
Is your #dataviz overcrowded with labels?
💡 I made a reusable smart labels component based on the example of voronoi labels by @mbostock
Easy to use with your @d3js_org chart or directly in @observablehq
You also get nearest point selection
observablehq.com/@john-guerra/smart-labels -
Observable
@observablehq
💫 Here are the winners of the Student Data Jam! Congratulations to 1st - Data Dynamically from UNCA (@newsUNCA), 2nd - Byte Buddies from UW (@UW), and 3rd - Elina & Adrien from Université Paris Cité (@univ_paris_cite).
🏆 The winning notebook: observablehq.com/d/5a5a00449cc5ffc4 -
Observable
@observablehq
🎼 Explore the intricate web of relationships between notes and chords in this interactive music theory playground.
👉 observablehq.com/@esperanc/tonnetz-applications -
Observable reposted
Mike Bostock
@mbostock
Here’s a little walkthrough of how I visualized bank failures: www.youtube.com/watch?v=AhdfQhi0zNU
-
Observable reposted
Mike Bostock
@mbostock
Who’s ready for Observable Plot tooltips? 😎
-
Observable
@observablehq
It's a celebration! 🎉 Observable Plot turns two today, and we couldn't be more proud of its impact on the data community.
🥳Here's to more intuitive, interactive, and informative visualizations in the years to come! 🚀
observablehq.com/plot/ -
Observable
@observablehq
🧠 Don't miss out on the opportunity to learn the fundamentals of SQL! Join the Intro to SQL course led by our very own @pbbuffa and gain the skills you need! Sign up now and start your learning journey!
🎟️ Reserve your FREE spot here: observablehq.com/@observablehq/intro-to-sql-course -
Observable
@observablehq
📣 You can share private notebooks with secure, private embeds.
🕵️ We made it easy for you to embed notebooks and it supports a variety of embed types, including iFrame, JavaScript, and React!
Read more about it here: observablehq.com/blog/april-release-recap -
Observable
@observablehq
🧐 We noticed search was slowing our users down, we knew we had to address it.
💫 Now, search returns more accurate results faster. Not just a little faster. 10x faster.
Learn more here: observablehq.com/blog/april-release-recap -
Observable
@observablehq
👋 Say goodbye to manual sharing and hello to seamless collaboration. With Groups for our Enterprise workspaces, sharing notebooks with your project team or department has never been easier. Head to your workspace settings now!
👉 observablehq.com/blog/april-release-recap -
Observable
@observablehq
What an amazing collection!
DEEPSHA MENGHANI
@bigdatadipper
My entire @observablehq collection of #30daychartchallenge. I learned a ton and met so many amazing data viz artists here.
Code: observablehq.com/collection/@deepsha/30-day-chart-challenge
Thx to @CedScherer, @dr_xeo, @ShijiaWendy,
@shinysci and all who participated enabling my learning and growth! ❤️ -
Observable
@observablehq
Tip: You may know you can hide a cell’s code with the 📌 pin icon or cmd-period. You can now also hide the output (e.g. if it’s long or redundant) with the 👁 eye icon or cmd-comma.
-
Observable
@observablehq
🧠 Don't miss out on the opportunity to learn the fundamentals of SQL! Join the Intro to SQL course led by our very own @pbbuffa and gain the skills you need! Sign up now and start your learning journey!
🎟️ Reserve your FREE spot here: observablehq.com/@observablehq/intro-to-sql-course -
Observable
@observablehq
💫 Independent data consultant @tanya_shapiro transitioned from R to JavaScript for more interactive data visualization.
💡 Learn about her journey into the JS world from the online R community: observablehq.com/blog/r-to-javascript-shapiro -
Observable
@observablehq
🌸 The blossoms bloom! @harrislapiroff was inspired to use Plot to create this gorgeous notebook, using a 50-year rolling average to plot a line.
1200 years of blossoms: observablehq.com/@harrislapiroff/1200-years-of-cherry-blo… -
Observable
@observablehq
🎸It's the final countdown!
⏰In just two hours join us for our last session with @allison_horst leading the Intro to data wrangling and analysis in JavaScript course!
👉 You can still join us!
www.eventbrite.com/e/course-introduction-to-data-wranglin… -
Observable reposted
mmurph
@mmurph
Some much opportunity and need in dataviz! load your data and it automagically puts you into the most relevant visualizations. simplicity and onboarding is the key to so many products and this is a huge leap. from the team behind @d3js_org nice work @observablehq!
Mike Bostock
@mbostock
Our new website for Observable Plot is live! 🎉 Dozens of new guides, hundreds of examples, instant search, dark mode… Hope you love it! observablehq.com/plot/
-
Observable
@observablehq
📈 People love Observable Plot for its code snippets that enable them to work much faster.
💻 Our JavaScript library for exploratory data viz is powerful and expressive, all while letting you create meaningful viz with as little as one line of code.
observablehq.com/@observablehq/plot -
Observable reposted
Tanner Linsley
@tannerlinsley
@observablehq will change your life (if your life is datavis). Try it. Use it. Fight! Win!
Mike Bostock
@mbostock
Our new website for Observable Plot is live! 🎉 Dozens of new guides, hundreds of examples, instant search, dark mode… Hope you love it! observablehq.com/plot/
-
Observable reposted
Mike Bostock
@mbostock
Our new website for Observable Plot is live! 🎉 Dozens of new guides, hundreds of examples, instant search, dark mode… Hope you love it! observablehq.com/plot/
-
Observable
@observablehq
IT'S TRUE! We are live: observablehq.com/plot/
-
Observable
@observablehq
⏰In just under 2 hours we continue our sessions with our data science advocate superstar @allison_horst
📷Check out the agenda to see what she'll cover today and register now!
www.eventbrite.com/e/course-introduction-to-data-wranglin… -
Observable
@observablehq
📈 In Sessions 1 & 2, we explored JavaScript essentials and made charts using Observable Plot.
💫 Join us on tomorrow April 26 and April 27th (12pm - 1 pm PT)) for Sessions 3 & 4 as we advance our skills in visual data analysis.
observablehq.com/@observablehq/introdwjavascript -
Observable reposted
Roman Sverdan
@RomanSverdan
#day23 of the #30daychartchallenge and #tilegam of the highest points of each Ukrainian region.
Check out details at my @observablehq notebook: observablehq.com/@romansverdan/30daychartchallenge-day-23
@30DayChartChall #dataviz #ukraine #tilemap #d3js -
Observable
@observablehq
👉 Check out Ian's notebook here: observablehq.com/@ijlyttle/cvd-widget
#qotd -
Observable
@observablehq
🎓 Students in @allison_horst free "Intro to data wrangling and analysis in JavaScript" class are loving it so far!
💫 It's not too late to sign up for the live class; and if you'd like - catch up on YouTube: observablehq.com/@observablehq/introdwjavascript -
Observable
@observablehq
🧇 📊 See how your life's adventures can be visualized in a waffle chart. Thanks to @allison_horst's notebook template, you can input your own data and get a customized result.
Fork and explore here: observablehq.com/resources/templates/life-in-waffle -
Observable reposted
John Alexis Guerra Gómez @johnguerra.bsky.social
@duto_guerra
Here is a WIP #dataviz project I have been working on: @Northeastern University @KhouryCollege Faculty by their Affiliations, Campus, etc.
Lots of tricks there on @d3js_org network visualization for @observablehq
observablehq.com/@john-guerra/khoury-faculty -
Observable
@observablehq
⏰In just an hour we'll launch the second of four hour-long sessions with data science advocate superstar
@allison_horst
🧑💻Check out the agenda to see what she'll cover and register now eventbrite.com/e/course-introduction-to-data-wrangling-an…
🎟️It's free! -
Observable
@observablehq
-
Observable
@observablehq
-
Observable
@observablehq
🧐 Getting to know your data visually is essential. But are there ways to improve and expedite that first step of data exploration?
💡 We show you how interactive data visualization can help - for faster exploratory data analysis.
observablehq.com/resources/data-exploration -
Observable
@observablehq
In just under 2 hours we'll launch the first of four hour-long sessions with data science advocate superstar @allison_horst
Check out the agenda to see what she'll cover and register now www.eventbrite.com/e/course-introduction-to-data-wranglin….
It's free! -
Observable
@observablehq
🧐 When it comes to your data work, what are the most useful #javascript libraries to have in your toolbox?
🧠 📈 We ranked JS libraries specifically for data analysis, data #visualization, and data science, because we wondered the same thing.
observablehq.com/resources/javascript-libraries -
Observable
@observablehq
🌸 Discover the beauty of Idaho Lilacs through an incredible interactive data visualization by @allison_horst !
🎨 Explore the stunning lilac blooms and learn about their fascinating history in Idaho.
observablehq.com/@allisonhorst/idaho-lilacs -
Observable
@observablehq
📣 Data Jam is LIVE!
The Data Jam is self-paced over the next 10 days, and you can enter - and grow your team - until the submission deadline.
👉 Register to stay up-to-date and it ain’t over until YOU submit the winning notebook!
observablehq.com/@educators-network/data-jam-sp23 -
Observable
@observablehq
🧐 Ever wondered what exactly data modeling is? In our latest article that answers that very question, we look at a real-world example of data modeling: building a data pipeline.
📖 Read about it here: observablehq.com/resources/data-modeling -
Observable
@observablehq
✨ @Periscopic a socially-conscious #dataviz firm, harnesses the power of our platform to create visuals that drive change! 🌍
💡 Read their story: observablehq.com/customer-stories/periscopic -
Observable
@observablehq
Join @allison_horst this Wednesday!
🛠️Learn some basic JavaScript for data wrangling & analysis
📒Get started working on our platform
📈Build interactive charts w/ Observable Plot
✨ Register for our free intro course! 4x 1-hr sessions: observablehq.com/@observablehq/introdwjavascript -
Observable
@observablehq
-
Observable
@observablehq
Some users may experience issues using Twitter authorization to log into their Observable accounts due to changes in our Twitter API access. All other authorization methods are working as expected. Please contact support@observablehq.com if you experience issues.
-
Observable
@observablehq
🍎📈 Professor of Mathematics, at @UncAvl Marc McClure recently chatted with our very own @cfrancisrun.
Learn how Marc teaches mathematics to students with different backgrounds and levels of experience. 🔍📚
💡 Get inspired: old.observablehq.com/blog/data-educators-mcclure -
Observable
@observablehq
🕵️♀️💻 @tanya_shapiro , a combo of data geek & biz detective, is an independent consultant maximizing business data!
A #dc & #marvel fan, they crafted a rad Superheroes vs Villains using Plot 💥🦸♀️🦹♂️
Take a look here: observablehq.com/d/ba341f8bcace342e -
Observable
@observablehq
📣 Data Jam is LIVE!
We’ve launched the contest dataset - but you haven’t missed your chance to compete. The Data Jam is self-paced over the next 10 days, enter - and grow your team - until deadline.
❗ It ain’t over until YOU submit your notebook!
observablehq.com/@educators-network/data-jam-sp23 -
Observable
@observablehq
💡 Check out this handy notebook to quickly see several common data-wrangling functions, done in JavaScript, Python, SQL, R, and Excel.
🔖 One to bookmark! Created by our very own @allison_horst and @pbbuffa
observablehq.com/resources/cheatsheets/data-wrangling-com…
observablehq.com/resources/cheatsheets/data-wrangling-com… -
Observable
@observablehq
Find yourself repeatedly Googling how to make custom color schemes, update fonts, or add images & logos to your Observable Plot charts?
Learn how to make your own source of reusable palettes and styles, for quick import & reuse in other notebooks! 🎨
observablehq.com/@observablehq/custom-plot-themes -
Observable reposted
Roman Sverdan
@RomanSverdan
How many of the Pop Art artists do you know? How many of them are still alive?
Check it out at my #day13 of #30daychartchallenge @observablehq notebook here: observablehq.com/@romansverdan/30daychartchallenge-day-13
Data source: @Wikipedia
@30DayChartChall, #dataviz #data #d3js -
Observable
@observablehq
📆 Set your reminder! 'Learn Observable' FREE workshop featuring @pbbuffa is this week April 14th at 9 AM PT / 12 PM ET. Elevate your skills with expert instruction! 🌟
Register here: observablehq.com/@observablehq/learn-observable-course-ap… -
Observable
@observablehq
🌟 Unleash your data potential! Join our FREE intro course on basic JavaScript and interactive charts. 4x 1-hr sessions kick off on April 19th hosted by @allison_horst
🎟️ Secure your spot: observablehq.com/@observablehq/introdwjavascript -
Observable
@observablehq
“Fast ship? You've never heard of the Millennium Falcon?” 🚀
⚡️ As fellow fans of the @starwars franchise, we are thrilled to share an incredible project by our very own @VPoltrack with the help of @allison_horst
🔍 Check it below: observablehq.com/@virginiapoltrack/starwars -
Observable
@observablehq
We admire the flex 🦾
Tanya Shapiro
@tanya_shapiro
Flexing @observablehq's super powers with Observable Plot 🦹♀️
Working with an old dataset I wrangled on superheroes and villains.
PS. Mike Freeman's tooltip notebook is 👌
observablehq.com/d/ba341f8bcace342e -
Observable
@observablehq
📣 Data Jam is LIVE! ✨ Join the self-paced, 10-day contest anytime. Team up & compete till the deadline.
Register for updates & reminders! Submit your winning notebook 🏆
observablehq.com/@educators-network/data-jam-sp23 -
Observable reposted
DEEPSHA MENGHANI
@bigdatadipper
#day9 #30daychartchallenge Was there a famous movie that made everyone want a French Bulldog and raise its ranking? Or is it just plain adorableness!
Wanna guess their ranking today!
@observablehq code: observablehq.com/d/a753c8b02eb7185b
Source: #tidytuesday
#dataviz @30DayChartChall -
Observable
@observablehq
We are back online! Our scheduled platform maintenance is now complete and all features are operating at expected.
Having issues or concerns?
Reach out at support@observablehq.com -
Observable
@observablehq
Reminder: our scheduled platform maintenance window begins now. For the next hour, you may be unable to access our platform.
-
Observable
@observablehq
-
Observable
@observablehq
Try us out! Come join our 'Learn Observable' workshop with our very own Paul Buffa @pbbuffa on April 14th at 9 AM PT / 12 PM ET. This workshop aims to provide high-level instruction to the core methods and tools that you will need to start with us!
observablehq.com/@observablehq/learn-observable-course-ap… -
Observable reposted
courtney
@cfrancisrun
Students - join us starting NEXT WEEK (!!!) in a self-paced opportunity to explore data and get started quickly with Observable!
Observable
@observablehq
🎓 Sign ups are OPEN for our upcoming Student Data Jam!
From April 10th - 20th, Observable invites student teams to explore data sets related to higher education for new insights, and it's FREE.
👉 observablehq.com/@educators-network/data-jam-sp23
#hackathon #datajam #university #edu #js #dataviz -
Observable
@observablehq
🔶 Dive into the world of aperiodic monotiles with this interactive viz! Explore & manipulate single tiles that create non-repeating patterns for a unique geometric experience.
observablehq.com/@rreusser/aperiodic-monotile -
Observable reposted
DEEPSHA MENGHANI
@bigdatadipper
#day5 #30daychartchallenge Learned an interesting factoid about zoo animal lifespans while building this out.
@observablehq code: observablehq.com/d/1e34c291885decce
Ps: For getting comfy with observable and js highly recommend @allison_horst's upcoming course!
#dataviz @30DayChartChall -
Observable
@observablehq
Scheduled maintenance alert! 🚨 On April 6, 2023 at 5 PM PDT, we will be conducting scheduled maintenance on our platform. At that time, you may be unable to access our platform for up to 1 hour.
Any concerns? Reach out at support@observablehq.com -
Observable
@observablehq
📣 Register for this FREE intro course led by our very own @allison_horst and learn some basic JS for data wrangling and analysis!
Allison Horst
@allison_horst
Hi all! If you want to...
🛠️Learn some basic JavaScript for data wrangling & analysis
📒Get started working in @observablehq
📈Build interactive charts w/ Observable Plot
✨ Register for our free intro course! 4x 1-hr sessions starting Apr 19 observablehq.com/@observablehq/introdwjavascript -
Observable
@observablehq
🎓 Sign ups are OPEN for our upcoming Student Data Jam!
From April 10th - 20th, Observable invites student teams to explore data sets related to higher education for new insights, and it's FREE.
👉 observablehq.com/@educators-network/data-jam-sp23
#hackathon #datajam #university #edu #js #dataviz -
Observable
@observablehq
🏗️ Ever wondered about those sidewalk sheds you see in NYC? Check out this interactive visualization by @zhi_keng to learn more about their impact on the city's landscape.
Explore the data now:
observablehq.com/@betanyc/what-are-sidewalk-sheds?collect… -
Observable reposted
DEEPSHA MENGHANI
@bigdatadipper
#day3 #30daychartchallenge Threatened species as % of known species and the countries where that ratio is highest. Getting more comfortable with @observablehq plot library, annotations still a bit hard though.
Notebook: observablehq.com/d/1e34c291885decce
#dataviz @30DayChartChall -
Observable
@observablehq
🚀Level up your JavaScript skills with this upcoming course led by our very own @allison_horst!
💡Ideal for newbies and seasoned folks alike!
Register for FREE by clicking the link below!
observablehq.com/@observablehq/introdwjavascript -
Observable
@observablehq
🌟 'The Morpheus Project' - shining a light on tech industry's progress in creating diverse workforces.
🗣️ Our very own AJ Angus, shares his journey with us in our new series 'Being at Observable'.
Stay tuned for more insightful stories from our team members.This media couldn't be displayed. See it on the original post.
Observable
@observablehq
Check out AJ's Morpheus Project here: observablehq.com/@a38c239118314682/the-morpheus-project
-
Observable
@observablehq
🤔 Are you a new(ish) to Observable? Our course "Learning Observable" gives an intuitive intro to all knowledge levels.
Check it out here: observablehq.com/@observablehq/learning-observable-introd… -
Observable reposted
Tanya Shapiro
@tanya_shapiro
Did a D3 thing today with @observablehq. It doesn't look like much, but since I'm a newbie, I'd call this a win!
Big thanks to Mike Bostock and his amazing notebooks. Took his BeeSwarm function and made some edits to use it with cropped images. 🤩
Code: observablehq.com/d/dbe21ae287cc2523 -
Observable reposted
John Alexis Guerra Gómez @johnguerra.bsky.social
@duto_guerra
My @NortheasternCA challenged me in class to make this @d3js dendogram animated, I couldn't make it during there, but here it is 👉🏼 observablehq.com/d/0dbb0adc3207a2ea
Original @observablehq submission by my student @neu7295 (x.com/neu7295/status/1639882033077055490)
#dataviz
#dataviz
Jiangyan Li
@neu7295
Do you know that the majority of games with a rating of 3.5 or higher are developed by at least two companies. And among all the game companies, Nintendo has developed the most popular games. Find more here:
observablehq.com/d/9f34b6e0d07c0589
#dataviz
@observablehq
@NortheasternCA -
Observable
@observablehq
🤯 Discover the power of Autoplot Matrix by our very own @recifs! Visualize your dataset in a stunning matrix of plots.
⬇️
observablehq.com/@observablehq/autoplot-matrix?collection… -
Observable
@observablehq
📣 Check it out: something new in our data wrangling notebook by @allison_horst!
Allison Horst
@allison_horst
📯Our choose-your-own data wrangling comparisons notebook has a sibling on descriptive statistics!
Show or hide comparisons for some common descriptive stats (mean, sd, counts, etc.) in JS, Python, SQL, R & Excel.
Visit the @observablehq notebook: observablehq.com/@observablehq/descriptive-statistics-tra… -
Observable
@observablehq
By our very own @allison_horst a very epic notebook indeed!
-
Observable
@observablehq
Did you know that you can use Safe Mode to debug a notebook that isn't running properly?
Safe Mode is a code-only view of your notebook, in which no cells are executed. -
Observable
@observablehq
📣 New feature! Chart cell. It simplifies the workflow and allows you to visually explore your data without any coding required. Accelerate your time to insights and try it out today!
👉 observablehq.com/@observablehq/chart-cell?collection=@obs… -
Observable
@observablehq
Sign ups are OPEN for our upcoming Student Data Jam!
From April 10th - 20th, Observable invites student teams to explore data sets related to higher education for new insights, and it's FREE.
👉 observablehq.com/@educators-network/data-jam-sp23 -
Observable
@observablehq
Beautiful notebook by @harrislapiroff using Plot showing full flowering in Kyoto City over the past 1,200 years 🌸
Harris Lapiroff
@harrislapiroff
Beautiful! I recreated this for web using @observablehq Plot:
observablehq.com/@harrislapiroff/1200-years-of-cherry-blo… -
Observable
@observablehq
📰 New this week! We've made collaborating with people outside your organization easier than ever.
👤 Our new guest roles let you add members to your workspace while restricting their access to specified notebooks, secrets, and databases.
👉 observablehq.com/@observablehq/release-notes -
Observable
@observablehq
🍕 Feast your eyes on Pizza Paradise data by our very own Paul Buffa.
Pizza Paradise is a fake dataset on a pizzeria franchise. Our team generated it for demo purposes and works well for various visualization forms.
observablehq.com/@observablehq/pizza-paradise-data -
Observable reposted
Paul Buffa
@pstuffa
Need data? Want it pizza themed? We got you. Introducing Pizza Paradise - a fake dataset with real trends. We wanted a good demo dataset that would work well for a variety of visualization forms, so we built one ourself. About pizza 🍕🍕🍕 Enjoy!
observablehq.com/@observablehq/pizza-paradise-data -
Observable
@observablehq
Thanks, Tanner! We think we’re pretty dope too. ✌️
Tanner Linsley
@tannerlinsley
@observablehq Plot is 🤯😍🚀.
As soon as tooltips, cursors and brushing/zooming are merged, I'm done with all other datavis libraries, including my own @tan_stack React Charts library.
IT'S PURE 🥇
Also, @observablehq is dope.
observablehq.com/@observablehq/plot -
Observable
@observablehq
🎨 Explore the beautiful world of Fibonacci Lattices by @meetamit and see how they form.
observablehq.com/@meetamit/fibonacci-lattices -
Observable
@observablehq
Sign ups are OPEN for our upcoming Student Data Jam!
From April 10th - 20th, Observable invites student teams to explore data sets related to higher education for new insights, and it's FREE.
👉 observablehq.com/@educators-network/data-jam-sp23 -
Observable reposted
Christoph Pahmeyer
@chrispahm
Using @observablehq helps me prototype and visualize research ideas right from the start. I can draft an analysis, create a link to share, and invite co-authors to quickly iterate on the research idea and method: observablehq.com/@chrispahm/influence-of-soil-quality-and…
-
Observable
@observablehq
📊 No need to start from scratch with Observable! Dive into our thriving #dataviz community, discover amazing work, and follow inspiring notebooks.
Get ready to level up your visualization game! 🔍✨
👉 old.observablehq.com/blog/following-tagging -
Observable
@observablehq
📊 Check out this notebook by @allison_horst where you can customize and download waffle charts of your life!
Allison Horst
@allison_horst
Data viz, art, love stories and heartbreak all in these little waffle charts of our lives (based on where we were in the world each month).
Want to make your own? Update this @observablehq notebook with your own data, and customize it to show your story💚 observablehq.com/@observablehq/life-in-waffle -
Observable
@observablehq
🔮 Transform spatial data into beautiful and informative data visualizations with Observable Plot’s raster mark. See how easy it is to create stunning plots.
observablehq.com/@observablehq/plot-raster -
Observable
@observablehq
🧠 Join us tomorrow for the LAST live session of our Data Visualization Fundamentals and Best Practices course led by Data Visualization Developer by @eagereyes
Sign up here: observablehq.com/@observablehq/datavizcourse -
Observable
@observablehq
🎓 Want to empower the next generation with data literacy skills? Learn from the expertise of data educator Philip Bogden, PhD, Associate Computer Science Professor at @Northeastern in this interview by @cfrancisrun.
👉 Have a read here: old.observablehq.com/blog/data-educators-bogden -
Observable
@observablehq
🎓 Observable is growing our education programs to support your work better, and we need your input.
The following survey will help us improve our education community programs, learning opportunities, and more.
✏️ Take the survey: docs.google.com/forms/d/e/1FAIpQLSfHMyjXQRjaNoGsmsLt4CMGB… -
Observable
@observablehq
🗓️ Save the date!
From April 10th -20th we invite student teams to explore data for new insights - together.
🏆 The top teams will win cash, Observable merch, and more! -
Observable
@observablehq
🌐 Are you interested in uncovering hidden patterns and motifs in your data?
Look no further than "Motif" - an innovative visualization tool by @ThomasAnsart that makes pattern recognition easy!
👉 observablehq.com/@ateliercartographie/motif -
Observable reposted
Deepali Kank
@DeepaliKank
Learning @observablehq and JS from @eagereyes' "Data Visualization Fundamentals and Best Practices" course. Enjoying it so far.
-
Observable
@observablehq
🎬 Check out this notebook by Urvi Jain where they used SQL to analyze the Oscars dataset and explored exciting insights such as which films and categories had the most wins and nominations.
🍿 observablehq.com/d/6a54b726686a6c40 -
Observable
@observablehq
🗣️ Our CEO and co-founder, @mmeckf , recently had an insightful conversation with Venturi’s voice about the future of data collaboration.
🚀📈 Hear more about her thoughts on data collaboration, strategic hiring and building company culture.
🎧 pod.co/venturis-voice-technology-leadership-staffing-care… -
Observable
@observablehq
Say goodbye to Daylight Saving Time frustration with this amazing tool! ☀️🕰️ Thanks to @awoodruff for creating this life-saver. No more missed appointments or confusion!
🔎 Explore here: observablehq.com/@awoodruff/daylight-saving-time-gripe-as… -
Observable
@observablehq
🧠 Starting in 30 minutes: Part 4 of our Data Visualization Fundamentals and Best Practices course led by Data Visualization Developer @eagereyes!
🎟️ Join us here: observablehq.com/@observablehq/datavizcourse -
Observable
@observablehq
🧠 Tomorrow: Part 4 of our Data Visualization Fundamentals and Best Practices course led by Data Visualization Developer @eagereyes
⬇️ Sign up below!
observablehq.com/@observablehq/datavizcourse -
Observable
@observablehq
Unlock the power of your data with our new @databricks and @MongoDB database connections!
🌐 We now make it easier to query your Databricks or MongoDB clusters directly from your Observable notebooks.
Visit our blog to learn more and get started today:
old.observablehq.com/blog/databricks-mongodb -
Observable
@observablehq
👀 mind blown! AND we see our embeds!
Shubham Saboo
@Saboo_Shubham_
Breaking 🚨
OpenAI just dropped GPT-4 and it can literally blow your mind 🤯
GPT-4 is a large multimodal model that can accept image and text inputs and emits text outputs.
Capabilities of GPT-4 in a thread 🧵👇 -
Observable
@observablehq
🧠 Starting in 30 minutes: Part III of our Data Visualization Fundamentals and Best Practices course led by Data Visualization Developer @eagereyes
🎟️ Sign up here: observablehq.com/@observablehq/datavizcourse -
Observable
@observablehq
🧠 Tomorrow: Part III of our Data Visualization Fundamentals and Best Practices course led by Data Visualization Developer @eagereyes
⬇️ Sign up below!
observablehq.com/@observablehq/datavizcourse -
Observable
@observablehq
Fork & explore these global temperature differences with this interactive Hot/Cold map by @Harry_Stevens; you can zoom in and out of different regions, analyze temperature changes over time, and more. 🗺
observablehq.com/@climatelab/hotcold-map -
Observable
@observablehq
Sign ups are OPEN for our upcoming Student Data Jam!
From April 10th - 20th, Observable invites student teams to explore data sets related to higher education for new insights, and it's FREE.
👉 observablehq.com/@educators-network/data-jam-sp23?collect… -
Observable
@observablehq
Starting in 30 minutes, part 2 of the Data Visualization Fundamentals and Best Practices course led by Data Visualization Developer Robert Kosara @eagereyes
Sign up here: 👉 observablehq.com/@observablehq/datavizcourse -
Observable
@observablehq
🔎 Looking for high-quality datasets to fuel your data science projects or research? Check out this curated list of datasets. Explore the datasets, create your own visualizations and gain valuable insights from the data.
Fork + Explore here: observablehq.com/@observablehq/curated-datasets -
Observable
@observablehq
Get ready to be mesmerized! 🌀🎨 Check out this beautiful concentric circles data visualization created with D3 by @LVNGD.
Explore the patterns and colors that emerge as the circles move and overlap: observablehq.com/@lvngd/concentric-circles-in-d3 -
Observable
@observablehq
🧠 Join us starting TOMORROW with Data Visualization Developer @eagereyes, who will be teaching our Data Visualization Fundamentals and Best Practices course.
🎟️ Register for free here: observablehq.com/@observablehq/datavizcourse -
Observable
@observablehq
🤔 The struggle of navigating API documentation is real. But, visualizing your data has never been easier with Plot.projections and Plot.geo.
We share this notebook by our very own Aaron Kyle Dennis on how to conquer even the most tricky examples.
observablehq.com/@ambassadors/plot-geo-gotchas -
Observable
@observablehq
🧠 1000+ of you have signed up so far! Join us starting March 7th; join Data Visualization Developer @eagereyes as he leads our #datavisualization Fundamentals and Best Practices course.
Sign up here: 👉 observablehq.com/@observablehq/datavizcourse -
Observable
@observablehq
Fork + explore this interactive visualization tool that lets you create stunning and unique graphics in real-time! With "Brush" by Heman Robinson, you can experiment with different brush styles, colors, and sizes to create your own unique designs. 🎨
observablehq.com/@heman/brush -
Observable
@observablehq
"Sign ups are OPEN for our upcoming Student Data Jam!
From April 10th - 20th, Observable invites student teams to explore data sets related to higher education for new insights, and it's FREE.
👉 observablehq.com/@educators-network/data-jam-sp23?collect…" -
Observable
@observablehq
💭 Dig in and learn about cell modes, reactive Markdown, and HTML in this comprehensive guide. Get hands-on experience with the latest in data visualization tools and techniques.
👉 observablehq.com/@observablehq/learning-observable-cell-m… -
Observable
@observablehq
🤔 Did you know you could simply paste a url over your text in a markdown cell to turn it into a link?
No need to interact with toolbars; just paste the url over your text. -
Observable
@observablehq
🧠 Beginning on March 7th, Data Visualization Developer Robert Kosara @eagereyes will lead Observable's Data Visualization Fundamentals and Best Practices course.
Sign up here: 👉 observablehq.com/@observablehq/datavizcourse -
Observable reposted
Paul Chaikin
@paulchaikin
I made an @observablehq notebook for determining the circumcenter of a spherical cap from three points (e.g. Okoppe, Hokkaido is equidistant from Berlin, San Diego, and Byron Bay): observablehq.com/@pamacha/we-should-meet-in-hokkaido
-
Observable
@observablehq
Sign ups are OPEN for our upcoming Student Data Jam!
From April 10th - 20th, Observable invites student teams to explore data sets related to higher education for new insights, and it's FREE.
👉 observablehq.com/@educators-network/data-jam-sp23 -
Observable reposted
ilica
@IlicaMahajan
Come learn how to build @observablehq notebooks to analyze, visualize, and fact-check your data! @eads @Weihua_Li1 @agarcia_me and I are teaching this awesome workshop. www.ire.org/product/nicar23-first-observable/
-
Observable
@observablehq
🔎 Fork & explore @joewdavies's notebook where they explore new ways of making maps with color arrays, maps in Hex, RGB or CYMK format.
👉 observablehq.com/d/ab5d7d5a5d9e9e16 -
Observable
@observablehq
👉 Sign up now for our 3 week course on Data Visualization Fundamentals and Best Practices for FREE!
-
Observable reposted
Lino Galiana
@LinoGaliana
I have started to build a calendar to vizualize interesting events for the network of #datascientists I lead.
Despite my ignorance of #javascript, it has been quite easy with @observablehq. Thanks a lot to @recifs for the amazing Plot library:
Notebook: observablehq.com/@linogaliana/calendar -
Observable
@observablehq
🧠 Beginning on March 7th, Data Visualization Developer Robert Kosara @eagereyes will lead Observable's Data Visualization Fundamentals and Best Practices course.
Sign up here: 👉 observablehq.com/@observablehq/datavizcourse -
Observable reposted
Weihua Li 李卫华
@Weihua_Li1
Coming to #nicar23? Join us for a 🔥 fun workshop 🔥to build your first @observablehq notebook!
With @eads, @IlicaMahajan and @agarcia_me, we'll go over how to analyze and visualize data with Observable + how it makes data reporting more collaborative.
www.ire.org/product/nicar23-first-observable/ -
Observable
@observablehq
🔎 Find out how to add annotations to your Plot viz data set and few other handy tricks we've gathered from the community by @pbbuffa
👉 observablehq.com/@observablehq/pauls-observable-tips-tricks -
Observable
@observablehq
🗓️ SAVE THE DATE!
Beginning on March 7th, Data Visualization Developer Robert Kosara @eagereyes will lead Observable's course on Data Visualization Fundamentals and Best Practices.
👀 Be on the lookout next week when we share the sign-up link! -
Observable
@observablehq
Never too late for a Valentine's Plot piece: like this one by @hrbrmstr!
👉 observablehq.com/@hrbrmstr/happy-heart-day -
Observable
@observablehq
Thank you for joining us today for our Community Show + Tell: "Examples in Data Visualizations". 🙏
💬 For more updates on upcoming events and exclusive Observable news, join us on our Slack Community channel here: observablehq.com/slack/join -
Observable reposted
Paul Chaikin
@paulchaikin
i'm having fun animating the new Plot template for Marimekko charts on @observablehq. great potential for quickly visualizing multi-scale time series, polyrhythms, and other complex signals.
observablehq.com/@pamacha/undulating-marimekko -
Observable
@observablehq
Join us tomorrow for an inside look at some of the latest popular notebooks on Observable during the Examples in Data Visualization Meetup.
RSVP: meetup.com/observablehq/events/291473687/
February 15th, 9am PST / 12pm EST
#dataviz #datavisualization -
Observable reposted
Tanya Shapiro
@tanya_shapiro
Motivated to try new things after watching @allison_horst demo @observablehq notebooks.
TIL you can create dynamic SQL queries with inputs. Then you can feed the results directly into a plot! 🤯
Also v much in ❤️ with the ability to plot images
Code: observablehq.com/d/6826734a309b9f69 -
Observable
@observablehq
Merge Sort made in #d3: #valentine's Edition. See how @LVNGD created their heart lines. 💘
observablehq.com/@lvngd/merge-sort-valentines-edition -
Observable
@observablehq
This Wednesday, learn from the community during the Examples in Data Visualization show-and-tell event with
presenters. Claudio Esperança @max_graze @chrispahm & Chris Ried
RSVP: www.meetup.com/observablehq/events/291473687/
February 15th, 9am PST / 12pm EST -
Observable reposted
Karim Douïeb
@karim_douieb
🌎 Rorschach Map: What do you see? #cartography #psychology
Interactive version openly available in the following @observablehq notebook 👉 observablehq.com/d/5c65efd4a5d5ef04
Inspiration: @JavierJaenB -
Observable
@observablehq
Honored to make the list!
Madeline Renbarger
@maddierenbarger
Our annual list of startups to bet your career on is here! @steph_palazzolo @stokessamanthaj and I compiled @BusinessInsider’s roundup of startups with strong teams and VC backing from top #venturecapital investors to bet your career on in 2023. www.businessinsider.com/startups-to-bet-your-career-on-20…
-
Observable
@observablehq
A dependency graph is a social network, and we’re working on how to show those connections better on Observable. (Here you see @jashkenas’s inputs library became so popular that we added inputs to the standard library.)
This media couldn't be displayed. See it on the original post.Post not available here, view on X
Observable
@observablehq
Our internal testing has made @mootari realize some less-liked notebooks have far more importers. And @visnup could update an old notebook with the confidence that he wasn’t breaking other ones, by version-locking or updating importers.
Observable
@observablehq
Check out some of our most-imported community notebooks: observablehq.com/@makio135/bnb, observablehq.com/@mootari/range-slider, observablehq.com/@fil/math, observablehq.com/@harrystevens/circle-legend, observablehq.com/@rreusser/regl-tools
And, of course, let us know what you’d like to see next. -
Observable
@observablehq
Sharing our latest tutorial: Build Your First Choropleth Map with Observable Plot!
👉 observablehq.com/@observablehq/build-your-first-choroplet…
Check it out to learn how to quickly make & customize beautiful choropleth maps, then add interactivity w/ tooltips & inputs! 🗺️
#dataviz #tutorials -
Observable reposted
Journocoders
@journocoders
This month we’re learning about using @observablehq! It’s also our first meetup at our new base @f_l_o_u_r_i_s_h!
-
Observable
@observablehq
Join us next week for an inside look at some of the latest popular notebooks on Observable during the Examples in Data Visualization Meetup.
RSVP: meetup.com/observablehq/events/291473687/
February 15th, 9am PST / 12pm EST
#dataviz #datavisualization -
Observable reposted
Loris Mat
@lorismat_
After a while, I got back to protoyping with @observablehq for my scrollytelling project on-the-road.lorismat.com
New updates are super refreshing 👌 🙏 ! For me, still the best tool to prototype and document quickly in #d3js #dataviz
observablehq.com/@git1984/interactive-paths-on-a-map -
Observable
@observablehq
Join us for our next learning opportunity.
Examples in Data Visualization!
With: Claudio Esperança @max_graze , @chrispahm & Chris Ried
RSVP: www.meetup.com/observablehq/events/291473687/
February 15th, 9am PST / 12pm EST
#dataviz #datavisualization -
Observable
@observablehq
Get a taste of Observable! See how our notebooks put you and your team on the fast track.
This notebook is alive - you can tinker with the code, play with D3 viz and learn essential things like how your age compares to Jonathan the Tortoise’s 🐢
👉 observablehq.com/@observablehq/a-taste-of-observable -
Observable reposted
Observable
@observablehq
Build and customize data visualizations faster with our Plot Javascript library:
👉 observablehq.com/@observablehq/learning-observable-observ… -
Observable
@observablehq
Build and customize data visualizations faster with our Plot Javascript library:
👉 observablehq.com/@observablehq/learning-observable-observ… -
Observable reposted
Chris Ried (generatecoll)
@generatecoll
Watch it wiggle...
Did most of my #genuary pieces on @observablehq check it out!
observablehq.com/d/80c941c534374c23
#generative #processing -
Observable
@observablehq
🔮 To kick off the year, dataviz industry experts: @terezaif, @KristinHenry and our very own CEO and Co-Founder @mmeckf share their forecasts and hopes for 2023.
👉 Read on here: old.observablehq.com/blog/data-visualization-predictions -
Observable
@observablehq
This week we share with you a notebook by @chrispahm visualizing wind turbines in 3D using threebox.
Creating your own wind turbine visualization only involves 3 steps, fork and explore here:
observablehq.com/@chrispahm/visualizing-wind-turbines-in-… -
Observable reposted
Vivien Ho
@VivHo
Hear from amazing technical leaders in AI/ML and Cloud 👩🚀
@mmeckf ✨ CEO/Founder @observablehq, Former VP Eng @Google
@apbhatnagar ✨Visiting Partner @PearVC, Former Head @Google DevOps & @kubernetesio
@lijiali_vision ✨ AI Fellow, Prof @Stanford, Co-Founder @googlecloud -
Observable
@observablehq
Data Journalists @xavigimenez & @MarieSegger at @TheEconomist outline how Observable notebooks, data visualization libraries, and other data-related tools free up time to explore, ideate, experiment and ultimately craft the best data-driven stories.
👉 view.e.economist.com?qs=06c048ddf305becb44562995e5626bf03… -
Observable reposted
Shirley Wu
@sxywu
for my last semester I'm taking my first & last code class—Nature of Code w/ @shiffman! but I wanted to see if I can practice #webgl + use @observablehq for quick iteration and came back across @MAKIO135's notebook and WOW it is SO beautiful&resourceful 💖observablehq.com/@makio135/creative-coding
-
Observable
@observablehq
Did you know you can use prettier.io to auto-format your JavaScript code with a simple ⌥⇧F, and instantly make it easier to read?
Or, auto-enable this feature by going to Settings, Editor Preferences, and checking "Auto-format code." -
Observable reposted
Allison Horst
@allison_horst
Want to start making maps in Observable Plot? @recifs, @pbbuffa & I made a tutorial that walks you through building your first map 🗺️ Check it out, along with other new resources on mapping with Plot!
📒Tutorial: observablehq.com/@observablehq/build-your-first-map-with-… -
Observable
@observablehq
🆕 New Community Highlights this week on:
House Buying Analysis
Particle Lenia from scratch
Colors for Maps
Visualizing wind turbines in 3D using threebox
View all ➡️ observablehq.com/community
🙏 Thank you to our @observablehq #community for creating with us.
#dataviz -
Observable
@observablehq
⚡ Fast, frictionless, interactive #eda means more responsible EDA.
👉 Our very own #datascience advocate @allison_horst discusses using Observable to do your "data due diligence.": old.observablehq.com/blog/resp-data-exploration -
Observable
@observablehq
Reminder, the Data Visualization Predictions for 2023 panel is today at 9am PST / 12 PM EST . Hope you can join us.
➡️ meetup.com/observablehq/events/290337181/
Observable
@observablehq
Join us tomorrow at 9am PST for a discussion on predictions for data visualization in 2023 with Melody Meckfessel @mmeckf, Tereza Iofciu @terezaif Kristin Henry @KristinHenry, and @waynesutton
RSVP ➡️ meetup.com/observablehq/events/290337181/
#dataviz #datavisualization -
Observable reposted
Christoph Pahmeyer
@chrispahm
Visualize wind turbines in 3D using this free @observablehq notebook. Build using #threebox (@theejs + @mapbox). Enables easy link sharing with no installation required. Works anywhere in the world!
Let me know what you think 🙂
observablehq.com/@chrispahm/visualizing-wind-turbines-in-… -
Observable
@observablehq
Join us tomorrow at 9am PST for a discussion on predictions for data visualization in 2023 with Melody Meckfessel @mmeckf, Tereza Iofciu @terezaif Kristin Henry @KristinHenry, and @waynesutton
RSVP ➡️ meetup.com/observablehq/events/290337181/
#dataviz #datavisualization -
Observable reposted
Alex Mordvintsev
@zzznah
New tutorial: Particle Lenia from scratch. How hard is it to create PL from scratch using pure Javascript? observablehq.com/@znah/particle-lenia-from-scratch
-
Observable reposted
Scott Condron
@_ScottCondron
Not a slide deck but these tutorials from @observablehq observablehq.com/@observablehq/workshop-intro-to-data-vis…
-
Observable
@observablehq
🎉 New Year, new skill. Learn JavaScript and future-prep your career for the future of data.
👉 Observable's @pstuffa shares four ways to get started: observablehq.com/@observablehq/4-ways-to-get-started-with… -
Observable
@observablehq
Belo Investment Research uses Observable to explore non-traditional data sources to help their clients make better-informed investing decisions. Check out our latest customer story to learn more about how they do it... old.observablehq.com/customer-stories/belo-investment-res…
-
Observable
@observablehq
Join us today at 1pm EST!
Observable
@observablehq
January 12th we’ll host an hour of short talks and Q&A with the Observable team, including @allison_horst, @mf_viz, and @recifs. We’ll explore some brand new & enhanced features!
Using Observable for teaching or research? Join us ⬇️
www.meetup.com/observablehq/events/289610071/ -
Observable
@observablehq
🆕 New Community Highlights this week on:
Plot Scatterplot
Colors for maps
#genuary
Flow-based cartograms
View all ➡️ observablehq.com/community
🙏 Thank you to our @observablehq #community for creating with us.
#dataviz -
Observable
@observablehq
✴️ 2022 was an exciting and challenging year and the Observable community continues to inspire us with their incredible work and creativity.
👉 Read our 2022 Retrospective piece by our CEO @mmeckf highlighting our gratitude and milestones: old.observablehq.com/blog/2022-observable-retrospective -
Observable
@observablehq
Mark your calendars! On January 18th at 9am PST / 12 pm EST, join us for an engaging conversation about predictions for Data Visualization in 2023. Don't miss out, RSVP now at www.meetup.com/observablehq/events/290337181/
-
Observable
@observablehq
January 12th we’ll host an hour of short talks and Q&A with the Observable team, including @allison_horst, @mf_viz, and @recifs. We’ll explore some brand new & enhanced features!
Using Observable for teaching or research? Join us ⬇️
www.meetup.com/observablehq/events/289610071/ -
Observable reposted
Chris Ried (generatecoll)
@generatecoll
#genuary5 - Debug View
Going to port and create all of #genuary2023 in @observablehq
observablehq.com/d/d640e9c9d70d5865 -
Observable reposted
ʈim anton willem
@timmolendijk
Quick shout-out to @observablehq (JS notebooks) with their new Grammar Graphics library [Plot](observablehq.com/@observablehq/plot) (akin to R’s ggplot).
Hits the sweet spot between quick iteration and max flexibility (it’s all just JS/D3), aesthetically pleasing, absolute joy to use! 👌 -
Observable
@observablehq
The Observable team, aka "Observables," shared their top picks for their favorite notebooks of 2022 and the reasons behind their selections.
Here's the list ➡️ observablehq.com/blog/favorite-data-visualizations-of-2022
What was your favorite notebook of 2022?
#dataviz -
Observable
@observablehq
🆕 New Community Highlights this week on:
Algorithmic Trees, Who to follow on #mastodon, #genuary and more!
View all ➡️ observablehq.com/community
🙏 Thank you to our @observablehq #community for creating with us. #dataviz -
Observable reposted
Lino Galiana
@LinoGaliana
Rétrospective 2022 de la data science pour le réseau que j'anime à l'Insee: ssphub.netlify.app/post/retrospective2022/
Retour sur #aiart avec #dalle2 #stablediffusion, #chatgpt, succès de @huggingface et @PyTorch, @quarto_pub (cc @chrisderv) et @observablehq (cc @ericMauviere et @neocartocnrs) -
Observable reposted
Irene de la Torre Arenas
@inari_ta
Check the code or create your own animation at observablehq.com/d/afc44c33d5a07ae8
-
Observable reposted
Irene de la Torre Arenas
@inari_ta
Happy New Year, everyone! I hope your 2023 is as bubbly as it can get!
Starting #genuary2023 with a very festive infinite loop.
Done with @observablehq -
Observable
@observablehq
🛍️ It's the time of year when people are thinking about retail sales & how to make their experience better. We want to help you do just that.
Observable created a notebook to help data folks in retail visualize monthly reports & uncover better insights. observablehq.com/@observablehq/visualizing-monthly-retail… -
Observable
@observablehq
🆕 New Community Highlights this week on:
Number Encodings using Trees, Recreating Boetti's Map of the World,
Typeface creation and more
View all ➡️ observablehq.com/community
🙏 Thank you to our @observablehq #community for creating with us. #dataviz #dataanalytics -
Observable
@observablehq
💡 We are currently looking to fill a variety of roles, including Principal Engineer, Sales Development Representative, Senior Software Engineer and more.
👉 Check out jobs here: observablehq.com/about
#hiring -
Observable
@observablehq
To speed up your data work, here's where we share a helpful #observabletip - that you may not have been aware of.
Did you know that dragging a file near the Files Pane of an Observable notebook auto-opens the Files Pane? Then, you can drop your file there! -
Observable
@observablehq
💊 #biotech and #pharmaceutical companies face a unique set of challenges. Learn how @sumitovant, @TriNetX and others use Observable to explore their #data and make faster, better-informed decisions that impact patients, their company & the world.
➡️ observablehq.com/blog/biotech-pharma-dataviz -
Observable reposted
Karim Douïeb
@karim_douieb
Wow, thanks @observablehq for this recognition. I am surprised and humbled to be included on that list because I occasionally feel as like I have taken more from the community than I have given, and I wouldn't be where I am now without it.
Observable
@observablehq
🏆 This year, we would like to recognize extraordinary members of our community; those who have gone above and beyond.
These engaged and supportive community members help us grow and develop as we make data accessible to everyone.
👉 old.observablehq.com/blog/community-recognition-2022 -
Observable
@observablehq
🏆 This year, we would like to recognize extraordinary members of our community; those who have gone above and beyond.
These engaged and supportive community members help us grow and develop as we make data accessible to everyone.
👉 old.observablehq.com/blog/community-recognition-2022 -
Observable
@observablehq
🆕 New Community Highlights this week from:
ASN Data Analytics Program, boB Rudis @hrbrmstr and more!
View all ➡️ observablehq.com/community
🎉 Like, share & congratulate.
🙏 Thank you to our @observablehq #community for creating with us. #dataviz #dataanalytics -
Observable reposted
Andy Bloch
@Andy_Bloch
Hint: Here’s an @observablehq notebook with a simple SIR model with a temporary intervention. Play around with the “Intervention start day” slider input to minimize the cumulative number of infected people. observablehq.com/@andy-bloch/sir-with-short-intervention
-
Observable reposted
jim goetz
@jimgoetz
Great thoughts from @observablehq founder @mmeckf on creating your own path.
www.businessinsider.com/former-google-engineer-work-life-… -
Observable reposted
Francois Laberge
@seflless
I'm working on getting full Typescript type-checking/auto-completing/etc running in @convey_it, integrated with the existing Codemirror editor
I found this jewel from Observable's blog. Thought I'd share it with all you web-based programming builders.
observablehq.com/@observablehq/bringing-the-typescript-la… -
Observable reposted
Adolfo Guimarães
@adolfoguimaraes
Exemplo feito para a aula de inteligência artificial utilizando o ml5js.org no @observablehq. Disponível aqui: observablehq.com/@adolfoguimaraes/image-draw-with-m5-js
PS: eu não sei desenhar 😅😅 -
Observable reposted
Julie Bort
@Julie188
For anyone wondering if they should ditch the golden handcuffs and pursue something less predictable, read this from @mmeckf who writes, I left a high-powered job at Google to launch my own startup, and I've never been happier www.businessinsider.com/former-google-engineer-work-life-… via @businessinsider
-
Observable reposted
Menlo Ventures
@MenloVentures
@observablehq CEO @mmeckf left a high-powered job at Google to launch her startup. In this great profile she shares her thoughts on why taking the leap was such a great move--professionally & personally! We're glad she did! www.businessinsider.com/former-google-engineer-work-life-… via @Julie188 @businessinsider
-
Observable
@observablehq
If you were unable to attend yesterday's meetup with Paul Buffa @pstuffa on "What's new with Observable," you can watch the replay on our YouTube channel ➡️ youtu.be/_dh5NmfxmH0a
-
Observable
@observablehq
We are back up! Apologies for any inconvenience.
Observable
@observablehq
Our site is currently experiencing an outage, and we are working to fix the issue - we will update as soon as possible.
-
Observable
@observablehq
Our site is currently experiencing an outage, and we are working to fix the issue - we will update as soon as possible.
-
Observable
@observablehq
🎉 Hailing from @UCIrvine, Team Koi Pond are the 2022 Observable Data Jam winner.
➡️ Read about their account of their collaborative journey toward victory here: observablehq.com/@observablehq/observable-data-jam-winner… -
Observable
@observablehq
🆕 New Community Highlights this week from:
@karim_douieb, @maerune @neocartocnrs and @mourner
View all ➡️ observablehq.com/community
🎉 Like, share & congratulate.
🙏 Thank you to our @observablehq #community for creating with us. #dataviz #dataanalytics -
Observable
@observablehq
Chrome 108, released widely yesterday, introduces a bug where a <select> (dropdown) in an iframe outside the initial viewport may not work, which affects inputs in Observable notebooks. For now you can try a different browser. We’re monitoring the issue: bugs.chromium.org/p/chromium/issues/detail?id=1395079
Observable
@observablehq
Chrome just fixed this; you can go to chrome://settings/help to upgrade. Thanks!
-
Observable
@observablehq
Reminder: Starting in 1 hour.
What's new @observablehq Meetup with Paul Buffa @pstuffa and the Observable team.
➡️ Join us www.meetup.com/observablehq/events/289096255/ -
Observable
@observablehq
❓ Are you interested in learning about the latest updates on @observablehq to improve your data visualization skills?
📆 Join us tomorrow, 12/7, 9am PDT with Paul Buffa
@pstuffa
and the Observable team to discuss!
➡️ RSVP www.meetup.com/observablehq/events/289096255/ -
Observable reposted
Karim Douïeb
@karim_douieb
🗳 US election results for the midterms are almost final. We can finally share the work we've produced for @CBSNews: A House Election cartogram with a twist.
Full details on how this map has been built & open source code in this @observablehq notebook👇
observablehq.com/@karimdouieb/us-house-election-2022 -
Observable
@observablehq
Check out how we made some improvements to how embedding works in Observable!
👉 observablehq.com/@observablehq/release-notes -
Observable reposted
Observable
@observablehq
A lot of new features and changes have happened at Observable over the past couple of months!
🧠 Join us next week (12/7) for our next community meetup with Paul Buffa (@pstuffa) and the Observable team to discuss!
👉 Sign up here: www.meetup.com/observablehq/events/289096255/ -
Observable reposted
Tom Larkworthy
@tomlarkworthy
I published the @trendingnotebo2's Twitter Analytics which neatly records @observablehq's trending notebook endpoint AND adds another level of content scores so you can find what really resonated.
Fork and do your own thing with the data.
observablehq.com/@tomlarkworthy/twitter-trending-notebook… -
Observable
@observablehq
A lot of new features and changes have happened at Observable over the past couple of months!
🧠 Join us next week (12/7) for our next community meetup with Paul Buffa (@pstuffa) and the Observable team to discuss!
👉 Sign up here: www.meetup.com/observablehq/events/289096255/ -
Observable reposted
Zach Bogart
@zachbogart
Just added another version, this time for GitHub repos. @observablehq is the place to be. observablehq.com/@periscopic/github-api-in-observable
-
Observable
@observablehq
🎉 Congrats Observable's very own co-founder and creator of @d3js_org: @mbostock for receiving the Test of Time award from @infobeautiful!
www.informationisbeautifulawards.com/news/593-information… -
Observable reposted
wink
@winkjs_org
Transform any @Wikipedia article into a timeline — a graphical representation of a time period, on which important events are highlighted using #winknlp and @observablehq on any browser.
👉 observablehq.com/@winkjs/how-to-visualize-timeline-of-a-w…
#nlp #javascript #nodejs -
Observable
@observablehq
If you’ve been wrangling data in the tidyverse, the Arquero library in #javascript will feel familiar.
Here's a primer to help translate common wrangling methods from dplyr & tidyr to Arquero by our very own Data Science Advocate
@Allison_Horst👇
observablehq.com/@observablehq/data-wrangling-with-arquer… -
Observable
@observablehq
This morning, an automated email was sent to many users in the Observable community about providing a payment method for their accounts.
You will not be charged and no further action is required. Sincere apologies for the confusion this may have caused.
Observable
@observablehq
To clarify: if you choose to upgrade to a Pro account, you can add a payment method at any time. Otherwise you can continue to work in Observable for free.
Please direct any additional questions to support@observablehq.com
Thank you. -
Observable reposted
Allison Horst
@allison_horst
Hi #rstats users! If you’ve been wrangling data in the tidyverse, the Arquero library in #javascript will feel familiar. Here's a primer to help translate common wrangling methods from dplyr & tidyr to Arquero, so you can work more nimbly between R & JS 🪄observablehq.com/@observablehq/data-wrangling-with-arquer…
-
Observable
@observablehq
Observable is now using the #typescript Language Server to provide contextual editor hints. Software Engineer Duane Millar Barlow takes us "under the hood" and explains how it was implemented.
👉 observablehq.com/@observablehq/bringing-the-typescript-la… -
Observable reposted
Simon Willison
@simonw
I put together a git scraper to track total numbers of Mastodon users over time, and plotted the results in an @observablehq notebook. Full details of how it all works here:
simonwillison.net/2022/Nov/20/tracking-mastodon/ -
Observable
@observablehq
🧠 Data Scientist @allison_horst shares how using "import" is a fast and intuitive way to access helpful code and content from across the vast network of notebooks.
👉 Read about it here: 3 Ways Using 'Import' Expedites #datascience Workflows
observablehq.com/@observablehq/3-ways-using-import-expedi… -
Observable
@observablehq
👋 Join us here: vis.social/web/@observablehq
Observable
@observablehq
📣 We're now on @joinmastodon.
👉 Join & follow us at: @observablehq@vis.social -
Observable
@observablehq
📣 We would like to officially welcome @duckdb (WASM), an in-process SQL OLAP database management system, to our client base!
Excited and looking forward to have you onboard with us!🎉
@cmudig @ankohn @duckdblabs
observablehq.com/@observablehq/duckdb -
Observable reposted
Mike Bostock
@mbostock
Observable ❤️ DuckDB observablehq.com/@observablehq/duckdb
-
Observable reposted
Dominik Moritz
@domoritz
@observablehq now has an official @duckdb (WASM) client based on our work @cmudig with @ankohn and @duckdblabs. 🎉 observablehq.com/@observablehq/duckdb
I think there is no easier and faster way to analyze large datasets in the browser. Take it for a spin and make some pretty charts! 🏎️📊💻 -
Observable
@observablehq
Happy Friday! We recently got together (largely in person!) for a short hackathon to work on our favorite little ideas, including many from our feedback repo github.com/observablehq/feedback/issues, and several have shipped:
Post not available here, view on X
Observable
@observablehq
You can now create a new notebook in a collection from the collection page, thanks to @visible_world.
Observable
@observablehq
You can now edit your comments, thanks to @DestinedToGreen, @ctheun, Dunstan, @kudamushaike, and @sly67500.
Post not available here, view on X
Observable
@observablehq
You can now paste a URL over a selection to make it a link in Markdown, thanks to @camdecoster and @visnup.
Observable
@observablehq
And there’s a few that haven’t shipped yet. We’ll do this again, so add or upvote your favorite ideas on github.com/observablehq/feedback/issues.
-
Observable reposted
DataScienceWeekly
@DataSciNews
"Planning to leave Twitter?"
The team @observablehq built a dataviz tool below to illustrate how data visualization can help better inform users before they decide to delete their Twitter accounts and abandon years of useful data
2/18
Observable
@observablehq
We created the free #dataviz tool below to illustrate how data visualization can help better inform users before they delete their Twitter accounts and abandon years of valuable data.
Save & analyze your trove of data before it is gone forever.
👉 observablehq.com/@observablehq/save-and-analyze-your-twit… -
Observable reposted
Maarten Lambrechts
@maartenzam
Little update: @Datawrapper is there now (@datawrapper@vis.social), and another notable new kid on the block: @observablehq (@observablehq@vis.social) Hope other institutional #dataviz accounts will pop up there too!
Maarten Lambrechts
@maartenzam
Any of you on Mastodon, @nytgraphics @PostGraphics @Datawrapper @ReutersGraphics @SCMPgraphics @infobeautyaward @ftdata @vega_vis @rstudio @TijdGraphics @DataVizSociety @flowingdata @puddingviz @ECONdailycharts @FiveThirtyEight?
-
Observable
@observablehq
📣 We're now on @joinmastodon.
👉 Join & follow us at: @observablehq@vis.social -
Observable reposted
Allison Horst
@allison_horst
Hi ggplot2 users! Seeing OJS & wondering how to get started w/ Observable Plot to build interactive JS dataviz? You’re already most of the way there! Here I highlight how your existing grammar of graphics know-how gets you up-and-running in Plot 🏃📊
observablehq.com/@observablehq/plot-from-ggplot2
1/2 -
Observable reposted
Dr. Ajay Kumar Koli, PhD
@ajay_kolii
My data science students enjoyed the talk "Navigating the Data Science career confusion" by 🌟 @gdequeiroz on 26 Oct at @observablehq conf.
🔗 www.youtube.com/watch?v=yqt-IAqbGNU&t=6379s -
Observable reposted
Zach Bogart
@zachbogart
Working @Periscopic, have been enjoying using @observablehq more and more. Recently we made a helper to get data from Bitbucket repos. Hope it makes working with your data easier. observablehq.com/@periscopic/bitbucket-api-in-observable
-
Observable reposted
Mia S Szarvas
@Mia_Szarvas
What will the 118th #congress look like?
Friendly reminder to #vote in the #uselections2022 so you have a say.
Check out my exploration of US Congress Gender Parity published on @medium in @2nfo's publication
medium.com/two-n/women-in-congress-progress-is-slow-but-s…
and @observablehq
observablehq.com/@two-n/women-in-congress-progress-is-slo… -
Observable reposted
Ian Johnson 🔬🤖
@enjalot
I added a bunch of functionality (improved search, top tweets in tooltips, better time vis) including a preview of all the visualizations using my own tweets, check out the new and improved twitter archive analyzer!
observablehq.com/@observablehq/save-and-analyze-your-twit…
Ian Johnson 🔬🤖
@enjalot
recently download your twitter archive? want to explore your tweets with SQL? get visualizations of who your besties are over time?
then check out this notebook:
observablehq.com/@enjalot/twitter-archive-tweets
locally processes your tweets.js file (no uploading!) -
Observable
@observablehq
We created the free #dataviz tool below to illustrate how data visualization can help better inform users before they delete their Twitter accounts and abandon years of valuable data.
Save & analyze your trove of data before it is gone forever.
👉 observablehq.com/@observablehq/save-and-analyze-your-twit… -
Observable reposted
Fabian Iwand
@mootari
Get quick access to #d3js docs and examples in this @observablehq notebook:
observablehq.com/@mootari/d3-documentation -
Observable reposted
ADB Digital Sandbox
@ADB_Digital
DEADLINE OF APPLICATION EXTENDED! Help ADB tell a compelling story about climate change & resilience by submitting your creative data visualization techniques by November 8, 2022 👉🏻 challenges.adb.org/en/challenges/dataviz4climate
#climatechange #dataviz #climateresilience
@ADB_HQ @observablehq -
Observable reposted
mauforonda
@mauforonda
Por ejemplo puedes explorar esta misma información de muchas otras formas, como el sitio que hice hace unos meses observablehq.com/@mauforonda/convocatorias-publicas-del-g… que tiene varios gráficos bonitos y se actualiza cada día 😉
-
Observable
@observablehq
💡 Tips and tricks for using the Observable editor:
Pro tips: Inserting cells:
➡️ observablehq.com/@observablehq/pro-tips-inserting-cells
via Mike Bostock @mbostock -
Observable reposted
DataKind
@DataKind
#icymi Here's the recording from our #datavisualization workshop with @observablehq. How do you bring your #data to life through visuals? Check it out! 👉 drive.google.com/file/d/1xYA-iv5DLGJJppUtZBQuVQ8Dc7JWNk86…
@hacktoberfest
#hacktoberfest2022 #dataviz #data4good
DataKind
@DataKind
Have you registered yet for today's free virtual workshop on #datavisualization?
Don't miss out on the opportunity to build #visualizations and take home #data and #code to keep practicing on your own.
➡️ datakind-org.zoom.us/meeting/register/tZ0vfuyoqz4vGd1KjWi…
#hacktoberfest2022 #data4good -
Observable reposted
Harris Lapiroff
@harrislapiroff
Extremely cool notebook. Here's my tweet history on this account. (I gotta export my old account too!)
Ian Johnson 🔬🤖
@enjalot
recently download your twitter archive? want to explore your tweets with SQL? get visualizations of who your besties are over time?
then check out this notebook:
observablehq.com/@enjalot/twitter-archive-tweets
locally processes your tweets.js file (no uploading!) -
Observable reposted
ADB Digital Sandbox
@ADB_Digital
2 more days before application deadline (November 4, 2022).
Do you want to make a difference in the global climate change conversation? Apply now before it’s too late!👉🏻challenges.adb.org/en/challenges/dataviz4climate
#climatechange #dataviz #climateresilience #climateactionnow @ADB_HQ @observablehq -
Observable
@observablehq
🦇 Halloween may be over but it's not too late to sink your fangs into #javascript’s strict equality operator (===), which compares two values to see if they match in value and type.
👀 Notebook by our very own #datascientist Advocate @allison_horst!
observablehq.com/@observablehq/tricks-treats-2022 -
Observable reposted
Allison Horst
@allison_horst
Throughout the day, I’m excited to share pieces that @VPoltrack & I made to highlight tricks & treats to get started in JavaScript & @observablehq! As Observable Ambassador @mayacelium shares, "Observable makes all the JavaScript scaries go away." 🎃 #javascript
-
Observable reposted
ADB Digital Sandbox
@ADB_Digital
Do you have any creative idea on how to visualize the data on the effects of climate change? Apply by November 4, 2022👉🏻challenges.adb.org/en/challenges/dataviz4climate
#climatechange #datavisualization #dataviz #climateresilience #climateaction @ADB_HQ @observablehq -
Observable reposted
Antoine Bichat
@_abichat
Awesome #observable workshop at @rinpharma by @mf_viz & @allison_horst 🤩
Can’t wait to add interactivity inside my #quarto documents 📃
#rstats #dataviz -
Observable reposted
Olivia Vane
@OliviaFVane
So enjoyed taking part in Observable Insight 2022 @observablehq - what a great atmosphere!
You can watch my talk about drawing waterlines 🌊 with code here 👉 youtu.be/sJbPyCLaUG8?t=6314
#dataviz #design
Observable
@observablehq
🌊 @OliviaFVane shares lessons and reflections around the power of images, connecting to historical examples and writing in notebooks on #observableinsight
👉 hopin.com/events/observable-insight/registration -
Observable
@observablehq
That's a wrap for Observable Insight 2022! Thank you to our outstanding speakers, guests and attendees. 🙏
We have so much to share with you, so let's stay connected via our Observable community slack:
👉 observablehq.com/slack/join -
Observable
@observablehq
Hear from the winning student team, Koi Pond from @UCIrvine, of our most recent DataJam with our EDU Community Manager @cfrancisrun
👉 hopin.com/events/observable-insight/registration
Observable
@observablehq
The winning team's notebook is SO impressive! 🎉 Congrats to Nora, Naol & Dylan from @UCIrvine for winning our first Observable Data Jam. Please check out their incredible work: observablehq.com/d/063831f0d58867b2
-
Observable
@observablehq
👁️🗨️ Join us and @eads from the @MarshallProj, he looks at how to use real-world data sources to write sentences that help make decisions.
👉 hopin.com/events/observable-insight/registration
Observable
@observablehq
"Instead of trying to immediately quantify something or do descriptive stats, it’s so important to just look at the records. We build little tools that sample our data and write sentences, so we start to get a feel for our data.” -@eads
Observable
@observablehq
On tools that lower barriers in data exploration/analysis: "You can start building intuition (about data) using basic 101 code. Many people are intimidated by this stuff - these things start to create some cultural space in your org & more effective conversations about data"@eads
-
Observable
@observablehq
🎓 Join us now as we listen to @saraquigley and her session on Observable in Higher Education, intended for data analysts working in a decentralized setting.
👉 hopin.com/events/observable-insight/registration
Observable
@observablehq
Summarizing tips for efficient ad hoc data analysis, @saraquigley shares: Save time, use a template with frequently used code and imports. "Observable has wonderful fork functionality and code snippets." ⏩📈
-
Observable
@observablehq
Join us for a case study by Carmen Torrecillas on how to convey and personalize complex data in a way that audiences can process and engage with at a glance on #observableinsight
👉 hopin.com/events/observable-insight/registration
Observable
@observablehq
Carmen on the power of community in learning: "I encourage people to be a part of the community, because I just found people helping all the time...the amount of amazing things happening daily and the amazing community behind it are there to help you when you’re stuck.” 💓
-
Observable
@observablehq
🎓 See how Prof. David Kirkby of @UCIrvine uses Observable in the University Classroom and Research Lab on #observableinsight
👉 hopin.com/events/observable-insight/registration
Observable
@observablehq
David Kirkby from @UCIrvine has some very inspirational #dataviz notebooks on Observable: observablehq.com/@dkirkby
Observable
@observablehq
"I would never have tried anything this ambitious without the help of tools and starting points provided by Observable and D3... the embedding and exporting are so powerful." David Kirkby from @UCIrvine
-
Observable
@observablehq
⌛ Let's go back in time with @tophtucker as he discusses Five Thousand Years of Graphics on #observableinsight
👉 hopin.com/events/observable-insight/registration
Observable
@observablehq
If you've never attended a learning session with @tophtucker, you should drop what you are doing and join asap. Treat yourself.
-
Observable
@observablehq
Up next we have @inari_ta and their presentation Eurovision Results of Spanish Artists, Composers, and Lyricists by Gender using Plot.js on #observableinsight
👉 hopin.com/events/observable-insight/registration
Observable
@observablehq
Observing a social phenomenon and then deciding to explore it as data is truly next level. Want to go deeper? Go here: observablehq.com/@irenedelatorre/eurovision-data-analysis…
-
Observable
@observablehq
👁️🗨️Join us now live for our workshop: Build an Advanced Report from Simple Pieces now hosted by @enjalot
👉 hopin.com/events/observable-insight/registration
Observable
@observablehq
Are you ready for an amazing live coding session with Observable's own @enjalot? Follow along via this notebook: observablehq.com/@demoteam/my-little-dashboard
Observable
@observablehq
This notebook provides a great tutorial of the basics from @enjalot's talk: observablehq.com/@observablehq/which-items-are-purchased-…
-
Observable
@observablehq
🌊 @OliviaFVane shares lessons and reflections around the power of images, connecting to historical examples and writing in notebooks on #observableinsight
👉 hopin.com/events/observable-insight/registration
Observable
@observablehq
The waterlines collection from @oliviafvane should not be missed: observablehq.com/@oliviafvane/i-drawing-water-in-old-maps…
Observable
@observablehq
"Get inspired by history, don't forget about the power of aesthetics and do more computational essays" - @OliviaFVane, Interactive Data Journalist, @TheEconomist
-
Observable
@observablehq
Come listen to @apreshill as she shares key principles for developing happier notebooks on #observableinsight. 😀
👉 hopin.com/events/observable-insight/registration
Observable
@observablehq
If you need to catch up on the notebook talk from @apreshill - here is a link to her slides. Be sure to join for the Q&A! apreshill.github.io/happiest-notebooks-on-earth/
Observable
@observablehq
This notebook framework chart, created by @apreshill, is really handy...
Observable
@observablehq
"A notebook is a data-based creative process that leads you somewhere new and next." Alison Hill, @VoltronData
-
Observable reposted
Irene de la Torre Arenas
@inari_ta
Join us today! The agenda is soo exciting! @mbostock @OliviaFVane @carmen_TM_ @enjalot Alison Hill, @tophtucker, David Kirkby, Sara Quigley, and David Eads.
Observable
@observablehq
🔴 We are LIVE for Day 2 at #observableinsight
🎟️ Sign up here for FREE: hopin.com/events/observable-insight/registration
Come see what your data can show! -
Observable
@observablehq
🤔 Did you know Observable can do THAT? Join our very own Co-Founder @mbostock where he shows what's possible on Observable!
👉 hopin.com/events/observable-insight/registration
#observableinsight
Observable
@observablehq
This presentation was incredibly dense and detailed and the responses to it were amazing - we will be sharing the Pro Tips collection and video so everyone can reference again!
-
Observable
@observablehq
🔴 We are LIVE for Day 2 at #observableinsight
🎟️ Sign up here for FREE: hopin.com/events/observable-insight/registration
Come see what your data can show! -
Observable
@observablehq
✴️ Obeservable Insight Community Conference starting in 30min.
🎟️ Join us here: hopin.com/events/observable-insight
#observableinsight -
Observable reposted
agbales
@agbales
Enjoyed the sharp presentations + Q&A today! Appreciating the range of creative, educational, & journalistic pursuits @observablehq supports. Looking forward to learning more tomorrow!
Observable
@observablehq
👏 Day 1 of #observableinsight is a wrap but we're back tomorrow with more awesome talks.
✴️ Plus, you don't want to miss @mbostock's talk *Observable Can do That?*
👉 hopin.com/events/observable-insight/registration #observableinsight -
Observable reposted
Maya Gans
@Mayacelium
Missed my talk? No worries! Find the slides here: observablehq.com/@mayagans/when-i-use-observable-in-my-da…
Observable
@observablehq
@Mayacelium is up next at #observableinsight - speaking on When I use Observable in a Data Science Workflow: An R and JS Love Story
👉 hopin.com/events/observable-insight -
Observable
@observablehq
@Mayacelium is up next at #observableinsight - speaking on When I use Observable in a Data Science Workflow: An R and JS Love Story
👉 hopin.com/events/observable-insight
Observable
@observablehq
From @Mayacelium's love story: "In Observable I can tweak a graph and solicit feedback right away - if a stakeholder wants a change, I can make it right then. Rinse and repeat."
Observable
@observablehq
"Let R and Observable each do what they do best! Explore what Observable & JS and what they do best, and explore how that fits into other languages and workflows." 🎉
-
Observable
@observablehq
👏 Day 1 of #observableinsight is a wrap but we're back tomorrow with more awesome talks.
✴️ Plus, you don't want to miss @mbostock's talk *Observable Can do That?*
👉 hopin.com/events/observable-insight/registration #observableinsight -
Observable
@observablehq
👁️🗨️ Learn how we work with Observable *at* Observable with our very own: @allison_horst, @mf_viz, @pstuffa, @tekgrrl and @visnup #observableinsight
Join us as they share tips and tricks: hopin.com/events/observable-insight.
Observable
@observablehq
Ready for some epic data wrangling with @mf_viz? Check out this notebook: observablehq.com/@demoteam/wrangling-at-observable
Observable
@observablehq
And @pstuffa also shared some great insights for working with #sql cells & queries, which illicited actual cheers 🎉 from #observableinsight attendees - here is the notebook: observablehq.com/@observablehq/pauls-observable-tips-tricks
-
Observable
@observablehq
Learn what's the future of Observable via Product Roadmap Talk from our CEO and Co-founder @mmeckf #observableinsight
👉 hopin.com/events/observable-insight/registration
Observable
@observablehq
Sneak peek at the future of data work w/ @mmeckf: collaboration across teams is essential, prioritize tool investments where everyone can work together, ensure more trust in analysis, put existing templates to use, code when you need/UI when you don't & freedom to explore
Observable
@observablehq
What's next? Build compelling data apps, collaborate across teams with data, and learn & share with others in the Observable community... because they (you) are the best!
-
Observable
@observablehq
Up next, learn how @sxywu built a creative career with data in fireside chat with our very own @WayneSutton #observableinsight
👉 hopin.com/events/observable-insight/registration
Observable
@observablehq
Discussing her DS journey, @sxywu shares how creating data visualization using personal data (photos) revealed illuminating and hopeful insights 📷🌸
Observable
@observablehq
After using D3 for exploratory data viz, @sxywu shares: "When Observable Plot came out I was like 🤯 done."
Post not available here, view on X
Observable
@observablehq
Advice on getting started with a creative data viz from @sxywu: Find a small curiosity (or try to collect your own little dataset!). Start small. Explore the different tools to find which work for you. Most importantly: get started!
Observable
@observablehq
Inspiring from @sxywu on not having the skills to make the thing you want to make...yet: "There will come a day when I will have the skill I need to create the thing I dreamed of a year ago, 2 years ago, 5 years ago…"
-
Observable reposted
Shirley Wu
@sxywu
I’ll be doing a fireside chat with @waynesutton in an hour, we’ll be talking about making a creative #dataviz career and also how I’ve used @observablehq in my work—which I don’t get to talk about often and am excited to do 💖
Hope to see you there 👀
Observable
@observablehq
🔴 We are LIVE for Day 1 at #observableinsight
🎟️ Sign up here for FREE: hopin.com/events/observable-insight/registration
Come see what your data can show! -
Observable
@observablehq
Here from @stitchfix, Belo and Ridge National Laboratory how they use @Observablehq for work during the Adopting Observable Panel happening now #observableinsight
👉 hopin.com/events/observable-insight/registration
Observable
@observablehq
“Data scientists make stuff, and they want to have impact. When they work in #python or #jupyter, the barriers to exposing what they do are much higher. With Observable it’s just a lot smoother.” - Robert Harris from @StitchFix
Observable
@observablehq
“We wanted to be able to answer our clients’ problems faster. We work with investors and there is always the time sensitivity of market events, so it’s important to be able to go from data acquisition to answers quickly.” - Paulino Oliveira from Belo
Observable
@observablehq
“Our data scientists were using a lot of #jupyter Notebooks and #python but it was hard to share them with executives without first setting up Python for everyone. The Observable community and Plot helped us without investing in the full web stack.” Chad Steed from @ORNL
Observable
@observablehq
“We use Observable to prototype our designs, then eject to our apps. It ended up being a great way to work with our app team and felt very natural because it was all in #javascript.” Chad Steed from @ORNL
Observable
@observablehq
“Transitioning to Observable really unlocked our data scientists to help them better communicate their findings across our organization.” Robert Harris from @StitchFix
Observable
@observablehq
“Observable makes it easier for our engineering team to be more supportive & inclusive of other folks on our wider team. Researchers can collaborate live, and changes can be made quickly in response to the group's needs.” Paulino Oliveira from Belo
-
Observable
@observablehq
Want to learn how to land a job in Data Science? Don't miss @gdequeiroz session on Navigating the Data Science career confusion. Starting now! #observableinsight
👉 hopin.com/events/observable-insight/registrationPost not available here, view on X
Observable
@observablehq
Resources shared by @gdequeiroz for folks looking to get started with tech / DS careers: learn.microsoft.com/en-gb/training/student-hub/?WT.mc_id=…
Observable
@observablehq
Wrapping up this session, @gdequeiroz shares the importance of speedy insights for corporations 🎯💯
-
Observable
@observablehq
🔴 We are LIVE for Day 1 at #observableinsight
🎟️ Sign up here for FREE: hopin.com/events/observable-insight/registration
Come see what your data can show! -
Observable
@observablehq
📣 New @observablehq product update
📊 Create faster with the Add Cell Menu
With Add Cell Menu just click ➕ or type ⌘cmd↩︎return to get started & you now have dozens of building blocks at your fingertips!
See how it works below.
Learn more here ➡️
observablehq.com/@observablehq/adding-cells -
Observable
@observablehq
Our CEO @mmeckf shares her perspective with @TechJournalist on our funding news, lessons learned & the importance of data collaboration.
-
Observable
@observablehq
Observable now integrates with @Microsoft @msexcel Connector and @Office365 & @OneDrive Cloud Files! 🎉 techcommunity.microsoft.com/t5/excel-blog/observable-now-…
-
Observable
@observablehq
Working with data that changes over time is tough. Our team created this amazing resource & is hosting a webinar on 10/21 to discuss the topic. 🕰 observablehq.com/@observablehq/analyzing-time-series-data
Observable
@observablehq
Trying to detect differences between two time-series? Make sure to *visualize the difference* between them. 👁 Suggested #dataviz techniques here: observablehq.com/@observablehq/whats-different-timeseries…
Observable
@observablehq
How can simple charts expose complex patterns in time series data?⏱Join us on an analysis adventure to answer the question: What caused this? 👇observablehq.com/@observablehq/what-caused-this-an-analys…
Observable
@observablehq
If the only feature you have is a date, how can you uncover meaningful patterns? Discover date patterns here 👉observablehq.com/@observablehq/discovering-date-patterns?…
Observable
@observablehq
Time doesn’t always have to be represented by a line. Here are some alternative approaches that may provide better insights.😎observablehq.com/@observablehq/doesnthavetobealine?collec…
-
Observable
@observablehq
We're excited to announce Observable Plot, a new open-source library for faster and easier data exploration on the web! 📈🚀
Plot's concise API and thoughtful defaults are designed for a more joyful visualization process, try out the beta and let us know!
observablehq.com/@observablehq/introducing-observable-plot -
Observable
@observablehq
The #d3js 10 Year Celebration Kick-off event is tomorrow with announcements for the D3 community and reflections on lessons learned from 10 years of #opensource data visualization 🎉
👉 www.meetup.com/D3-Online/events/275893710/
hosted by @enjalot. Speakers include @mbostock @mmeckf @sxywu & More -
Observable
@observablehq
As we continue to reflect on 2020, the Observable team is inspired by the depth of notebooks the community has created. Thank you!
♥️ Today we're sharing a collection of the Top 10 Liked notebooks created by the community in 2020
👀 observablehq.com/@observablehq/-/collection/top-10-liked-…
#dataviz -
Observable
@observablehq
Starting in 1 hr: All About #d3js meetup
Rapid Prototyping with D3 and Observable with
@wattenberger
Teaching Visualization Through D3 with @mf_viz
AMA from D3 creator & our co-founder @mbostock
Updates on Observable from CEO @mmeckf
Join us live 👉
www.crowdcast.io/e/allaboutd3 -
Observable
@observablehq
📢Meetup 8/27: All about D3!
'From Ideation to Interactive Essay with D3' ➡️@wattenberger
'Teaching Visualization Through D3 ' ➡️@mf_viz
Followed up with an AMA from D3 creator & our co-founder @mbostock
+ some updates on Observable from @mmeckf
📆 observablehq.com/@observablehq/meetup -
Observable
@observablehq
📝 Free and open source licenses are a great way to give other people certainty that they’re allowed to reuse and remix your work. Observable now has built-in support for licensing your notebooks!
observablehq.com/@observablehq/licenses -
Observable
@observablehq
The quickest way to see your data in a chart with Observable is with Vega-Lite. In less than 10 lines of code, take the first step to exploring your data visually. observablehq.com/@observablehq/vega-lite
-
Observable
@observablehq
If you use Python and Jupyter, learn how Observable notebooks are different: observablehq.com/@observablehq/observable-for-jupyter-users
-
Observable
@observablehq
It’s here! 🎉 Announcing Observable for Teams: The magic notebook for teams to think, together. Unlimited private notebooks, multiplayer editing, comments and shared secrets.
observablehq.com/teams -
Observable
@observablehq
Observable: The User Manual
beta.observablehq.com/@observablehq/observable-user-manual
We’ve (but let’s be serious, mostly Mike has) written a mountain of reference material over the past year that covers how to effectively realize the notebooks of your dreams
Here it is on 1 page. Bookmark it. Send suggestions -
Observable
@observablehq
Hello, world! 🎉 Announcing Observable notebooks: a better way to code, discover, and communicate. beta.observablehq.com
-
Observable
@observablehq
We are bringing data science from the command line to the web. observablehq.com
-
D3.js reposted
Mike Bostock
@mbostock
Observable Plot 0.6.7 is here 🎉, and with it, our first foray into interactive visualization! I’m so proud of the subtle details that make it shine. What makes it so great? 🧵 github.com/observablehq/plot/blob/main/CHANGELOG.md
-
D3.js reposted
Information is Beautiful Awards
@infobeautyaward
@d3js_org (credited to @mbostock, @jasondavies, @recifs) wins the Test of Time Special Award for the 2022 #iibawards. In the words of the judges, “since its humble beginnings in 2011, d3.js has become inextricable from the data viz world.”
-
D3.js reposted
Tamara Munzner
@tamaramunzner
#ieeevis InfoVis 10 year Test of Time award to D3, by @mbostock @jeffrey_heer & @VOgievetsky
What can I say. More citations than any InfoVis paper ever. More real-world impact than any InfoVis paper ever.
d3.js for the win!!! -
D3.js reposted
Mike Bostock
@mbostock
A new generation of D3 examples, structured as functions of data + options for convenient use and reuse, anywhere. Announcing: D3 Charts! 🎉 observablehq.com/@d3/charts?collection=@d3/charts
-
D3.js
@d3js_org
D3 7.0.2 improves ticks for log scales, and adopts interning for set operations (union, difference, etc.). github.com/d3/d3/releases/tag/v7.0.2
-
D3.js reposted
Mike Bostock
@mbostock
The second release of Observable Plot, 0.2, is now available! Changelog packed with details and examples: github.com/observablehq/plot/blob/main/CHANGELOG.md
-
D3.js reposted
TOoᴼᵒº˙⁰0₀ₒ.·ph
@tophtucker
for work i wrote up ~ten things to know about Plot for someone (me) who only knows d3. through my ignorance of ggplot & Vega-Lite, i experienced the “grammar of graphics” paradigm fresh in Plot, & feel a debt of gratitude and an itch to read the classics observablehq.com/@observablehq/plot-for-d3-users
-
D3.js reposted
Observable
@observablehq
We're excited to announce Observable Plot, a new open-source library for faster and easier data exploration on the web! 📈🚀
Plot's concise API and thoughtful defaults are designed for a more joyful visualization process, try out the beta and let us know!
observablehq.com/@observablehq/introducing-observable-plot -
D3.js reposted
Mike Bostock
@mbostock
Announcing a new open-source JavaScript library for exploratory data visualization: Observable Plot! observablehq.com/@observablehq/plot
-
D3.js reposted
Mike Bostock
@mbostock
Do you have lots of time series (analytics, say) you’d like to visualize? Try horizon charts! They’re space-efficient, and when aligned by time you can see coincident patterns across series. A little library: observablehq.com/@observablehq/timechart
-
D3.js reposted
Mike Bostock
@mbostock
It’s been ten years since I pushed the first release of D3.js to GitHub. Have I learned anything? I hope so… but it’s a journey. observablehq.com/@mbostock/10-years-of-open-source-visual…
-
D3.js reposted
TOoᴼᵒº˙⁰0₀ₒ.·ph
@tophtucker
How D3 Moved Us — On its 10th anniversary, tales of charts escaping Flatland and pushing us around. Feat. @Harry_Stevens @GurmanBhatia @veltman @jodyavirgan @DeniseDSLu @KevinQ @jasondavies and Siân observablehq.com/@tophtucker/how-d3-moved-us
-
D3.js reposted
Observable
@observablehq
The #d3js 10 Year Celebration Kick-off event is tomorrow with announcements for the D3 community and reflections on lessons learned from 10 years of #opensource data visualization 🎉
👉 www.meetup.com/D3-Online/events/275893710/
hosted by @enjalot. Speakers include @mbostock @mmeckf @sxywu & More -
D3.js
@d3js_org
Join us on Feb 17th to celebrate 10 years of #d3js!
We have some exciting announcements for the D3 community and reflections on lessons learned from 10 years of #opensource data visualization 🎉
www.meetup.com/D3-Online/events/275893710/ -
D3.js reposted
Mike Bostock
@mbostock
Observable Inputs is more than basic inputs (sliders, checkboxes, etc.) — it includes fancy inputs for exploring tabular data and is designed to work together with tools such as D3 and Vega-Lite. A quick tour: observablehq.com/@observablehq/hello-inputs
-
D3.js reposted
Mike Bostock
@mbostock
As of d3-array 2.10, d3.group, d3.rollup, and friends now use InternMap internally. Group by dates! Rejoice! 🥳github.com/d3/d3-array/releases/tag/v2.10.0
-
D3.js reposted
Ben Tanen
@ben_tanen
After many months of being intrigued yet afraid of both d3-force and Observable notebooks, I have finally decided to dive in and ended up making a little tutorial.
observablehq.com/@ben-tanen/a-tutorial-to-using-d3-force-… -
D3.js reposted
Shirley Wu
@sxywu
🎊My updated Intro #svg+#d3js course is out @FrontendMasters🥳
Please check it out—I put so much 💖💭⏰ into it & am esp proud of all the small exercises that build up to one big #dataviz by the end🌸✨
🔗frontendmasters.com/courses/d3
📚observablehq.com/@sxywu/introduction-to-svg-and-d3-js made w/ @observablehq -
D3.js
@d3js_org
d3-array now supports set operations: intersection, union, difference, superset, subset, disjoint. observablehq.com/@d3/set-operations
-
D3.js
@d3js_org
Help us learn about your needs and goals with #d3js by filling out our D3 Community Survey! docs.google.com/forms/d/e/1FAIpQLSfsrxaL3O-6SBVodMR7WEgug…
-
D3.js reposted
Observable
@observablehq
Starting in 1 hr: All About #d3js meetup
Rapid Prototyping with D3 and Observable with
@wattenberger
Teaching Visualization Through D3 with @mf_viz
AMA from D3 creator & our co-founder @mbostock
Updates on Observable from CEO @mmeckf
Join us live 👉
www.crowdcast.io/e/allaboutd3 -
D3.js reposted
Mike Bostock
@mbostock
Whew, D3 6.0 is out! Here are the detailed release notes, hot off the press. 😅 github.com/d3/d3/blob/master/CHANGES.md
-
D3.js
@d3js_org
D3 6.0! 🥳 github.com/d3/d3/releases/tag/v6.0.0
-
D3.js reposted
Volodymyr Agafonkin 🇺🇦
@mourner
Happy to see the final release of @d3js_org v6 — one of the highlights, d3-delaunay, is powered by a library I’m very proud of, one of the best pieces of code I’ve ever written github.com/mapbox/delaunator
-
D3.js reposted
Observable
@observablehq
📢Meetup 8/27: All about D3!
'From Ideation to Interactive Essay with D3' ➡️@wattenberger
'Teaching Visualization Through D3 ' ➡️@mf_viz
Followed up with an AMA from D3 creator & our co-founder @mbostock
+ some updates on Observable from @mmeckf
📆 observablehq.com/@observablehq/meetup -
D3.js
@d3js_org
d3-selection 2.0 adds support for iterables and passes events directly to event listeners. observablehq.com/@d3/d3-selection-2-0
-
D3.js
@d3js_org
d3.random 2.2 adds a linear congruential generator for pseudorandom numbers using a configurable seed. (This is used by d3.forceSimulation for deterministic layout.) github.com/d3/d3-random/releases/tag/v2.2.0
-
D3.js
@d3js_org
And in case you missed it, d3-array recently added d3.fsum for full precision summation and d3.cumsum for cumulative summation. github.com/d3/d3-array/releases
-
D3.js
@d3js_org
d3-force 2.1 is out! All built-in forces are now fully deterministic (even for coincident nodes), and you can adjust the strength of the centering force. github.com/d3/d3-force/releases/tag/v2.1.0
-
D3.js reposted
Mike Bostock
@mbostock
Interpolate all the map projections! 🙌 observablehq.com/@d3/projection-transitions
-
D3.js reposted
Observable
@observablehq
📝 Free and open source licenses are a great way to give other people certainty that they’re allowed to reuse and remix your work. Observable now has built-in support for licensing your notebooks!
observablehq.com/@observablehq/licenses -
D3.js reposted
Mike Bostock
@mbostock
This new example visualizes a temporal network: the face-to-face interactions of participants at a two-day conference! observablehq.com/@d3/temporal-force-directed-graph
-
D3.js reposted
Diana MacDonald
@didoesdigital
This month in lock down, I wrote daily about learning data viz with @d3js_org. To mark 30 days, I've shared the resources I used, my learning process, and a reflection on the journey so far:
medium.com/@didoesdigital/learning-data-viz-with-d3-8b54a…
I'm curious to know what you think if you read it 😊
#dataviz -
D3.js reposted
Arvind Satyanarayan
@arvindsatya1
One of my favourite parts of teaching Interactive Data Visualization (#mit6894) is seeing the incredible final projects students produce. We usually celebrate them with a poster session, but we're going online this year: vis.mit.edu/classes/6.894/FP-Showcase. Here're some highlights:
-
D3.js reposted
Fil @ https://bsky.app/profile/fil.rezo.net
@recifs
Porting a few map #projections from #d3js to #glsl
observablehq.com/collection/@fil/projections -
D3.js
@d3js_org
The web has advanced by leaps and bounds since D3 1.0 was released in 2011. D3 has improved, too! It’s time for a new introduction. 📊📈🎉 #d3js
observablehq.com/@d3/learn-d3Post not available here, view on X
D3.js
@d3js_org
We’ve been writing new examples and documentation on @observablehq since last year. But we’re thrilled to finally offer a more comprehensive intro. We want you to help you get the most out of D3, and to help everyone work together!
D3.js
@d3js_org
Our work is never done! Please let us know which topics we should cover next. We hope to expand this introduction in the coming months to cover more of D3. Thanks for your support. 🙏
-
D3.js reposted
Mike Freeman
@mf_viz
There are obviously bigger problems to solve at the moment, but if you're struggling to get a #d3js animation to work in an @observablehq notebook, I put together a quick explanation and example here:
observablehq.com/@mkfreeman/d3-chart-updates-in-observable -
D3.js reposted
Mike Bostock
@mbostock
If you’re wondering how this week’s stock market volatility compares to the last 20 years. (It’s not that bad, yet.) observablehq.com/@d3/calendar-view
-
D3.js
@d3js_org
Let’s Make a Bar Chart, now updated to the latest version of D3! observablehq.com/@d3/lets-make-a-bar-chart
-
D3.js reposted
Mike Bostock
@mbostock
Change in adult obesity by state from 2008 to 2018. observablehq.com/@d3/non-contiguous-cartogram
-
D3.js reposted
Harry Stevens
@Harry_Stevens
Attention web cartographers: Today I'm releasing d3-geo-scale-bar version 1! It's a JavaScript library that makes it easy to add scale bars to your #d3js maps. Here's an introduction and tutorial on @observablehq: observablehq.com/@harrystevens/introducing-d3-geo-scale-bar #cartography
-
D3.js reposted
Mike Bostock
@mbostock
This linear-to-log scale transition is oddly satisfying. (Thanks to @lisacrost for the motivating example!) observablehq.com/@mbostock/new-zealand-tourists-1921-2018
-
D3.js reposted
Mike Bostock
@mbostock
Woo, new D3 gallery! 🎉 See all the new examples on one page! observablehq.com/@d3/gallery
-
D3.js reposted
Kerry Rodden
@kerryrodden
Here's a new rewrite of my #d3js sequences sunburst visualization, using @observablehq. With Observable's file attachments feature, hopefully it should be even easier to reuse the visualization with your own data! observablehq.com/@kerryrodden/sequences-sunburst
-
D3.js reposted
Mike Bostock
@mbostock
A new zoomable treemap example! observablehq.com/@d3/zoomable-treemap
-
D3.js
@d3js_org
d3 5.13.0 includes a few minor improvements. github.com/d3/d3/releases/tag/v5.13.0
-
D3.js
@d3js_org
Choo choo!
🦋 shiffman.lol
@shiffman
Tune in to tomorrow's @thecodingtrain live (Friday, 11/15 4pm ET) to watch me attempt my first d3.js sketch with data artist superstar @sxywu🚂🔢💫 youtu.be/rQroxWLZiCo Choo choo!
-
D3.js reposted
Mike Bostock
@mbostock
I wrote a tutorial on bar chart races! Learn how they work, or fork this notebook to create your own race. observablehq.com/@d3/bar-chart-race-explained
-
D3.js reposted
Mike Bostock
@mbostock
Finally got around to (re-)implementing variable-color edges for hierarchical edge bundling. Still beautiful. 😍 observablehq.com/@d3/hierarchical-edge-bundling/2
-
D3.js reposted
Mike Bostock
@mbostock
Here’s how to render GeoJSON using D3’s curves (such as Catmull–Rom), so you can get nice smooth shapes. observablehq.com/@d3/context-to-curve
-
D3.js
@d3js_org
Observable’s new file attachments makes it much easier to put your data into our examples! Just click to replace the file. observablehq.com/@observablehq/file-attachments
-
D3.js reposted
TWO-N
@2nfo
How's your Thursday? Not nearly enough math, right? We thought so. Check out this visual essay from our lead developer @alecbarrett to make understanding those easing functions a little... easier. observablehq.com/@anbnyc/take-it-ease-y
-
D3.js
@d3js_org
A radial plot of average temperature by day of year at San Francisco International Airport. observablehq.com/@d3/radial-area-chart
-
D3.js reposted
Amelia Wattenberger 🪷
@Wattenberger
Want a birds-eye-view of D3.js?
wattenberger.com/blog/d3
I finally finished my MONGO "blog post" on the different parts of d3, grouped by similar functionality.
I learned a ton of new methods. I hope you find it useful - I bet you'll learn something new even with a quick scan. -
D3.js
@d3js_org
A lil’ component to make it easier to add legends for your color scales. observablehq.com/@d3/color-legend
-
D3.js
@d3js_org
Want to show the Earth from the perspective of space? This’ll help you find the right parameters for the satellite projection. 🌍🛰 observablehq.com/@d3/satellite-explorer
D3.js
@d3js_org
It now auto-scales with altitude. We have lift-off! 🚀
D3.js
@d3js_org
And here’s another by @jeshurunhembd that uses more intuitive spatial and camera parameters! observablehq.com/@jjhembd/tilting-the-satellite
-
D3.js reposted
Fil @ https://bsky.app/profile/fil.rezo.net
@recifs
I have just released d3-tricontour, a #d3js library that creates contours from non-gridded geospatial datasets.
Comes with a collection of examples that you can play with:
observablehq.com/collection/@fil/tricontours -
D3.js
@d3js_org
d3 5.11 adds two new multi-hue color schemes: “turbo” and “cividis”. github.com/d3/d3/releases/tag/v5.11.0
-
D3.js reposted
Mike Bostock
@mbostock
CIELUV and its cylindrical form (commonly known as HCL) are coming to d3-color. observablehq.com/@mbostock/luv-and-hcl
-
D3.js
@d3js_org
d3 5.10! 🎉 github.com/d3/d3/releases/tag/v5.10.0
-
D3.js
@d3js_org
A preview of D3’s easing functions. observablehq.com/@d3/easing-animations
-
D3.js
@d3js_org
Tip: you can set an element’s inline style in one command using selection.property("style", "display: block; color: white; background: steelblue; …").
-
D3.js
@d3js_org
d3-random 2.0 adds binomial, geometric, Pareto and Bernoulli distributions, as well as uniform-random integers. github.com/d3/d3-random/releases/tag/v2.0.0
D3.js
@d3js_org
See our freshly-updated tour of random number generators here: observablehq.com/@d3/d3-random
D3.js
@d3js_org
And here are the probability plots and histograms: observablehq.com/@d3/random-probability-plots
-
D3.js reposted
Ben Welsh
@palewire
I love how I can jump into @observablehq and quickly draft a @d3js_org graphic.
But sometimes the examples require more customization than I'd like.
So here's my first stab a better bubble maker. Pop in a GeoJSON. Pick a data field. Boom. You get a map.
observablehq.com/@datadesk/plug-and-play-bubble-map -
D3.js
@d3js_org
A plot to help you determine if a given distribution is normal. observablehq.com/@d3/normal-quantile-plot
-
D3.js
@d3js_org
A whole bunch o’ bug fixes and improvements in d3-brush 1.1! github.com/d3/d3-brush/releases/tag/v1.1.0
-
D3.js
@d3js_org
d3.autoType (automatic type inference) should be the default behavior when parsing CSV files.
D3.js
@d3js_org
For reference: observablehq.com/@d3/d3-autotype
-
D3.js
@d3js_org
Possibly more than you ever wanted to know about specifying ticks for your axes. observablehq.com/@d3/axis-ticks
-
D3.js reposted
d3.unconf()
@d3unconf
design your own custom animated unconf badge! This Observable notebook from @tonyhschu @Wattenberger and @mbostock makes it straight forward:
observablehq.com/@d3/d3-unconf-badge-builder-template -
D3.js reposted
-
D3.js
@d3js_org
d3-tile 1.0! 🎉 github.com/d3/d3-tile/releases/tag/v1.0.0
-
D3.js
@d3js_org
A map of the world’s time zones. observablehq.com/@mbostock/time-zones
-
D3.js
@d3js_org
zoooOOOoooommmm observablehq.com/@d3/zoomable-map-tiles
-
D3.js
@d3js_org
Here’s how to display web Mercator tiles (and GeoJSON!) using d3-tile and d3-geo. observablehq.com/@d3/web-mercator-tiles
-
D3.js reposted
Chris Henrick | @clhenrick@indieweb.social
@chrislhenrick
I've learned so much from reading the #d3js docs that @recifs has written in @observablehq, I encourage anyone who's interested in learning more D3 and technical parts of #datavis to read them as well. Also thanks for the contribution shoutout Fil!
observablehq.com/@fil/d3-documentation-on-observable -
D3.js
@d3js_org
How d3.packEnclose works: the Matoušek-Sharir-Welzl algorithm. observablehq.com/@d3/d3-packenclose
-
D3.js reposted
Fil @ https://bsky.app/profile/fil.rezo.net
@recifs
I spent quite a few hours writing interactive documentation for #d3js on @observablehq ; it was a lot of fun — and I hope it's going to be useful!
A short report:
observablehq.com/@fil/d3-documentation-on-observable
The documentation:
observablehq.com/@d3
Thank you @d3js_org ! -
D3.js
@d3js_org
Made some improvements to the hierarchical bar chart transitions. Thanks to @duto_guerra for the suggestions! observablehq.com/@d3/hierarchical-bar-chart
-
D3.js reposted
John Alexis Guerra Gómez @johnguerra.bsky.social
@duto_guerra
Hey I made a small @observablehq notebook illustrating how to upgrade a @d3js_org v3 data binding to v4 and v5 observablehq.com/@john-guerra/d3-data-binding-v3-to-v5
-
D3.js
@d3js_org
It’s like MS Paint. observablehq.com/@d3/draw-me
-
D3.js
@d3js_org
Can’t see the forest for the trees? Here’s an introduction to working with hierarchical data with d3-hierarchy. observablehq.com/@d3/d3-hierarchy
-
D3.js
@d3js_org
A quick example of using d3.group or d3.rollup to merge duplicate values in a dataset. observablehq.com/@d3/merging-duplicate-values
-
D3.js
@d3js_org
Did you know that you can use D3’s curves, such as Catmull–Rom splines, to render shapes programmatically? Here’s how. observablehq.com/@d3/curves
-
D3.js reposted
Amelia Wattenberger 🪷
@Wattenberger
making some progress on my "how to learn d3" blog post. I plan on highlighting some of my favorite d3 modules, and showing some groups of similar functionality.
Hopefully this will be a good jumping-off point. 🦘
What are your biggest questions or blockers with learning d3.js? -
D3.js reposted
Mike Bostock
@mbostock
The relative populations of U.S. states, 1790–1990. observablehq.com/@mbostock/u-s-population-by-state-1790-1990
-
D3.js
@d3js_org
CSS multi-column layout is pretty good for categorical legends! observablehq.com/@d3/stacked-area-chart
-
D3.js
@d3js_org
A simple area chart with horizontal panning using overflow: scroll. observablehq.com/@d3/pannable-chart
-
D3.js reposted
Mike Bostock
@mbostock
A nice thing about examples on Observable is that you can diff to highlight what’s relevant (and it’s still live). Like here’s how to add brushing to a scatterplot matrix: observablehq.com/compare/5e4cd7b64408576b@155...4710d9b97…
-
D3.js reposted
Shirley Wu
@sxywu
🥁 ANNOUNCING OUR @D3UNCONF KEYNOTES 🥁
✨ @DataToViz: DataViz Fieldnotes
Lessons from creating #dataviz tools for the community
✨ @defilippovale: Creative Encoding
Why and how do we visualize data?
📅 8/26&27
📍Chicago
🔗www.eventbrite.com/e/visfest-unconf-2019-tickets-62037820792
See you all there 🚀 -
D3.js reposted
Shirley Wu
@sxywu
REGISTRATION IS OPEN!!
To all the regulars and friends, I'm looking forward to our reunion 🥰 and to all that have never been: I'm looking forward to meeting you and welcoming you to our super fun #d3js+#dataviz community 💕
📅 8/26&27
📍Chicago (!!)
🔗www.eventbrite.com/e/visfest-unconf-2019-tickets-62037820792
d3.unconf()
@d3unconf
Have you been waiting with bated breath to register for this year’s unconf!? Well, wait no more! Join us August 26th - 27th in Chicago. Registration now open! visfest.com/unconf2019/
-
D3.js
@d3js_org
A tour of D3’s random number generators. observablehq.com/@d3/d3-random
-
D3.js
@d3js_org
d3.path translates 2D canvas commands into SVG paths, letting you share code between Canvas and SVG. It’s used internally by D3, but you can use it, too. Here’s how: observablehq.com/@d3/d3-path
-
D3.js
@d3js_org
Want to learn d3.group and d3.rollup, the modern replacement for d3.nest for grouping data? 🤨 You know it! 🤓 Start here: observablehq.com/@d3/d3-group-d3-rollup
-
D3.js
@d3js_org
A handy starter notebook for forking and making charts: observablehq.com/@d3/chart-template
-
D3.js
@d3js_org
d3-array 2.1 is out! New: d3.count, d3.minIndex, d3.maxIndex, d3.least, and d3.leastIndex. (Also, d3.histogram is now named d3.bin!) github.com/d3/d3-array/releases/tag/v2.1.0
D3.js
@d3js_org
Here’s an explainer on d3.least. It’s like d3.min, except it returns the foremost element according to a given order rather than the minimum value. observablehq.com/@d3/d3-least
D3.js
@d3js_org
Here’s a ton of examples—and clever tricks—for d3.min, d3.max and friends: observablehq.com/@d3/d3-min-d3-max-d3-extent
-
D3.js
@d3js_org
New d3-array documentation, courtesy of @recifs! First up: d3.cross, to compute Cartesian products (and flatten your nested loops). observablehq.com/@d3/d3-cross
D3.js
@d3js_org
Next: d3.ascending and d3.descending, standard comparators that implement natural order: observablehq.com/@d3/d3-ascending
D3.js
@d3js_org
And lastly: d3.pairs, for pairs of successive elements from an iterable, say to compute rates of change. observablehq.com/@d3/d3-pairs
-
D3.js reposted
Mason Chinkin
@MChinkin
@D3BayArea is excited to host @NadiehBremer, @zanstrong, and @tamaramunzner on May 7 at @appacademyio's SF branch for a discussion on #d3js and #dataviz in academia, industry, and freelance work.
RSVP at www.meetup.com/Bay-Area-d3-User-Group/events/259331432/
Suggest questions to @sxywu and @MChinkin -
D3.js reposted
💥 \newline
@newlinedotco
Let's talk about scales in d3js. The idea with scales is that we're translating a number from one number "space" to another number "space".
For example, imagine we want to plot temperature and show a value between [10°F - 100°F] on a chart...
/🧵 -
D3.js reposted
rachel binx
@rachelbinx
d3 -> SVG -> Sketch cleanup -> Axidraw
current process has a bit of manual cleanup, but here's what the design looks like for more complicated data as an SVG -
D3.js reposted
Matt DesLauriers
@mattdesl
A circle packing sketch inspired by @rachelbinx's recent tweets, using D3 + canvas-sketch.
✨ Live Demo → circle-packing.surge.sh
📦 Code → gist.github.com/mattdesl/444f1c967f31535bc5982012c74c63df
If you see a generation you like, hit "Cmd/Ctrl + S" to export it.
#plottertwitter #generative -
D3.js
@d3js_org
Impressive application of d3-geo-projection to create a gorgeous butterfly wall map! 🦋 Well done, @borism @fabianehmel. interface.fh-potsdam.de/butterfly/
-
D3.js reposted
Harry Stevens
@Harry_Stevens
I'm excited to introduce d3-regression, a JavaScript library that makes it easy to calculate statistical regressions! It does linear, quadratic, exponential, logarithmic, power law, and LOESS regressions. Introduction and tutorial: observablehq.com/@harrystevens/introducing-d3-regression
-
D3.js
@d3js_org
d3.range returns an array of evenly-spaces numbers. observablehq.com/@d3/d3-range
-
D3.js
@d3js_org
d3.merge flattens the specified iterable-of-iterables into a new array. observablehq.com/@d3/d3-merge
-
D3.js
@d3js_org
A chart comparing population distribution by age of states using d3.stackOffsetExpand. observablehq.com/@d3/stacked-normalized-horizontal-bar
-
D3.js
@d3js_org
These Bollinger bands show volatility in the price of Apple stock. observablehq.com/@d3/bollinger-bands
-
D3.js
@d3js_org
A static map with TopoJSON vector geometry and raster map tiles. observablehq.com/@d3/raster-vector
-
D3.js reposted
Mike Bostock
@mbostock
U.S. population by state, 1790-1990. observablehq.com/@d3/animated-treemap
This media couldn't be displayed. See it on the original post. -
D3.js reposted
Mike Bostock
@mbostock
An animated treemap of U.S. population by state, 1790-1990. observablehq.com/@d3/animated-treemap
-
D3.js reposted
-
D3.js
@d3js_org
A bivariate choropleth of diabetes and obesity rates (CDC estimates, 2013). observablehq.com/@d3/bivariate-choropleth
D3.js
@d3js_org
Thanks to @jscarto for the color palette! www.joshuastevens.net/cartography/make-a-bivariate-chorop…
-
D3.js
@d3js_org
Gettin’ fancy with graticule labels on a U.S.-centric stereographic projection. observablehq.com/@d3/graticule-labels-stereographic
-
D3.js
@d3js_org
We have looked at all the map projections. The Peirce quincuncial is the best. observablehq.com/@d3/peirce-quincuncial
-
D3.js
@d3js_org
Visualizing a projection’s distortion using small circles. observablehq.com/@d3/tissots-indicatrix
-
D3.js
@d3js_org
We’re on Observable! observablehq.com/@d3
Observable
@observablehq
It’s here! 🎉 Announcing Observable for Teams: The magic notebook for teams to think, together. Unlimited private notebooks, multiplayer editing, comments and shared secrets.
observablehq.com/teams -
D3.js
@d3js_org
An implementation of parallel sets (parsets) using d3-sankey. observablehq.com/@d3/parallel-sets
-
D3.js reposted
Mike Bostock
@mbostock
Compare any two D3 projections. observablehq.com/@d3/projection-comparison
-
D3.js
@d3js_org
A treemap with a target aspect ratio you can adjust by slider. observablehq.com/@d3/stretched-treemap
-
D3.js
@d3js_org
A demo of d3-tile displaying raster tiles from OpenStreetMap. observablehq.com/@d3/raster-tiles
-
D3.js
@d3js_org
A brief explainer on how to align band scales. observablehq.com/@d3/band-align
-
D3.js reposted
Mike Bostock
@mbostock
Revisiting E.J. Marey’s train schedule. observablehq.com/@mbostock/mareys-trains
-
D3.js reposted
Mike Bostock
@mbostock
Here’s an interactive editor for Sankey (flow) diagrams. observablehq.com/@mbostock/flow-o-matic
-
D3.js
@d3js_org
Our collection of @observablehq notebooks is growing! Fork and try something new. 🍴 observablehq.com/@d3?tab=collections
-
D3.js reposted
Fil @ https://bsky.app/profile/fil.rezo.net
@recifs
So you want to draw ❤️💙💚💛💗💖❤️-shaped maps?
beta.observablehq.com/@fil/cordiform-map-projections
#d3js can help! -
D3.js reposted
Mike Bostock
@mbostock
A new parallel coordinates example. #d3js beta.observablehq.com/@mbostock/d3-parallel-coordinates
-
D3.js reposted
Mike Bostock
@mbostock
number.toLocaleString is pretty great. You might prefer it to d3-format. beta.observablehq.com/@mbostock/number-formatting
-
D3.js reposted
Mike Bostock
@mbostock
Make a sunburst diagram! ☀️ Change the data by editing the live text below the chart. beta.observablehq.com/@mbostock/sunburst-o-matic
-
D3.js reposted
Mike Bostock
@mbostock
Just shipped d3-dsv 1.1 which adds 🥁🥁🥁 automatic type inference (finally!) for numbers, dates, booleans and null. Available in d3 5.9. github.com/d3/d3-dsv/blob/master/README.md
-
D3.js reposted
Mike Bostock
@mbostock
d3 5.8.0 is out, and it’s BIG! 🎉 Adds selection.join, transition.end, and a ton of new scale types and conveniences. github.com/d3/d3/releases/tag/v5.8.0
-
D3.js reposted
Mike Bostock
@mbostock
d3-transition now supports easier sequencing of transitions using promises (await)! beta.observablehq.com/@d3/transition-end
-
D3.js reposted
Mike Bostock
@mbostock
A streamgraph of 2018 box office earnings in the style of @leeb. beta.observablehq.com/@mbostock/2018-box-office
-
D3.js
@d3js_org
Coming soon to d3-selection: shorthand syntax for data joins! beta.observablehq.com/d/6c522dda5dd9daa3
-
D3.js reposted
Mike Bostock
@mbostock
Yes, you should use D3. medium.com/@mbostock/why-you-should-use-d3-ae63c276e958
-
D3.js reposted
@rpgove@vis.social
@rpgove
Announcing d3-force-reuse, a faster @d3js_org plugin for computing force-directed graph layouts! Reduce runtime 10% to 90% by speeding up Barnes-Hut.
Blog: www.twosixlabs.com/faster-force-directed-graph-layouts-by…
Git: github.com/twosixlabs/d3-force-reuse
Paper: osf.io/wgzn5/
Example: bl.ocks.org/rpgove/98820c49a3d7fd0d4d628402536aa60b -
D3.js reposted
Mike Bostock
@mbostock
You can now click ✨ on any of these color schemes 🌈 to copy them to the clipboard. 📋 beta.observablehq.com/@mbostock/d3-color-schemes
-
D3.js reposted
Mike Bostock
@mbostock
Big release of d3-array 2.0. 🎉 New group and rollup methods, quickselect, and support for iterables! beta.observablehq.com/@d3/d3-array-2-0
-
D3.js reposted
Mike Bostock
@mbostock
What can cause cycles in predator–prey 🐈🐁 populations? Let’s use visualization to explore a dynamical system! beta.observablehq.com/@mbostock/predator-and-prey
-
D3.js reposted
Mike Bostock
@mbostock
A little cookbook of recipes for manipulating color using d3-color, d3-interpolate and friends. #d3js beta.observablehq.com/@mbostock/working-with-color
-
D3.js reposted
Mike Bostock
@mbostock
Don’t compare percentage change on a linear scale; use a log scale instead. -50% (0.5×) is as big a change as +100% (2×).
-
D3.js reposted
Mike Bostock
@mbostock
A new and improved zoomable sunburst diagram ☀️ in #d3js! beta.observablehq.com/@mbostock/d3-zoomable-sunburst
-
D3.js reposted
Elijah Meeks
@Elijah_Meeks
Ever look at all the cool #d3js data visualization out there and want to really understand how to do that? My book, D3.js in Action, is half off today. It covers nearly all of D3: basics, networks, maps, custom layouts, even pie charts...
manning.com/dotd -
D3.js reposted
Mike Bostock
@mbostock
D3’s data joins are powerful, but declarative markup is simpler. Good news: joins are optional! beta.observablehq.com/@mbostock/d3-without-joins
-
D3.js reposted
Mike Bostock
@mbostock
D3 5.0 is out! 🎉 Here’s a summary of what’s new: github.com/d3/d3/blob/master/CHANGES.md
-
D3.js reposted
Mike Bostock
@mbostock
Does D3 support the Behrmann map projection? Or Gall–Peters? Smyth/Craster, Trystan Edwards, Hobo–Dyer? Balthasart? (Yes.) beta.observablehq.com/@mbostock/cylindrical-equal-area-pr…
-
D3.js reposted
Mike Bostock
@mbostock
I’m certainly planning on moving my D3 examples there. It’ll be great when the D3 API docs all have links to interactive, editable examples on Observable.
-
D3.js reposted
Observable
@observablehq
Hello, world! 🎉 Announcing Observable notebooks: a better way to code, discover, and communicate. beta.observablehq.com
-
D3.js reposted
Mike Bostock
@mbostock
D3 5.0 prerelease! 🎉 Adds contours, density estimation, ColorBrewer color schemes and adopts Fetch for loading data. github.com/d3/d3/releases/tag/v5.0.0-rc.1
-
D3.js reposted
d3.unconf()
@d3unconf
new #d3js Oakland meetup scheduled! www.meetup.com/Bay-Area-d3-User-Group/events/247211411/ we are hosting a bl.ock party at @greeninfo on 2/13
share your favorite blocks and lets learn from each other! -
D3.js reposted
Mike Bostock
@mbostock
D3 4.12.0! 🎉 #d3js github.com/d3/d3/releases/tag/v4.12.0
-
D3.js
@d3js_org
This is oddly satisfying.
Guillaume Calmettes
@gcalmettes
The globe can now be dragged with inertia effect, and this is all @recifs's fault! #d3js bl.ocks.org/Fil/f48de8e9207799017093a169031adb02
-
D3.js reposted
Mike Freeman
@mf_viz
A tool to add geometric patterns to photos (upload directly from your camera on mobile!). Built with #d3js. mfviz.com/triangulate/
-
D3.js reposted
Adam Pearce
@adamrpearce
New in d3-jetpack: helpers for overlaying canvas, html and svg elements with the same margin and coordinate system
bl.ocks.org/1wheel/f9b9909f10ed0f01780c5338ad38bd50 -
D3.js
@d3js_org
A new course from @bclinkinbeard!
Ben Clinkinbeard
@bclinkinbeard
Want to learn D3.js? d3in5days.com will teach you the core concepts in 5 concise lessons while you build an animated bar chart.
-
D3.js reposted
d3.unconf()
@d3unconf
it's time to signup for d3.unconf(2017) visfest.com/d3unconf-2017/ join 100 other #d3js enthusiasts for 2 days of sharing, learning and making!
-
D3.js reposted
Mike Bostock
@mbostock
d3 4.9.0 is released! 🎉 #d3js
github.com/d3/d3/releases/tag/v4.9.0 -
D3.js reposted
Mike Bostock
@mbostock
Introducing d3.express: the integrated discovery environment. medium.com/@mbostock/a-better-way-to-code-2b1d2876a3a0
-
D3.js reposted
Mike Bostock
@mbostock
D3 4.7 is released! github.com/d3/d3/releases/tag/v4.7.0
-
D3.js reposted
OpenVis Conf
@OpenVisConf
We’re thrilled to announce your 2017 keynote speakers: @d3js_org creator @mbostock & @UpshotNYT editor @amandacox!
-
D3.js reposted
Mike Bostock
@mbostock
d3-geo-projection 1.1! Serialize projected GeoJSON, polyhedral projections, new cli including geo2svg, and more. github.com/d3/d3-geo-projection/releases/tag/v1.1.0
-
D3.js reposted
Mike Bostock
@mbostock
D3 4.3 adds @recifs’s voronoi search, and a handful of d3-geo enhancements! github.com/d3/d3/releases/v4.3.0 #d3js
-
D3.js reposted
Create With Data
@createwithdata
I've started an online book D3 in Depth. Hopefully it'll help in understanding #d3js! d3indepth.com
-
D3.js reposted
Ian Johnson 🔬🤖
@enjalot
this year is going to be awesome! more details coming soon, great venues and great keynotes lined up :D #d3js
d3.unconf()
@d3unconf
save the dates! 10/16 & 10/17 (Sunday & Monday) for TWO days of #d3js unconf & unhack. sign up to hear about tickets us2.list-manage.com/subscribe?u=04caa372ad17a1acb66bdef40…
-
D3.js reposted
Ian Johnson 🔬🤖
@enjalot
great effort to make a client-side #d3js module roller by @_tungs_ github.com/tungs/browser-roller live demo: tungs.github.io/browser-roller/d3Roller.html
-
D3.js reposted
Irene Ros
@ireneros
D3 v4 - what's new?! Slides for my #bostondatavis meetup talk: iros.github.io/d3-v4-whats-new/ props to @mbostock's amazing work and change log.
-
D3.js
@d3js_org
D3 4.2 is out! Adds projection.fitExtent and projection.fitSize. github.com/d3/d3/releases/tag/v4.2.0 bl.ocks.org/mbostock/19ffece0a45434b0eef3cc4f973d1e3d
-
D3.js
@d3js_org
D3 4.1.1 released! github.com/d3/d3/releases/tag/v4.1.1
-
Post not available here, view on X
D3.js
@d3js_org
That’s not d3.geoAlbersUsa. bl.ocks.org/mbostock/4090848
-
D3.js reposted
Nathan Yau
@flowingdata
Shiiiifting income for American jobs flowingdata.com/2016/06/28/distributions-of-annual-income/
-
D3.js reposted
Mike Bostock
@mbostock
After 12+ months and ~4,878 commits, I am excited to announce the release of D3 4.0! github.com/d3/d3/releases/v4.0.0 📊📈🎉 #d3js
-
D3.js reposted
Agence France-Presse
@afpfr
Vous aimez la #dataviz? L'#afp recrute un #dev javascript en CDI à Paris #d3js #job graphics.afp.com/job/
-
D3.js reposted
Mike Bostock
@mbostock
Hold on to your butts! The D3 4.0 development branch is now master. Stable release still 1-2 months away. github.com/d3/d3
-
D3.js reposted
Mike Bostock
@mbostock
Just realized another improvement to circle-packing in d3-hierarchy 0.2.1!
-
D3.js reposted
Chris Price
@100pxls
d3-path - what is it good for? An exploration of the new #d3js svg/canvas path abstraction blog.scottlogic.com/2016/03/10/d3-path-what-is-it-good-fo…
-
D3.js reposted
Mike Bostock
@mbostock
What makes software good? Observations on designing for humans. medium.com/@mbostock/what-makes-software-good-943557f8a488 #d3js
-
D3.js reposted
Mike Bostock
@mbostock
Hot off the press: a new API reference for d3-transition. github.com/d3/d3-transition/blob/master/README.md
-
D3.js reposted
Mike Bostock
@mbostock
As of d3-selection 0.7, selections are immutable! Use selection.merge to combine enter & update after a data-join. github.com/d3/d3-selection
-
D3.js reposted
Ian Johnson 🔬🤖
@enjalot
search more than 11,000 #d3js blocks: blockbuilder.org/search more details on how & why: medium.com/@enjalot/searching-for-examples-2c0f75709c1a
-
D3.js reposted
Mike Bostock
@mbostock
5 years ago today, D3 1.0 was released! (h/t @kerryrodden) github.com/mbostock/d3/releases/v1.0.0
-
D3.js reposted
Mike Bostock
@mbostock
Improving the General Update Pattern in D3 4.0. #d3js bl.ocks.org/mbostock/a8a5baa4c4a470cda598
-
D3.js reposted
Mike Bostock
@mbostock
bl.ocks.org now shows the top 40 blocks, updated hourly!
-
D3.js reposted
Ian Johnson 🔬🤖
@enjalot
How do you learn #d3js? I asked @NadiehBremer @shirleyxywu @tonyhschu @zanstrong and found an interesting pattern medium.com/@enjalot/how-do-you-learn-d3-js-ccffc151419b
-
D3.js reposted
Nadieh Bremer
@NadiehBremer
Now as its own #d3js project: Creating beautiful Spirographs! Adjust them however you want nbremer.github.io/spirograph/
-
D3.js reposted
Jeremy Scott Diamond
@_jsdiamond
A collection of tweet-sized d3 creations t.d3fc.io
-
D3.js reposted
Mike Bostock
@mbostock
Added opacity (rgba, hsla) support to d3-color. Will soon propagate to d3-interpolate (and d3-transition)! github.com/d3/d3-color
-
D3.js
@d3js_org
@danbjoseph Yes. Yes, it will. [citation needed]
-
D3.js reposted
timelyportfolio
@timelyportfolio
great set of notes on #d3js dispatch riceball.com/d/node/1455
-
D3.js reposted
Mike Bostock
@mbostock
D3 3.x: d3.svg.axis().scale(y).orient("left");
D3 4.0: d3.axisLeft(y); -
D3.js reposted
Ian Johnson 🔬🤖
@enjalot
new year new meetups! 2 #d3js bay area meetups coming up in the next two weeks: www.meetup.com/Bay-Area-d3-User-Group/ it's going to be a data-driven year!
-
D3.js reposted
Mike Bostock
@mbostock
A LOT still to come, but if you’re feeling adventurous, there’s now a D3 4.0 alpha release. github.com/mbostock/d3/tree/4
-
D3.js reposted
Mike Bostock
@mbostock
Scales are a small but powerful concept for data visualization. medium.com/@mbostock/introducing-d3-scale-61980c51545f #d3js
-
D3.js
@d3js_org
The new d3-scale is 24KB gzipped (including dependencies like locales and colors). Or smaller with custom Rollup.
-
D3.js
@d3js_org
RIP ordinal.rangeRoundBands, you served us well.
Mike Bostock
@mbostock
Major overhaul of d3-scale! New scale types: continuous, sequential, band, and more. github.com/d3/d3-scale
-
D3.js
@d3js_org
A few variations of the logo, in PNG and SVG: github.com/d3/d3-logo