“the cutting edge of climate science today”—individual event attribution, the specialty for which @FrediOtto and @gjvoldenborgh were recognized in Time, which for the first time is able to draw strong links between climate change and specific weather events.
Geert Jan van Oldenborgh
Geert Jan van Oldenborgh (22 October 1961 – 12 October 2021) was a Dutch climatologist and physicist. Through his career he studied climate modelling of adverse weather events and was known as a pioneer of attribution science, driving public awareness of how climate change is linked to extreme weather events. He was also the creator of a digital platform, Climate Explorer, an online meteorological data repository and platform for climate data analysis. More on Wikipedia
-
Geert Jan van Oldenborgh reposted
Bart Verheggen
@BVerheggen

-
Geert Jan van Oldenborgh reposted
Maarten Keulemans
@mkeulemans
M'n debuut als podcasthost! Ik sprak de zieke, maar razend slimme KNMI-rekenmeester @gjvoldenborgh. www.volkskrant.nl/kijkverder/t/podcasts/serie/ondertussen…
-
Geert Jan van Oldenborgh reposted
Dr Friederike Otto
@FrediOtto
How climate models got so accurate they earned a Nobel Prize & what we can do thanks to them now & that it still means we have to act! @KHayhoe @gjvoldenborgh @MichaelEMann www.nationalgeographic.com/environment/article/how-climat… via @NatGeo
-
Geert Jan van Oldenborgh reposted
Dr Friederike Otto
@FrediOtto
Really nice portrait of me. But WWA is not me, it's @gjvoldenborgh and me & many more. Without Geert Jan it wouldn't exist, if I'm the heart he's the head. www.bloomberg.com/news/features/2021-10-07/how-climate-sc… via @business
-
Geert Jan van Oldenborgh reposted
Prof. Katharine Hayhoe
@KHayhoe
As @leahstokes says, in @allwecansave: “No one can unilaterally choose to live in a low carbon economy. The goal is not self-purification but structural change.”
-
Geert Jan van Oldenborgh reposted
Leo Hickman
@LeoHickman
Extensive interview with @FrediOtto by @DAaronovitch in today's Times Magazine:
"What really got me into this was actually a heatwave in Russia in 2010. It was huge and had a big impact on food prices.”
www.thetimes.co.uk/article/4ff4f54c-1ae4-11ec-8d6d-67649e… -
Geert Jan van Oldenborgh
@gjvoldenborgh
With LOESS you run into problems further from the last point in your dataset, which is often the part you are most interested in. So a ruNning mean does have one advantage over LOESS. The combinations that Paul van der Valk created seem to work well.
Zeke Hausfather
@hausfath
More important question: LOESS or LOWESS
(but on a more serious note, its hard to see any way in which LOESS is worse than a simple moving average as long as you pick an appropriate bandwidth for the dataset) -
Geert Jan van Oldenborgh
@gjvoldenborgh
Somebody at KNMI spent a lot of time thinking up a god solution. cdn.knmi.nl/knmi/pdf/bibliotheek/knmipubTR/TR389.pdf. Is that useful?
Dr. Robert Rohde
@RARohde
I am thinking of switching the long-term trends on Berkeley Earth graphics from a 10-year moving average to a smoother alternative (probably either LOESS or Gaussian-weighted moving mean).
Anyone want to convince me that this is a bad idea or argue for specific alternative? -
Geert Jan van Oldenborgh
@gjvoldenborgh
De oorzaak is nog niet duidelijk. WWA is een analyse begonnen.
-
Geert Jan van Oldenborgh reposted
Dr Luke Harrington
@harrinluke
The science of event attribution helps people understand how climate change affects them right now. But more warming means more extreme events than time in the day to analyse them. @FrediOtto and I discuss the information disparity this inevitably creates theconversation.com/pinpointing-the-role-of-climate-chang…
-
Geert Jan van Oldenborgh
@gjvoldenborgh
Historical runs to 2005, projections start in 2006.
Jarmo Ritola
@jarmoritola
Dear @gjvoldenborgh,
a stupid question if you don't mind: for CMIP5 models in climexp.knmi.nl/selectfield_cmip5.cgi?id=someone@somewhere, what is the year where the use of true CO2 concentration changes to projected concentration? -
Geert Jan van Oldenborgh reposted
Davis Kedrosky
@dkedrosky
Did energy constraints really stop the Dutch from industrializing? A thread: 1/
-
Geert Jan van Oldenborgh reposted
Shannon Waters
@sobittersosweet
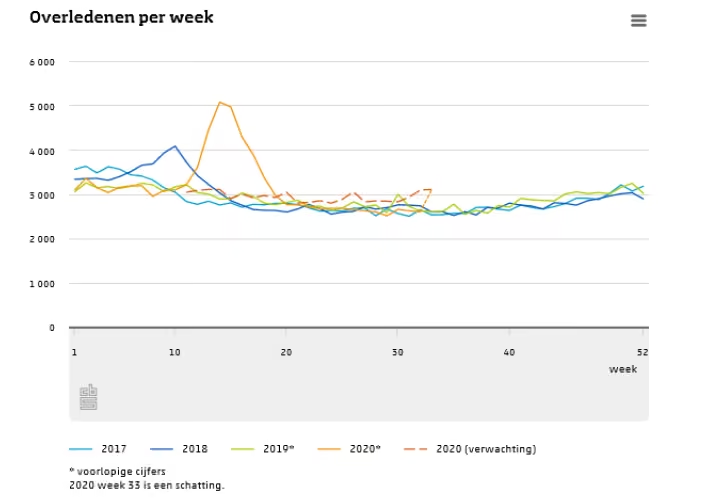
Pretty stark illustration of how deadly the June heat dome was in BC.
It was the deadliest weather event in Canadian history by roughly x3, per Dr. Sarah Henderson, Scientific Director of Environmental Health with @CDCofBC
#bcpoli -
Geert Jan van Oldenborgh
@gjvoldenborgh
I try to follow or interact with people based on the quality of their work. Titles only very partially reflect that. I am only a prof because I am so absent-minded :-). So not sure adding these to my (already very long) name makes sense. But willing to give it a try for a while.
Dr. Robert Rohde
@RARohde
P.P.S. Given that women (and minorities) often need to leverage their credentials in order to be taken seriously, the only question I have is whether it would generally be helpful to them (or not) if more men also show credentials so that doing so isn't so strongly gendered?
-
Geert Jan van Oldenborgh reposted
Prof. Katharine Hayhoe
@KHayhoe
So delighted to see #time100 recognize pioneering scientists @FrediOtto and @gjvoldenborgh for their work on the cutting edge of extreme weather attribution: putting numbers on how much worse climate change made a given hurricane, heatwave or flood. 👏👏👏time.com/collection/100-most-influential-people-2021/6095…
-
Geert Jan van Oldenborgh reposted
KlimaatVerandering
@klimaatVeranda
Het feit dat de grenzen om ons land krapper zijn getrokken dan om veel andere landen kan toch geen reden zijn om onze verantwoordelijkheid af te schuiven?
Te meer daar wij nou niet echt voorop lopen - integendeel. (Plaatje via @mathijsbouman)
-BV -
Geert Jan van Oldenborgh reposted
Climate Centre
@RCClimate
Since start of #covid pandemic, #climate-related disasters have affected 140m people & killed 17,200 - says new analysis by @IFRC & @RCClimate on 'compound impacts of extreme-weather events and Covid'; pic from report, @BDRCS1 monsoon rescues - www.climatecentre.org/6745/ifrc-140-million-people-hit-by…
-
Geert Jan van Oldenborgh
@gjvoldenborgh
The development of WWA from your invitation to join in 2014 to now has exceeded everything I could imagine at the time. @wxrisk www.worldweatherattribution.org
Heidi Cullen
@HeidiCullen
A big congrats to you both and to the entire @wxrisk team!
-
Geert Jan van Oldenborgh
@gjvoldenborgh
The stark consequences of rejecting science and following propaganda, much more direct than in climate change.
Daniel M Kammen
@dan_kammen
Not much more needs to be said than this graph.
@WHCOVIDResponse @Covid19Critical -
Geert Jan van Oldenborgh
@gjvoldenborgh
Always a joy to work with you Fredi. Your dedication to getting accurate results and communicating them clearly makes such a difference. This emphasis on useful and honest science appears to have been successful…
Dr Friederike Otto
@FrediOtto
Thanks @gjvoldenborgh for being so awesome to work with. We’d never have had that #time100 if it wasn’t also so much fun.
-
Geert Jan van Oldenborgh reposted
Richard Black
@_richardblack
So - a glass raised to you, @FrediOtto & @gjvoldenborgh - richly deserved. Largely thanks to your science and your communication of it, no-one can ever again claim with a straight face that 'you can never link extreme weather to climate change'
-
Geert Jan van Oldenborgh reposted
Dr Friederike Otto
@FrediOtto
10 years after my PhD I'll finally be a proper academic! Looking very much forward to joining @Grantham_IC @ImperialCollege (& not having to worry about my contract ending soon) www.imperial.ac.uk/news/229993/climate-scientist-time100-…
-
Geert Jan van Oldenborgh reposted
Dr Friederike Otto
@FrediOtto
@gjvoldenborgh & myself are on the 2021 #time100 list: time.com/collection/100-most-influential-people-2021/. Wow. Not sure I can quite believe that but it's fantastic to see that science & in particular climate science is seen to be influential. Always hoped @wxrisk actually makes a difference.
-
Geert Jan van Oldenborgh
@gjvoldenborgh
Absolutely stunned to find @FrediOtto & myself on the list of 100 most influential people of the year. We never aimed to be influential, just give scientifically defensible answers to questions how climate change influences extreme weather. www.time.com/time100 @wxrisk @KNMI
-
Geert Jan van Oldenborgh
@gjvoldenborgh
The weight of evidence is increasing. (stolen from Kasper Plattner.)
Tim Osborn
@TimOsbornClim
I’ll need to update my timeseries soon
-
Geert Jan van Oldenborgh reposted
CHAMNHA
@CHAMNHA1
Interview with Dr Kiswendsida Guigma, Red Cross Red Crescent Climate Centre, on heatwaves in the West African Sahel
www.enbel-project.eu/news-page/heatwaves-in-africa?s=09
@ENBEL_H2020 -
Geert Jan van Oldenborgh reposted
Zeke Hausfather
@hausfath
At the same time, the world is not on track today to reduce emissions rapidly enough to meet the Paris Agreement goal of limiting warming to well-below 2ºC. The world is currently on track for a central estimate of just under 3ºC warming by 2100 under policies in place today.
-
Geert Jan van Oldenborgh reposted
Dr Friederike Otto
@FrediOtto
African extreme events are being forgotten again! Really important piece by @daisydunnesci with @harrinluke & @vanessa_vash edition.independent.co.uk/edition/uk.co.independent.issue…
-
Geert Jan van Oldenborgh
@gjvoldenborgh
You can view my presentation as an MP4 movie at www.dropbox.com/s/lco0lm2a8ydpfvj/EMS2021_climate_explore…
Geert Jan van Oldenborgh
@gjvoldenborgh
I give a presentation about it tomorrow 8 September at 14:05 CEST at the (virtual) EMS.
Geert Jan van Oldenborgh
@gjvoldenborgh
Just received the EMS Technology Award for the Climate Explorer (climexp.knmi.nl). Very happy that even after 20 years it is still considered a very useful resource for many researchers, students and professionals involved with climate. Of course I use it myself every day
-
Geert Jan van Oldenborgh
@gjvoldenborgh
I give a presentation about it tomorrow 8 September at 14:05 CEST at the (virtual) EMS.
Geert Jan van Oldenborgh
@gjvoldenborgh
Just received the EMS Technology Award for the Climate Explorer (climexp.knmi.nl). Very happy that even after 20 years it is still considered a very useful resource for many researchers, students and professionals involved with climate. Of course I use it myself every day
-
Geert Jan van Oldenborgh
@gjvoldenborgh
Just received the EMS Technology Award for the Climate Explorer (climexp.knmi.nl). Very happy that even after 20 years it is still considered a very useful resource for many researchers, students and professionals involved with climate. Of course I use it myself every day
-
Geert Jan van Oldenborgh reposted
Ed Hawkins
@ed_hawkins
Indicators of our changing climate
-
Geert Jan van Oldenborgh reposted
Rolf Schuttenhelm
@RolfSchuttenh
Economische schade klimaatrampen is 7x zo groot als jaren 70, maar aantal doden 60% afgenomen. Mooi, waarschuwen werkt. Maar geen reden om sweeping conclusies te trekken over vermogen #adaptatie, zeggen adaptatie-experts @Lijnonline, @mkvaalst & @rjtklein:
www.nu.nl/klimaat/6154809/meer-schade-maar-minder-doden-k… -
Geert Jan van Oldenborgh reposted
Brian Kahn
@blkahn
Our infrastructure is not ready for climate change, a thread from tonight. 28th St. subway station
-
Geert Jan van Oldenborgh
@gjvoldenborgh
Personal update; getting stronger again after the devastating attack of the last chemotherapy on my bone marrow. Waiting for a plan to get the new treatments that are expected in phase I/II trials this autumn.
-
Geert Jan van Oldenborgh
@gjvoldenborgh
First look at T2m in August. Cooler than normal in my part of the world, warmer in the eastern Mediterranean and Middle East, in Asia, eastern Canada, Greenland and North Australia. Antarctica is always very variable in winter. Source: ECMWF analyses and forecast compared to ERA5
-
Geert Jan van Oldenborgh reposted
Zeke Hausfather
@hausfath
It seems like we've recently crossed a perceptual climate tipping point, with climate-driven extremes like heat waves, wildfires, and torrential rains impossible to ignore. We used to think it was mainly a problem for our children; we are starting to realize its a problem for us.
-
Geert Jan van Oldenborgh
@gjvoldenborgh
Plot of te day: rank of 2021 Tmax now that the peak of summer has passed for most NH land areas. A lot more records than last month: in and around the Mediterranean, on Greenland and the sea next to Japan. Quite a summer.
-
Geert Jan van Oldenborgh
@gjvoldenborgh
Excellent write-up of our attribution study into the floods in Germany and Belgium at Ars Technica (as usual). arstechnica.com/science/2021/08/europes-july-floods-so-ra…
-
Geert Jan van Oldenborgh reposted
Prof Sonia I. Seneviratne
@SISeneviratne
New @wxrisk study shows that heavy rainfall similar to those causing floods in Western Europe this summer were made more likely by human-induced climate change, i.e. past greenhouse gas emissions. www.worldweatherattribution.org/heavy-rainfall-which-led-… @gjvoldenborgh @mkvaalst @RobertVautard @DWD_klima
Dr Friederike Otto
@FrediOtto
New @wxrisk study: heavy rainfall causing severed floods in Western Europe this summer made a lot more likely by climate change. www.worldweatherattribution.org/heavy-rainfall-which-led-…
-
Geert Jan van Oldenborgh reposted
Dr Friederike Otto
@FrediOtto
New @wxrisk study: heavy rainfall causing severed floods in Western Europe this summer made a lot more likely by climate change. www.worldweatherattribution.org/heavy-rainfall-which-led-…
-
Geert Jan van Oldenborgh
@gjvoldenborgh
I am sorry, but I am in hospital due to severe side effects of my cancer treatment. It is not sure whether I will recover or die. No time for science.
LiverpoolUni Weather
@livuniwx
-
Geert Jan van Oldenborgh
@gjvoldenborgh
most heat waves are in specific months though, May-July in NH Monsoon areas, June-August in NH midlatitudes, later above / near oceans with big heat capacity. Six months offset for SH. See plot for average date of hottest afternoon of the year in NH midlatitudes.
Kai Petzke
@KaiPetzke
2021 has only finished 7 of 12 months so far, so only 7/12 * 1/71 of the area should be colored in dark red.
-
Geert Jan van Oldenborgh
@gjvoldenborgh
Nee, hetanalyse + analyse, DUs een optimale combinatie van waarnemingen en een weer model.
Leon Abels
@abeltjeRdam
Wat opvalt is de "baan" tussen 30S en 60S. Zijn dit satellietmetingen?
-
Geert Jan van Oldenborgh
@gjvoldenborgh
Updated map where maximum temperatures broke records in 2021 so far, including a one-week forecast. Dark red: record hot, next second place etc. The heat in Greece and Turkey is in the forecast so not very certain. ERA5 up to June, ECMWF analyses snd forecast after that.
-
Geert Jan van Oldenborgh
@gjvoldenborgh
Het was er kennelijk niet abnormaal koud, dit is vergeleken met normaal (1991-2021 gemiddelde). Winters zijn koud daar.
Het weer
@weer
Antarctica was toch echt erg koud de afgelopen maand. Waarom is dat niet terug te zien?
-
Geert Jan van Oldenborgh
@gjvoldenborgh
Winter variability around Antarctica is huge.
Mark Muetzelfeldt
@markmuetz
Whoa, what was going on near Antarctica?
-
Geert Jan van Oldenborgh
@gjvoldenborgh
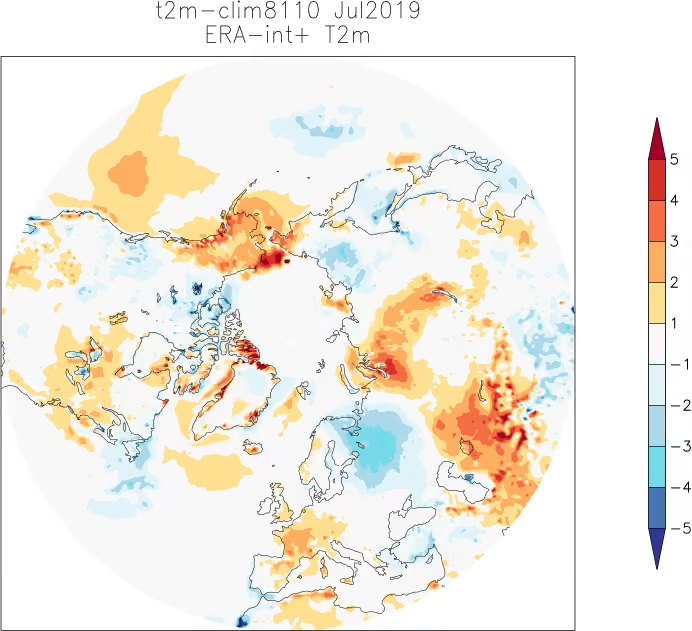
First look at July temperature anomalies. (ECMWF analyses compared to ERA5.)
-
Geert Jan van Oldenborgh
@gjvoldenborgh
Congratulations!
Prof Sonia I. Seneviratne
@SISeneviratne
The 1st approved full subsection of the @IPCC_CH #ar6 was on observed changes in weather & climate extremes and their attribution. Great team effort! @FrediOtto @JuneYiLee1 @rpallanuk @AlexRuane @carovera_ar @connorsSL @anna_pirani P.Arias X. Zhang & co-chairs @valmasdel & P.Zhai
-
Geert Jan van Oldenborgh reposted
Dr Friederike Otto
@FrediOtto
Yesss!! A very important & beautiful figure. Can't wait to share! @SISeneviratne @ed_hawkins
-
Geert Jan van Oldenborgh
@gjvoldenborgh
"Edelachtbare, ik ben onschuldig! De vorige tien vrouwen in het dorp zijn een natuurlijke dood gestorven, dus ik kan haar niet vermoord hebben!"
Adriaan Pek
@Pekadria
Dus al die warme periodes in de geschiedenis hadden helemaal niets met de mens op aarde van doen, alleen nu ineens wel?
-
Geert Jan van Oldenborgh reposted
Erich Fischer
@erichfischer
Why was Pacific Northwest heat off the charts? Recent research offers clues.
www.nytimes.com/2021/07/26/us/united-states-heat-wave.html -
Geert Jan van Oldenborgh reposted
Erich Fischer
@erichfischer
1/n Prepare for the unthinkable.
Our new @NatureClimate study with @Knutti_ETH and @ssippel87 shows that the coming decades will bring more record heat that literally shatters existing temperature records like in the Pacific NW www.nature.com/articles/s41558-021-01092-9 -
Geert Jan van Oldenborgh reposted
Zeke Hausfather
@hausfath
Summer 2021 has seen record heat waves (and the hottest June on record over land regions), as well as extreme flooding. In our Q2 2021 State of the Climate update, we look back at the first six months of the year and what the next six months may hold: www.carbonbrief.org/state-of-the-climate-2021-sees-widesp…
-
Geert Jan van Oldenborgh
@gjvoldenborgh
Yes, it is only the one (official CMA?) station in the GHCN-D database. Other stations will be closer to the peak.
Rolf Schuttenhelm
@RolfSchuttenh
But what we see here are 24h sum figures, right? I've seen threefold claims for July 20th (24h sum, >600mm).
-
Geert Jan van Oldenborgh
@gjvoldenborgh
No idea yet. I am updating my station data (GHCN-D) to have a closer look, one sec. Although the Zhengzhou station may well have missed the peak and the values quoted are from other networks. You'll need to ask local experts.
Rolf Schuttenhelm
@RolfSchuttenh
Thank you Geert Jan! Indeed, highly localised. But also (much) lower. So... what are your thoughts on these 200mm/h & >600mm/24h figures? Possible (so all models underestimating), or unlikely? Thank you!
Geert Jan van Oldenborgh
@gjvoldenborgh
Here some station data plots for ZhengZhou from GHCN-D, just downloaded. They had similar rainfall in 1978 and 1984, so not very uncommon.
-
Geert Jan van Oldenborgh
@gjvoldenborgh
Good commentary. Quoting our study extensively. @FrediOtto @RobertVautard @KNMI @kristie_ebi @SISeneviratne www.washingtonpost.com/opinions/2021/07/22/we-are-fiddlin…
-
Geert Jan van Oldenborgh reposted
Dr Friederike Otto
@FrediOtto
Everyone needs to watch this & understand what it means. Heatwaves kill & climate change makes them orders of magnitude more likely. Featuring @wxrisk at the start.
-
Geert Jan van Oldenborgh
@gjvoldenborgh
We used pooling in our analyses of US Gulf Coast extreme precipitation (Louisiana 2016 and Harvey 2017), which is homogeneous enough for ~10 spatial degrees of freedom. Not sure we can do that here though, the orography of the German flood area seems pretty unique. Working on it.
Chris Parker
@HyperHydr0
Essentially yes. Also used for rainfall. TBH I don't know if WWA uses pooling methods in it's analysis. For temp I expect they don't need to. For rainfall it might improve estimates. WWA have published a full methods paper I believe.
@gjvoldenborgh -
Geert Jan van Oldenborgh reposted
Frank Kaspar
@frakaspar
Report of @DWD_klima provides information on the recent heavy precipitation events in parts of Germany & neighbouring countries (12. - 15. July 2021). Link: www.dwd.de/DE/leistungen/besondereereignisse/niederschlag… (in German). Some figures in the thread👇: @gjvoldenborgh @wxrisk @FrediOtto @JPvanYpersele
DWD Klima und Umwelt
@DWD_klima
Bericht zur "Hydro-klimatologischen Einordnung der Stark- und Dauerniederschläge in Teilen Deutschlands im Zusammenhang mit dem Tiefdruckgebiet „Bernd“ vom 12. bis 19. Juli 2021" (Wetterlage, Niederschlagswerte, Einordnung, Situation in Nachbarländern): www.dwd.de/DE/leistungen/besondereereignisse/niederschlag…
-
Geert Jan van Oldenborgh
@gjvoldenborgh
We do science, not propaganda, and also report negative reports. Some studies gave "no influence (drought in East Africa, Elbe floods, some "negative influence" (cold waves). Just Google our previous studies, also all collected at www.worldweatherattribution.org (currently off-line).
-
Geert Jan van Oldenborgh
@gjvoldenborgh
Zeder & Fischer, WACE, 2020, doi.org/10.1016/j.wace.2020.100266
I suspect a big driver is the development of more high pressure over Central Europe, see attached trend plot. Possibly due to the AMOC decline (doi.org/10.1088/1748-9326/10/9/094007) or the drying Mediterranean (doi.org/10.1029/2008GL036617).
Hugo First
@hugof1rst
Interesting Graphs, whats the source? Q: as the climate def for extreme precip (>30mm/d) is an absolute number one would expect a nonsig change in lowlands to appear as a sig change in Mtn areas, especially in DJF what would explain the maritime/conti boundary. Right Geert?
-
Geert Jan van Oldenborgh
@gjvoldenborgh
This is the winter NAO, I was discussing the Summer NAO that has a completely different pattern. Unfortunate naming maybe.
John Dodders
@Dodders75
Hmmm thanks not convinced. The NAO is a natural cycle, currently towards the end of a positive phase, much like the AMO. I don't see the man-made CO2 link.
-
Geert Jan van Oldenborgh
@gjvoldenborgh
I'd love to, but WWA is a small unfunded band of scientists already stretched with the Belgium / German floods as IPCC takes up a few key people. If there are volunteers to do this following our protocol (Philip et al, 2020, doi.org/10.5194/ascmo-6-177-2020) I can offer help but no more.
Mark Muetzelfeldt
@markmuetz
In a similar vein, do you have any plans to investigate the extreme rainfall over China/Zhengzhou? There is some interest in attribution studies of this event (x.com/leohickman/status/1418158907856404488) and it seems like its severity means it could be a good candidate for study.
Geert Jan van Oldenborgh
@gjvoldenborgh
Yes, we are going ahead, lead by the @DWD_klima It will take a bit longer than previous studies as we want to take the new convection-permitting model results into account. I am also very curious what’ll come out.
Dana Nuccitelli
@dana1981
Thanks @gjvoldenborgh. Has your team decided if you’ll do a rapid attribution study on the Germany et al. floods? I and many others would be very interested in the results
-
Geert Jan van Oldenborgh
@gjvoldenborgh
This is simply not true. The published literature and maps show very clearly that there are regions with zero trends and regions with high trends. Climate is more complicated than the straw-man statement you set up. That is why we take the effort to really analyse the events.
The Honest Broker
@RogerPielkeJr
There is no doubt that attribution claims have run far out ahead of detection of trends
"Since 1951, the number of heavy rainfall days per year for the whole of Germany has hardly changed, almost independently of their definition"
www.mdpi.com/2073-4441/12/7/1950/htm
HT @AndrewSiffert -
Geert Jan van Oldenborgh
@gjvoldenborgh
Lees onze methodes er op na, bv www.knmi.nl/over-het-knmi/nieuws/snelle-duiding-van-extre… en de onderliggende wetenschappelijke artikelen.
Leon Abels
@abeltjeRdam
Zomaar een gedachte. De optie dat er geen causaal verband is wordt ook overwogen?
-
Geert Jan van Oldenborgh
@gjvoldenborgh
When I was young I once showed there was a (non-significant) peak at exactly 4 years in February rainfall sums at De Bilt (not in averages).
There are so many other things to worry about, like city park temperature stations and lawn sprinkling schedules :-). (I never use those) -
Geert Jan van Oldenborgh
@gjvoldenborgh
We are aiming for mid-August, but no guarantees at this point because of the novel models. (Trusted old protocol though.) We have assembled a team of world-class scientists to do the analysis, that will help a lot.
Dana Nuccitelli
@dana1981
Great! Any sense how much longer?
-
Geert Jan van Oldenborgh
@gjvoldenborgh
Yes, we are going ahead, lead by the @DWD_klima It will take a bit longer than previous studies as we want to take the new convection-permitting model results into account. I am also very curious what’ll come out.
Dana Nuccitelli
@dana1981
Thanks @gjvoldenborgh. Has your team decided if you’ll do a rapid attribution study on the Germany et al. floods? I and many others would be very interested in the results
-
Geert Jan van Oldenborgh
@gjvoldenborgh
I assume you never watch the weather forecast. Same models.
Ivan Atanasoff
@metaBollocks
Rubbish I N - rubbish O U T
The future of delusional modelling (!!)
Geert Jan van Oldenborgh
@gjvoldenborgh
Yes, WWA is doing a rapid attribution study for the heavy precipitation and floods in Germany, Belgium and the Netherlands. Results are expected mid-August. Using the newest models so a bit slower than usual. @DWD_klima is leading. @wxrisk @FrediOtto @RobertVautard @KNMI
-
Geert Jan van Oldenborgh
@gjvoldenborgh
Of course. We always do.
Leon Simons 🌍
@LeonSimons8
Will this phase of the study already take into account aerosol mitigation?
Regional SOx emissions from shipping have been reduced ~90% in the past 10 years.
And before that, this study shows an all-sky solar brightening of ~4W/m² dec (1990-2005):
doi.org/10.1002/2013GL058715 -
Geert Jan van Oldenborgh
@gjvoldenborgh
Very clear reporting on the increasing occurrence and dangers of heat waves by @dana1981 yaleclimateconnections.org/2021/07/as-scientists-have-lon…
-
Geert Jan van Oldenborgh reposted
KNMI
@KNMI
KNMI gaat onderzoeken wat het verband is tussen #klimaatverandering en de hevige #regenval en #overstromingen in Limburg, Ardennen en Eifel. Dit is een samenwerking met @wxrisk en experts van de betrokken landen en experts op gebied van extreme regenval. www.knmi.nl/over-het-knmi/nieuws/onderzoek-naar-hevige-ov…
-
Geert Jan van Oldenborgh
@gjvoldenborgh
Het KNMI gaat onderzoeken wat het verband is tussen klimaatverandering en de hevige regenval en overstromingen in Duitsland, België en Nederland.We doen dit samen met een vast internationaal team van wetenschappers (WWA) en externe experts @KNMI @DWD_klima www.knmi.nl/over-het-knmi/nieuws/onderzoek-naar-hevige-ov…
-
Geert Jan van Oldenborgh
@gjvoldenborgh
Yes, WWA is doing a rapid attribution study for the heavy precipitation and floods in Germany, Belgium and the Netherlands. Results are expected mid-August. Using the newest models so a bit slower than usual. @DWD_klima is leading. @wxrisk @FrediOtto @RobertVautard @KNMI
-
Geert Jan van Oldenborgh reposted
Pieter Groenemeijer 🇪🇺💙💛
@pgroenemeijer
In short:
1: The forecast user must receive the information
2: The forecast user must understand the information
3: The forecast user must know what to do with the information
4: The forecast user must believe the information
5: The forecast user must take effective action
(3/4) -
Geert Jan van Oldenborgh
@gjvoldenborgh
In het algemeen goede argumenten (hoewel ik geen effect van de Arctic amplification kan vinden), maar lokaal kunnen de afwijkingen groot zijn. In Nederland nemen zomerbuien heel sterk toe, maar voor de Elbe konden we geen toename door klimaatverandering vinden. Aan het werk dus.
-
Geert Jan van Oldenborgh reposted
DWD Klima und Umwelt
@DWD_klima
Wer sich für die wissenschaftlichen Hintergründe und aktuellen Herausforderungen in der "#attributionsforschung" interessiert, finden dazu hier einige Details: link.springer.com/article/10.1007/s10584-021-03071-7 (aus Sicht von Forscher*innen, die international in diesem Bereich tätig sind). @gjvoldenborgh
-
Geert Jan van Oldenborgh
@gjvoldenborgh
Yes, heat waves and extreme precipitation extremes pose challenges to model as trends in their extremes are often incompatible with observed trends. However, in my experience these can only be solved by human analysis where the discrepancies come from instead of bigger computers.
Geert Jan van Oldenborgh
@gjvoldenborgh
Although of course high-resolution convective-permitting models simulate summer showers much better than parametrised hydrostatic models. When done well. For heat waves I suspect the land model could be more important, although the mixed layer resolution can also play a role.
-
Geert Jan van Oldenborgh reposted
Maarten van Aalst
@mkvaalst
Hot on the heels of record heat in the US and Canada now record floods in Europe. Both fit a pattern of rising risks and more likely surprises.
news.trust.org/item/20210716170026-viwbq -
Geert Jan van Oldenborgh
@gjvoldenborgh
Uiteraard.
Pol Knops
@GreenOlivine
Samen met de Belgen?
x.com/JornVelde/status/1415699926152007685 -
Geert Jan van Oldenborgh
@gjvoldenborgh
Which event? We are considering the extreme precipitation and floods in Germany, Belgium & the Netherlands.
Bernadette Woods Placky
@BernWoodsPlacky
So the question is...will you be doing an attribution study on this event?
-
Geert Jan van Oldenborgh
@gjvoldenborgh
Very clear reporting on how we do Extreme Event Attribution, eg in the World Weather Attribution collaboration, on news.trust.org/item/20210716170026-viwbq/
-
Geert Jan van Oldenborgh
@gjvoldenborgh
Good interview with my colleague @FrediOtto on CNN. edition.cnn.com/videos/tv/2021/07/16/amanpour-climate-cha…
-
Geert Jan van Oldenborgh
@gjvoldenborgh
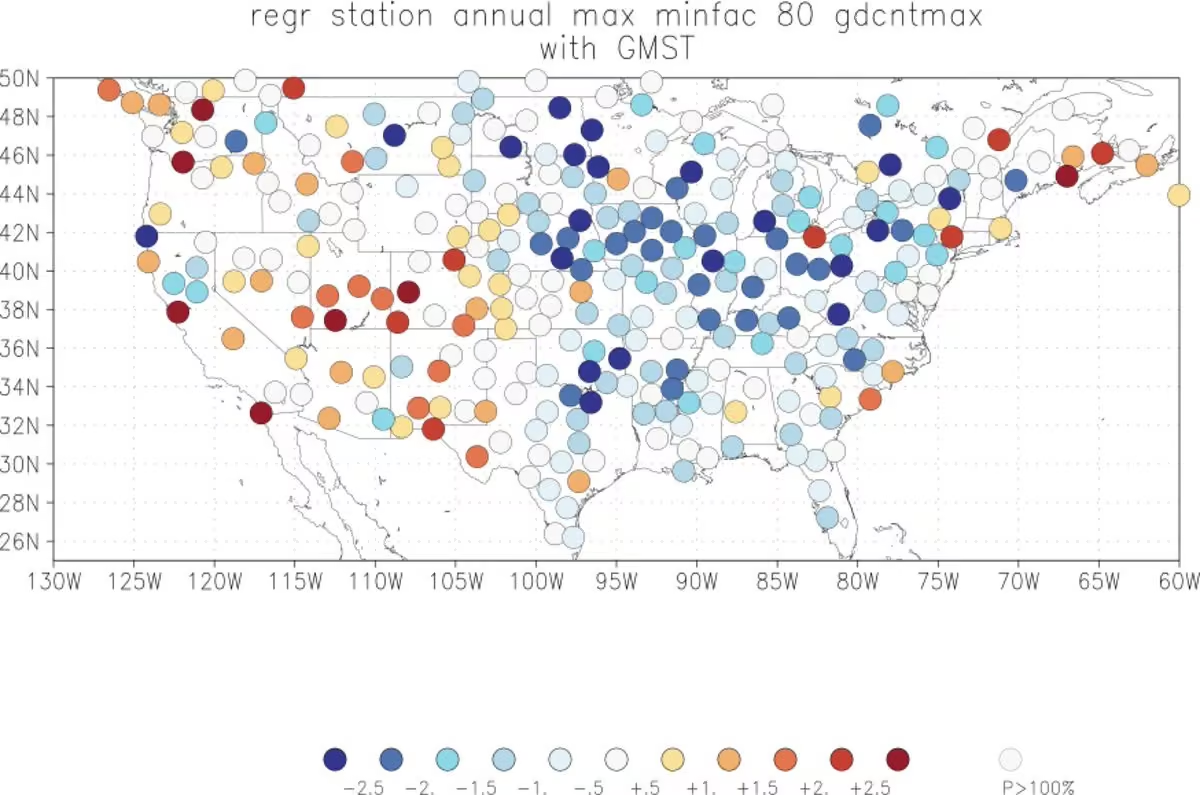
Those are the region were factors affecting heat waves that cause cooling trends that are larger than the warming trend from climate change. In eastern North America these are changes in agricultural practices (no more dust bowl) and the effects of increasing irrigation upstream.
Israel Ramirez
@IsraelR89600312
I don't understand the color coding on the chart. Does blue mean that max temperature has fallen?
-
Geert Jan van Oldenborgh
@gjvoldenborgh
It looks like we may be able to do it. Monday we decide.
zerobuoyancy
@zerobuoyancy
"Attribution will be difficult" aldus een NL expert die betwijfelt of het verband wetenschappelijk aan te tonen is (of het er consistent mee is is een andere vraag).
Geert Jan van Oldenborgh
@gjvoldenborgh
Extreme rainfall in the southern Netherlands, Belgium and Germany. Attribution will be difficult as we do not yet have long runs with convection permitting models and the observations are difficult. However, it is clear that warming increases the severity of those kinds of events
Météo Express
@MeteoExpress
🌧 Terribles images montrant l'ampleur dramatique des inondations à Theux en province de Liège en Belgique. Il va encore pleuvoir toute la nuit. (© Christelle Jeanpierre)
-
Geert Jan van Oldenborgh
@gjvoldenborgh
E-OBS en "ERA5" hebben het event al op de Climate Explorer climexp.knmi.nl. Klik op "Daily fields" selecteer het veld, en dan bijna onderaan de link "extended version" volgen. Ik heb de ECMWF analyses aan ERA5 geplakt om hem tot gisteren volledig te maken. Succes!
Patrick Bogaart
@pwbogaart
En dit zit dus al in ERA5? Ik was namelijk wel geïnteresseerd in de analyse van totale neerslagvolumes over vergelijkbare oppervlaktes.
-
Geert Jan van Oldenborgh
@gjvoldenborgh
We zijn binnen WWA aan het onderzoeken of we het aankunnen. Maandag formele beslissing.
Marc Konijn
@Marckonijn
Is er al iemand binnen het @knmi aan de bak om die waanzinnige hoeveelheid neerslag in DLD, B en NL te duiden - zoals @gjvoldenborgh dat laatst op weergaloze wijze deed over de hittegolf in Canada?
-
Geert Jan van Oldenborgh
@gjvoldenborgh
I also have daily GPM/IMERG data up-to-date in the Climate Explorer, climexp.knmi.nl under "daily fields". I often find they are not very accurate compared to station data but give a good qualitative impression very quickly and everywhere.
dr. Jos PhD
@weerrecords
Maybe this webportal can be/become suitable (Integrated Multi-satellitE Retrievals for GPM (IMERG) - real time version): sigma.cptec.inpe.br/scope/
-
Geert Jan van Oldenborgh
@gjvoldenborgh
It looks like we may be able to do it. Stay tuned.
zerobuoyancy
@zerobuoyancy
"Attribution will be difficult" aldus een NL expert die betwijfelt of het verband wetenschappelijk aan te tonen is (of het er consistent mee is is een andere vraag).
Geert Jan van Oldenborgh
@gjvoldenborgh
Extreme rainfall in the southern Netherlands, Belgium and Germany. Attribution will be difficult as we do not yet have long runs with convection permitting models and the observations are difficult. However, it is clear that warming increases the severity of those kinds of events
Météo Express
@MeteoExpress
🌧 Terribles images montrant l'ampleur dramatique des inondations à Theux en province de Liège en Belgique. Il va encore pleuvoir toute la nuit. (© Christelle Jeanpierre)
-
Geert Jan van Oldenborgh
@gjvoldenborgh
Here a similar map for 50 years of data since 1900, this shows the same patterns in rich countries but no data in the rest of the world.
-
Geert Jan van Oldenborgh
@gjvoldenborgh
In ieder geval veel waarschijnlijker gemaakt door klimaatverandering. Minstens een factor 150 in NW Amerika, voor de regen hebben we nog geen getal. We onderzoeken nog of de onwaarschijnlijkheid in het huidige klimaat extreme pech was of deze extremen systematisch vaker voorkomen
-
Geert Jan van Oldenborgh reposted
Peter Thorne
@climpeter
And that makes sense in terms of the basic physics. For every degree the air warms it can carry 7% more moisture (yes that’s an exponential growth just like r and COVID folks) and extreme precipitation scales similarly. Extreme precipitation has increased almost everywhere in obs
-
Geert Jan van Oldenborgh
@gjvoldenborgh
And even larger increases in extremes like heat waves in many parts of the world. Plot: observed trends in the hottest afternoon of the year since 1970 as a multiple of GMST in the GHCN-D station dataset. Does not yet include the 2021 extreme heat in North America.
Zeke Hausfather
@hausfath
One final caveat: no one lives in the global average. Most of our planet is water, and these global average temperature numbers serve to obscure much larger (+50%) warming over land areas where we all live.
-
Geert Jan van Oldenborgh reposted
Zeke Hausfather
@hausfath
However, there are still two other uncertainties – climate sensitivity and carbon cycle feedbacks – that add a lot of uncertainty in the amount of warming we will experience under a given emissions trajectory:
-
Geert Jan van Oldenborgh
@gjvoldenborgh
NASA GPM/IMERG estimate of precipitation over 13-14 July 2021 and DWD accumulated radar data over 24 hours that look close to the most intense ones (thanks Rob). Note how the satellite retrieval misses the thin rainbands, I suspect the scale is also off but it gives an impression
Geert Jan van Oldenborgh
@gjvoldenborgh
The sea-level pressure and Z500 anomaly maps show the cut-off low completely surrounded by high pressure systems with no place to go. Source: ECMWF analyses wrt ERA5 via climexp.knmi.nl (of course).
-
Geert Jan van Oldenborgh
@gjvoldenborgh
Ik heb de reeksen uiteraard op de Climate Explorer. Niet helemaal up-to-date, Rijkswaterstaat maakt het onmogelijk ze automatisch bij te werken, maar kan dat zo met de hand doen.
-
Geert Jan van Oldenborgh reposted
Prof Sonia I. Seneviratne
@SISeneviratne
Evidenz aus @meteoschweiz-Beobachtungen: Klare Zunahme von Starkniederschlägen in der Schweiz. "158 der 173 Messstationen zeigen eine Zunahme, davon 53 deutlich. Eine deutliche Abnahme der Niederschlagsintensität wurde nirgends verzeichnet. " www.nccs.admin.ch/nccs/de/home/klimawandel-und-auswirkung… (s. Slide 3)
-
Geert Jan van Oldenborgh reposted
KNMI
@KNMI
Zijn neerslagextremen overal in Nederland even zwaar? In Nederland zijn er slechts relatief kleine verschillen in neerslagextremen. Voor korte duren tot 12 uur zijn deze niet aan te tonen (dus klein ten opzichte van de grilligheid van neerslag)... 1/2
-
Geert Jan van Oldenborgh reposted
Prof Hayley J. Fowler
@HayleyJFowler
We've got a paper in review @NatureClimate that looks at how these types of events will change with warming from the European CPM Lizzie has run. It would be interesting to try to do an attribution study using CPMs. We've talked with @StottPeter about this a bit already
-
Geert Jan van Oldenborgh
@gjvoldenborgh
These are (by necessity) regional models.
Gerard Cats
@gjcats
Would they have to be global?
-
Geert Jan van Oldenborgh
@gjvoldenborgh
Yes, we should be looking into that together with my precipitation-studying colleagues at the Met Office, in Newcastle @HayleyJFowler and at KNMI @GeertLenderink.
Chris Parker
@HyperHydr0
What about doing one in the UK to develop methods? I believe @metoffice has data from 12x100year CPM runs coming out shortly. Although hourly at 2.2km resolution is a lot of data to process!
-
Geert Jan van Oldenborgh
@gjvoldenborgh
I have not yet had time to study the event(s).
Linh Nhat Luu
@linhnluu
How long did the heavy rain last?
-
Geert Jan van Oldenborgh
@gjvoldenborgh
That depends on how much spatial pooling we'd manage, but I'd say at least 50 years. We'd start with a slow attribution study to learn how to interpet the data before attempting a rapid one. And get the necessary computer infrastructure up and running.
Mark Muetzelfeldt
@markmuetz
How long do the runs with a convection permitting model need to be?
-
Geert Jan van Oldenborgh
@gjvoldenborgh
Extreme rainfall in the southern Netherlands, Belgium and Germany. Attribution will be difficult as we do not yet have long runs with convection permitting models and the observations are difficult. However, it is clear that warming increases the severity of those kinds of events
Météo Express
@MeteoExpress
🌧 Terribles images montrant l'ampleur dramatique des inondations à Theux en province de Liège en Belgique. Il va encore pleuvoir toute la nuit. (© Christelle Jeanpierre)
-
Geert Jan van Oldenborgh
@gjvoldenborgh
Part of a larger pattern, second-highest on record in a large area in Russia as well. And we still have a lot of summer to go.
-
Geert Jan van Oldenborgh reposted
Connecting health and climate change
@ENBEL_H2020
🗞️Our first ENBEL newsletter is out - check it out to learn more about #heat & the impact on human #health: static1.squarespace.com/static/60478529fe54df702f7f5d97/t…
Sign-up to receive the next update from our network of research projects studying how #climatechange impacts human health: www.enbel-project.eu/newsletter -
Geert Jan van Oldenborgh reposted
Chris E Forest
@ChrisEForest
An solid scientific assessment by Fredi and Geert and critical reporting by The Daily. @gjvoldenborgh podcasts.apple.com/us/podcast/the-daily/id1200361736?i=10…
-
Geert Jan van Oldenborgh
@gjvoldenborgh
Ja, dat was het koudste voorjaar sinds ... 2013! In het klimaat van een paar decennia gelden was het een heel normaal voorjaar. We zijn ondertussen gewend aan de warmte. Gelieve u bij de feiten te houden en geen propaganda te bedrijven.
-
Geert Jan van Oldenborgh reposted
Dr Friederike Otto
@FrediOtto
Great explanation of how & why @gjvoldenborgh & I & all the scientists working with @wxrisk “Revolutionize Weather Attribution Work” | Time time.com/6079744/climate-weather-attribution/
-
Geert Jan van Oldenborgh
@gjvoldenborgh
Nice story on what we do and why we do it in rapid extreme event attribution. time.com/6079744/climate-weather-attribution/
-
Geert Jan van Oldenborgh
@gjvoldenborgh
Rise in CO2 concentrations in July–June years. In 1998 and 2016 huge El Niño events gave drought on land and hence jumps in CO2 concentrations. Without that we are still at ~2.5 ppm/yr and that needs to go down if we want to limit warming. Are we going to follow the green line?
Geert Jan van Oldenborgh
@gjvoldenborgh
This means the total concentration is getting closer to RCP8.5...
-
Geert Jan van Oldenborgh
@gjvoldenborgh
Plot of the day: hottest afternoon of the day averaged over California's Central Valley. "Only" a 2.2 ºC (4.0 ºF) jump, so not as extreme an extreme as the Northwest and Canada. Attribution is much harder as irrigation affects heat waves strongly in this area.
-
Geert Jan van Oldenborgh reposted
Zeke Hausfather
@hausfath
Its also rather instructive to update that old AR5 Box 9.2 figure with the past 15 years (rather than the 1998-2012 period):
Zeke Hausfather
@hausfath
Here is a similar figure, using the same CMIP5 climate models (albeit blended SST/SAT fields to match what observations are measuring), but for the last 15 years (2006-2020). Now models are decidedly on the high end of CMIP5 model trends over a 15-yr period. 2/3
-
Geert Jan van Oldenborgh
@gjvoldenborgh
Nee, maar de relevante figuur is on hoofdstuk 11, figuur 11.25b, hier met verificatie. Uitgebreid geanalyseerd p www.climate-lab-book.ac.uk/comparing-cmip5-observations/
Dr.Sc. Ferdinand Meeus
@fmeeus1
Denk dat IPCC rapport AR5 hier de betrouwbare referentie is. Of betwist u de cijfers van IPCC grafiek ?
-
Geert Jan van Oldenborgh
@gjvoldenborgh
1) Nee, de temperaturen waren dit jaar hoger in Canada.
2) We begrijpen goed waarom het toen zo heet was (dust bowl, irrigatie) en dat is dus geen argument tegen het bestaan van opwarming door broeikasgassen. Wat al zo geaccepteerd is dat die discussie eigenlijk gesloten is.
Dr.Sc. Ferdinand Meeus
@fmeeus1
Hittegolven in 1930's zoals Dust Ball waren erger dan de recente in Canada bij CO2 niveau 100ppm lager dan vandaag.
-
Geert Jan van Oldenborgh
@gjvoldenborgh
Ja, klimaatverandering gaat in hittegolven hier en in Canada veel sneller dan we de modellen aangeven. Niet erg geruststellend lijkt me.
De voorspellingen van de wereldgemiddelde temperatuur en grootschalige veranderingen zijn spot-on. www.realclimate.org/index.php/climate-model-projections-c…
Dr.Sc. Ferdinand Meeus
@fmeeus1
Klimaatonderzoeker @gjvoldenborgh geeft toe dat klimaatmodellen niet kloppen...hij zegt dat uitkomst modellen niet kloppen met metingen. Voortschrijdend inzicht.
Nieuwsuur
@Nieuwsuur
Klimaatonderzoeker @gjvoldenborgh van het KNMI: “De hittegolf in van vorige week in delen van Canada en de VS was echt alarmerend. Volgens de modellen zouden die temperaturen niet moeten kunnen. Was het pech of hebben we iets over het hoofd gezien?” #nieuwsuur
This media couldn't be displayed. See it on the original post. -
Geert Jan van Oldenborgh
@gjvoldenborgh
I made the same point in an interview yesterday: net zero means we stop warming, it does not mean it will get cooler again. We are stuck with worse heat waves than now given the earth will warm further while we try to address the problem. x.com/Nieuwsuur/status/1414309864982020097
Prof Sonia I. Seneviratne
@SISeneviratne
Interview in @Sonntags_Blick: "CO2 bleibt Hunderte bis Tausende Jahre bestehen [...]. Ich denke, das wird noch zu wenig gut verstanden: Die Klimaerwärmung ist irreversibel"
www.blick.ch/schweiz/wetterextreme-beunruhigen-eth-klimaf… -
Geert Jan van Oldenborgh reposted
Nieuwsuur
@Nieuwsuur
Klimaatonderzoeker @gjvoldenborgh van het KNMI: “De hittegolf in van vorige week in delen van Canada en de VS was echt alarmerend. Volgens de modellen zouden die temperaturen niet moeten kunnen. Was het pech of hebben we iets over het hoofd gezien?” #nieuwsuur
This media couldn't be displayed. See it on the original post. -
Geert Jan van Oldenborgh
@gjvoldenborgh
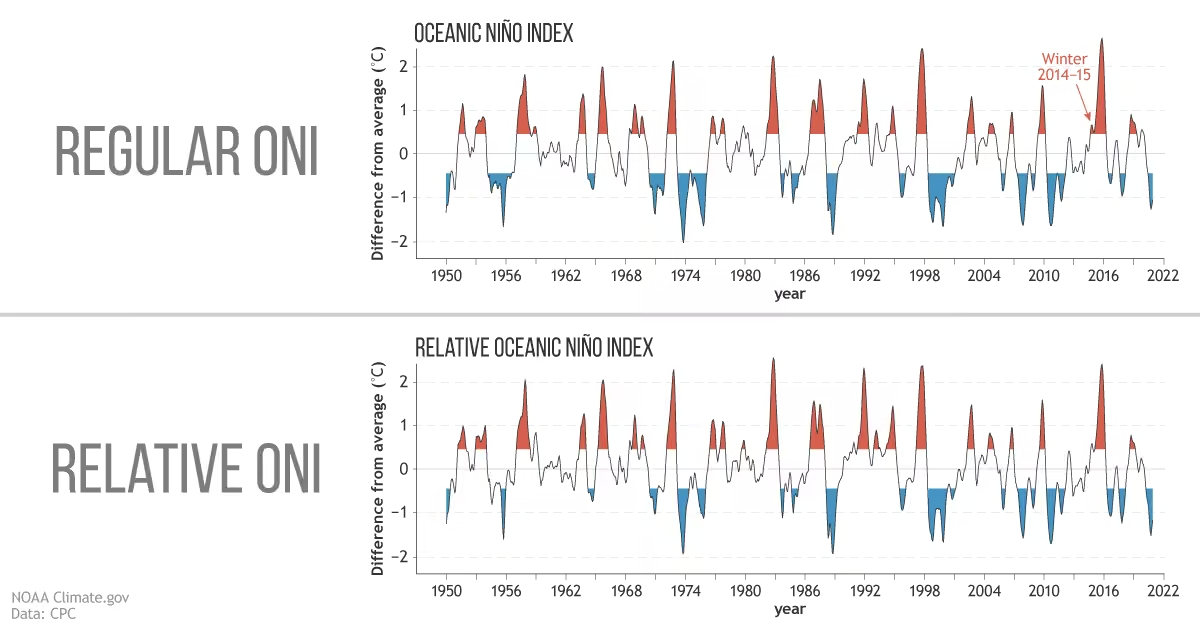
We found correlation coefficients between Niño3.4 and highest temperatures of the year r<0.1 so irrelevant. Also, ENSO was neutral last week with all Niño indices very close to zero (see graph). So we see no role for ENSO in the Pacific NW heat. www.worldweatherattribution.org/wp-content/uploads/NW-US-…
-
Geert Jan van Oldenborgh reposted
Eric Feigl-Ding
@DrEricDing
⚠️Bad trend—Netherlands reports a near vertical >800% increase in new #covid19 cases in 1 week. Greece 🇬🇷 and Spain 🇪🇸 nearly matching that surge. @WHO now reports over 2 dozen countries with “near vertical” sharp rises in cases—mostly #deltavariant. Pandemic “Act 2” has begun.🧵
-
Geert Jan van Oldenborgh reposted
Lucas Brouwers
@lucasbrouwers
Prachtig interview dit. Samen met anderen heeft @gjvoldenborgh in razend tempo de Canadese hittegolf geduid. Tussen de chemo's door. En alles moet kloppen.
www.nrc.nl/nieuws/2021/07/08/geert-jan-van-oldenborgh-het… -
Geert Jan van Oldenborgh reposted
Yuen Pau Woo
@yuenpauwoo
The missing piece here is that a major disaster event has occurred, resulting in “excess deaths” from heat in June-July alone that could exceed the number of COVID deaths in BC through most of 2020. @wxrisk @gjvoldenborgh www.cbc.ca/news/science/heat-wave-climate-change-1.609373…
-
Geert Jan van Oldenborgh
@gjvoldenborgh
If necessary yes. Usually we can ignore it as the cooling trend 1960s–1980s due to increasing air pollution in summer is cancelling the warming trend from mitigation 1980s–2000s, as long as our trend estimates start in 1960 or earlier. This excludes forest fires…
Leon Simons 🌍
@LeonSimons8
Will the follow up study also look at aerosol mitigation effects?
This post is unavailable. See it on X. -
Geert Jan van Oldenborgh reposted
Henry Fountain
@henryfountain
I’ve seen a lot of “discussion” on this hellsite in the last 24 hours regarding the recent study that showed the link between last week’s bad heat wave in the Pacific Northwest and climate change. 1/xx
-
Geert Jan van Oldenborgh
@gjvoldenborgh
Heat waves are actually very hard. The climate part is easy as you say, but heat waves are also sensitive to other factors. The cooling trend in eastern North America has been found to be due to changes in agricultural practices (no more dust bowls) and increasing irrigation.
Henry Fountain
@henryfountain
Some extreme events are “easier” to analyze than others. Heat waves are among the easier ones (though it’s a disservice to these scientists to call these analyses “easy.”) 21/xx
-
Geert Jan van Oldenborgh
@gjvoldenborgh
In fact, at the moment we have zero funding.
Henry Fountain
@henryfountain
6) The scientists who do this work are not frequently finding climate change connections because they have some financial interest. They are not getting huge funding from the government, or the Deep State, or the Trilateral Commission. 23/xx
-
Geert Jan van Oldenborgh
@gjvoldenborgh
This was a fairly short heat wave, the most intense phase was only 3 days in our index area and 2 days in the western parts.
Louis Michaud, Process Control Engineer.
@VortexEngine
The duration of recent high temperature events could be a stronger indication of earth system change than it's amplitude. @gjvoldenborgh @flacamera @jtemple
-
Geert Jan van Oldenborgh
@gjvoldenborgh
Yes.
We plan a follow-up study to investigate the details. Note that a lot of jet stream effects that are just hypotheses or even disproven in the scientific world are considered solid facts in the popular world.
Climate State
@climatestate
I wonder if their analysis includes the Jet Stream
This post is unavailable. See it on X. -
Geert Jan van Oldenborgh
@gjvoldenborgh
This of course neglects the much stronger heating before that and just serves to mislead the audience. The signal/noise ratio of the global mean temperature is such that it makes no sense to study such a short record...
Werner I. Etter
@EtterWerner
Cold records are no surprise because earth is cooling since 2016.
Geert Jan van Oldenborgh
@gjvoldenborgh
Your other statement is also false, there was only a cold record in Texas and it was on a warming trend. See also doi.org/10.1088/1748-9326/ab4867. You appear to value ideology over the real world.
-
Geert Jan van Oldenborgh
@gjvoldenborgh
Plot of the day: ranking of 2021 heat (TXx, highest daily maximum temperature of the year up to now) in the context of 1950-2021. Dark red indicates record warm, bright red second place etc. Note that the peak of summer has yet to arrive in most of the NH. Source: ERA5+ECMWF.
Geert Jan van Oldenborgh
@gjvoldenborgh
On the opposite end, record cold (in July 2020–June 2021) only in the Texas cold wave. An observational analysis showed that it was a 1 in ~100 yr event on a warming trend. Cold waves are getting warmer everywhere in the northern midlatitudes, see doi.org/10.1088/1748-9326/ab4867. ERA5.
-
Geert Jan van Oldenborgh reposted
Roland Pease
@PeaseRoland
Everyone is talking about this powerful #worldweatherattribution study on last week's heatwave (inc. me on ScienceInAction www.bbc.co.uk/programmes/w3ct1l3w)
What @gjvoldenborgh also said is this key initiative still has no stable funding - just dedicated experts volunteering their time
World Meteorological Organization
@WMO
Record-breaking North American temperatures last week would have been virtually impossible without #climatechange, which made the #heatwave at least 150 times more likely to happen, says study by climate scientists.
www.worldweatherattribution.org -
Geert Jan van Oldenborgh reposted
Maarten van Aalst
@mkvaalst
...note that rising risks appear everywhere, incl
1. places not used to heat suddenly facing heatwaves
2. places that are already hot reaching increasingly intolerable temperatures.
Heat was the deadliest disaster in both 2019 and 2020. And many heat deaths aren't even counted. -
Geert Jan van Oldenborgh
@gjvoldenborgh
Always a joy to talk with them.
Roland Pease
@PeaseRoland
Thanks to @gjvoldenborgh for talking to us on Science in Action about the model-busting Pacific-northwest #heatwave and the new worldweather-attribution study. Deeply instructive as ever.
www.bbc.co.uk/programmes/w3ct1l3w
Pairs up well with climate-law interview with @FrediOtto last week. -
Geert Jan van Oldenborgh reposted
Dr. Robert Rohde
@RARohde
I've had a little time to digest the WWA report on the Northwest heatwave:
www.worldweatherattribution.org/wp-content/uploads/NW-US-…
The most striking thing to me isn't the headline numbers, it's this graph.
Basically, it says the heatwave was statistically "impossible". Let me elaborate... -
Geert Jan van Oldenborgh reposted
Context Climate
@ContextClimate
“It’s rather surprising and shaking that our theoretical picture of how heatwaves behave was broken so quickly” by the June "heatdome", says @gjvoldenborgh #heatwave2021 #climate news.trust.org/item/20210707222109-4gzyi/
-
Geert Jan van Oldenborgh
@gjvoldenborgh
Technical paper: https:/doi.org/10.5194/ascmo-6-177-2020
Scientific paper: doi.org/10.1007/s10584-021-03071-7
Blog post: www.worldweatherattribution.org/pathways-and-pitfalls-in-…
Summary of the blog post: www.carbonbrief.org/guest-post-lessons-learned-from-five-…
Please contact me if you have questions left after reading these.
Pandem(on)ical Order of Good Cheer
@EmpireinWinter
Gonna need an explainer on how these risk studies function. I don't dispute the overall conclusions, but draw a blank on how these are arrived at.
-
Geert Jan van Oldenborgh reposted
Prof Sonia I. Seneviratne
@SISeneviratne
The Pacific heatwave had a near-zero probability without climate change. The anomalies were so extreme that models struggle to capture them. Climate change is bringing us into uncharted territory... Happy to have contributed to this exciting @wxrisk study! www.worldweatherattribution.org/wp-content/uploads/NW-US-…
Geert Jan van Oldenborgh
@gjvoldenborgh
Really proud of our team effort to analyse the Pacific heat. 27 scientists working very hard for 10 days to understand it but also characterise the limits of our understanding. www.worldweatherattribution.org/western-north-american-ex… @FrediOtto @RobertVautard @SISeneviratne @mkvaalst @RoopSingh @DimCoumou @KNMI
-
Geert Jan van Oldenborgh reposted
Svein Tveitdal
@tveitdal
North American heatwave broke records – and the climate models
www.climatechangenews.com/2021/07/07/north-american-heatw…
Climate scientists were shocked by the recent lethal heatwaves in western Canada and northwestern US, which exceeded all global heating predictions
@FrediOtto @gjvoldenborgh
@ecioxford @RMetS -
Geert Jan van Oldenborgh reposted
Prof Sonia I. Seneviratne
@SISeneviratne
Among many remaining questions: Did pre-event drought conditions contribute to the outstanding temperatures & is this why this event does not fit in statistical models for extremes? To be investigated in H2020 Xaida project. @RobertVautard @DimCoumou @gjvoldenborgh @FrediOtto
-
Geert Jan van Oldenborgh reposted
NPO Radio 1
@NPORadio1
De extreme hitte die vorige week delen van de VS en Canada teisterde, is vrijwel zeker veroorzaakt door klimaatverandering, blijkt uit onderzoek van een groep internationale wetenschappers. Eén van die wetenschappers is @gjvoldenborgh, hij vertelt erover bij @NOSRadio1.
This media couldn't be displayed. See it on the original post. -
Geert Jan van Oldenborgh
@gjvoldenborgh
De koelende trends in het oosten van Noord Amerika zijn het gevolg van veranderd landgebruik en toegenomen irrigatie die voor meer afkoeling zorgen dan broeikasgassen voor opwarming zorgen (referenties in het artikel). Dat wordt goed begrepen en speelt hier geen rol.
-
Geert Jan van Oldenborgh
@gjvoldenborgh
Hier het het jaarlijkse maximum van de gebiedsgemiddelde maximumtempertauur. (Juni) 2021 was niet laag. maar extreem warm in dit gebied (de zwarte doos in de eerste figuur).
Jan van den Bos
@janpyro100
Dat is inderdaad zeer extreem. Als ik naar dit grafiekje kijk komt juni gemiddeld laag uit. Je zou kunnen concluderen dat het op andere locaties extreem koud moet zijn geweest. Mits deze grafiek juist is.
-
Geert Jan van Oldenborgh
@gjvoldenborgh
Ja, maar alleen het eerste statement dat het vroeger onmogelijk was, niet dat het nog lang niet verwacht werd. Zie onze studie www.worldweatherattribution.org/siberian-heatwave-of-2020…
Ton in 't Veld
@Ton_in_t_Veld
Geldt dit ook voor, de Poolgebieden, Scandinavië en het Noorden van de Sovjet-Unie?
-
Geert Jan van Oldenborgh reposted
Carbon Brief
@CarbonBrief
Pacific north-west heatwave shows climate is heading into ‘uncharted territory’ | @rtmcswee ft. @FrediOtto @gjvoldenborgh @AndrewKingClim
Read: www.carbonbrief.org/pacific-north-west-heatwave-shows-cli… -
Geert Jan van Oldenborgh reposted
Prof. Katharine Hayhoe
@KHayhoe
We've known that climate change was loading the dice against us for a long time, but now we know by how much. The west coast heatwave was "virtually impossible" without climate change. Analysis by @wxrisk @gjvoldenborgh @SISeneviratne @FrediOtto et al. www.independent.co.uk/climate-change/news/north-america-h…
-
Geert Jan van Oldenborgh
@gjvoldenborgh
Probeer climexp.knmi.nl. Heeft niet alle data maar wel veel. De interface climexp.knmi.nl/atlas is wat makkelijker te bedienen en minder op experts gericht. Succes!
Peter Vanden Berghe
@PtrVdBrghe
Ik ben op zoek naar data omtrent de werelwijde climate change verwachtingen .. Kan iemand helpen ?
-
Geert Jan van Oldenborgh reposted
Maarten van Aalst
@mkvaalst
Prachtig interview met @gjvoldenborgh in @nrc over onze studie naar de extreme hitte in de VS en Canada.
Altijd een voorrecht om met hem samen te werken -- dit interview laat weer zien waarom! @knmi @FacultyITC @RCClimate @RodeKruis
www.nrc.nl/nieuws/2021/07/08/geert-jan-van-oldenborgh-het… -
Geert Jan van Oldenborgh reposted
Dr Friederike Otto
@FrediOtto
New @wxrisk study: the Pacific Northwest 2021 heatwave is still rare in today’s climate, yet would be virtually impossible without human-caused climate change. As warming continues, it will become a lot less rare. - Thanks amazing team!!
www.worldweatherattribution.org/western-north-american-ex… -
Geert Jan van Oldenborgh
@gjvoldenborgh
Really proud of our team effort to analyse the Pacific heat. 27 scientists working very hard for 10 days to understand it but also characterise the limits of our understanding. www.worldweatherattribution.org/western-north-american-ex… @FrediOtto @RobertVautard @SISeneviratne @mkvaalst @RoopSingh @DimCoumou @KNMI
Geert Jan van Oldenborgh
@gjvoldenborgh
Very good write-ups at arstechnica.com/science/2021/07/pacific-northwest-heatwav… and www.nytimes.com/2021/07/07/climate/climate-change-heat-wa…
-
Geert Jan van Oldenborgh
@gjvoldenborgh
I do not think these data allow us to differentiate. There are a lot of other forcings besides CO2 that are largely proportional to the CO2 concentration (aerosols, methane, ...) effectively included as well in this graph. You really need climate models to get further.
Martijn v. Mensvoort
@handresearch
Geert-Jan, in the past you have also presented similar graphs with a (pink) straight trend line featured with a log CO2 scale. Since both approaches produce so far a straight trend line, what does this indicate for the nature of the relationship between CO2 and temperature?
-
Geert Jan van Oldenborgh
@gjvoldenborgh
11 pm BST, midnight my time, 3pm Pacific Time. The definitive place to look will be our WWA web site, worldweatherattribution.org
Peter Thorne
@climpeter
Any heads up as to when and how will be released?
-
Geert Jan van Oldenborgh
@gjvoldenborgh
Both. It was definitely non-trivial.
Chris Parker
@HyperHydr0
Fitting GEVs to the station data must have been fun...
Or did you just skip that and use ERA5? -
Geert Jan van Oldenborgh
@gjvoldenborgh
Thanks. Our first analysis of the Pacific North American heat wave will come out tomorrow. It gave rise to so many questions that we’ll need a few follow-up investigations as well over the next months.
-
Geert Jan van Oldenborgh reposted
Karin van der Wiel
@karin_vdwiel
Twee artikelen van het (onofficiële) @KNMI #droogte-team in de nieuwste uitgave van Water Matters.
Online te lezen in het Nederlands én Engels! ⬇️
Vakblad H2O
@vakbladh2o
Kennismagazine Water Matters is uit. In 12e editie een breed scala aan onderzoeken met aandacht voor actuele thema’s, zoals droogte (2 bijdragen KNMI), inschatting overstromingskansen (5 grote verbeteringen) en klimaatscan grote wateren. Lees uitgave hier:
www.h2owaternetwerk.nl/water-matters/water-matters-jun-2021 -
Geert Jan van Oldenborgh reposted
Maarten van Aalst
@mkvaalst
The danger posed by heatwaves deserves to be taken more seriously www.economist.com/leaders/2021/07/03/the-danger-posed-by-… from @TheEconomist www.economist.com/leaders/2021/07/03/the-danger-posed-by-…
-
Geert Jan van Oldenborgh
@gjvoldenborgh
Can you send me the references? Sounds very relevant to us. Always trying to avoid pitfalls...
Daniel Swain
@Weather_West
Interesting! We've found very high sensitivity to the particular kind of parametric distribution used in some of our attribution work, although we have almost always worked with variables other than temperature (which is very possibly where the different lies).
-
Geert Jan van Oldenborgh
@gjvoldenborgh
We always try to select models with resolutions that can at least in principle resolve the extremes under study, eg at least 30km for tropical cyclones. Other problems we found are limits on extreme precipitation, missing drivers eg irrigation, surface roughness,... See the paper
Daniel Swain
@Weather_West
And I also agree that the underlying issue is that coarse-resolution climate models just aren't always up to the task of adequately simulating certain kinds of atmospheric extremes & their precursors. I'm hopeful we can circumvent that w/large, high-res single model ensembles...
-
Geert Jan van Oldenborgh
@gjvoldenborgh
Five days to do the event definition, collect the observations and model output, do the model validation and analyses; another two-three days until the texts are written and a few days to get everything in order for publication. Ten days planned for this complicated case.
Zeke Hausfather
@hausfath
Science has gotten a lot faster in recent decades, but it still takes more than few days to do this sort of modeling 😉
-
Geert Jan van Oldenborgh reposted
Andrew Revkin 🌎 ✍🏼 🪕 ☮️
@Revkin
A terrifying view of the #lyttonfire exploding in Lytton, BC, where, just a day ago, "heat tourists" had been arriving to experience the historic high temperatures:
This post is unavailable. See it on X. -
Geert Jan van Oldenborgh
@gjvoldenborgh
We have often done both and never noticed big discrepancies. The big problems are in the model-obs comparisons, both the model validation step that often eliminates half our models and in the final trend comparisons. Especially in heat waves. See doi.org/10.1007/s10584-021-03071-7, WWA site
Daniel Swain
@Weather_West
I've seen it done both ways. But even then, there remain large curve fitting uncertainties. That's why I prefer empirical/"counting" approach using large ensembles where possible. & even then, you quickly run into sample size/model extreme event fidelity issues!
-
Geert Jan van Oldenborgh reposted
Dr Friederike Otto
@FrediOtto
The stats are definitely a challenge. Currently still making sense of it all but planning to share that middle of next week.
-
Geert Jan van Oldenborgh
@gjvoldenborgh
Yes, it is very difficult to establish a return time for an event like this were you can question the assumptions that go into the fits in many ways. We try to do a as good an analysis as possible noting how they affect the result and plan to publish first results next week.
Daniel Swain
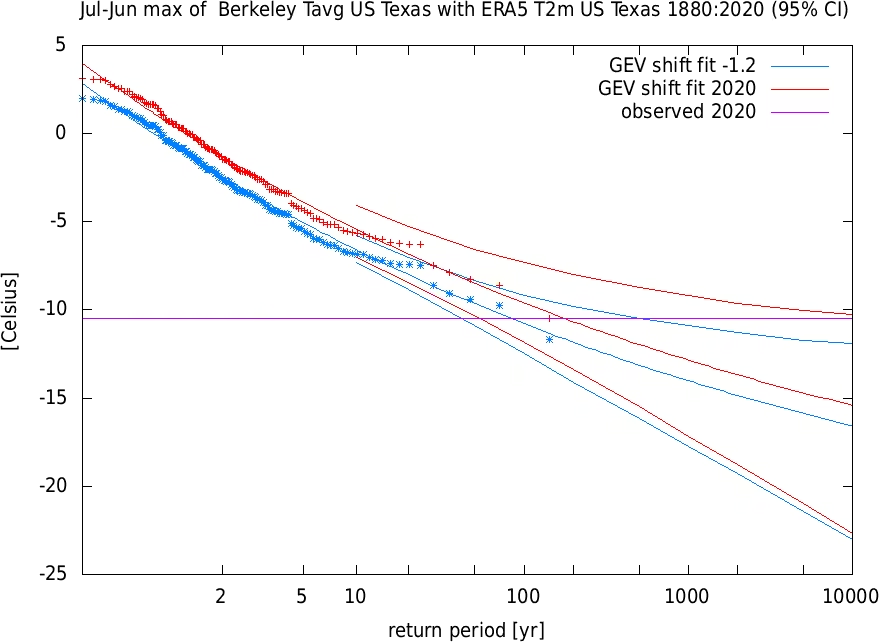
@Weather_West
I would have a very hard time believing this was truly 10,000 year event. I'm actually pretty skeptical it was even 1000yr event in present climate. A huge outlier, obviously, but we tend to systematically overestimate the rarity of extreme events using fitted distributions.
-
Geert Jan van Oldenborgh
@gjvoldenborgh
There are studies that the dust bowl, changing land use patterns, really enhanced heat waves in the 1930s (doi.org/10.1038/s41467-020-16676-w). Since then, changes in irrigation (doi.org/10.1002/2016JD025740) and crop types (doi.org/10.3354/cr024243) are mentioned as drivers of the cooling trends
Geert Jan van Oldenborgh
@gjvoldenborgh
... and yes, water from increased irrigation west of the Mississippi would recycle multiple times on its way east, contributing to the increase in precipitation therein summer. Which was not in CMIP5, which did not include irrigation, see box 11.2 in the WG1 AR5 report.
Geert Jan van Oldenborgh
@gjvoldenborgh
(I feel like an old professor pointing people to the literature, hope you do not mind. (Of course I /am/ an old professor by now as well. (Hopefully not grumpy or set in my ways yet.)))
-
Geert Jan van Oldenborgh reposted
Dr. Robert Rohde
@RARohde
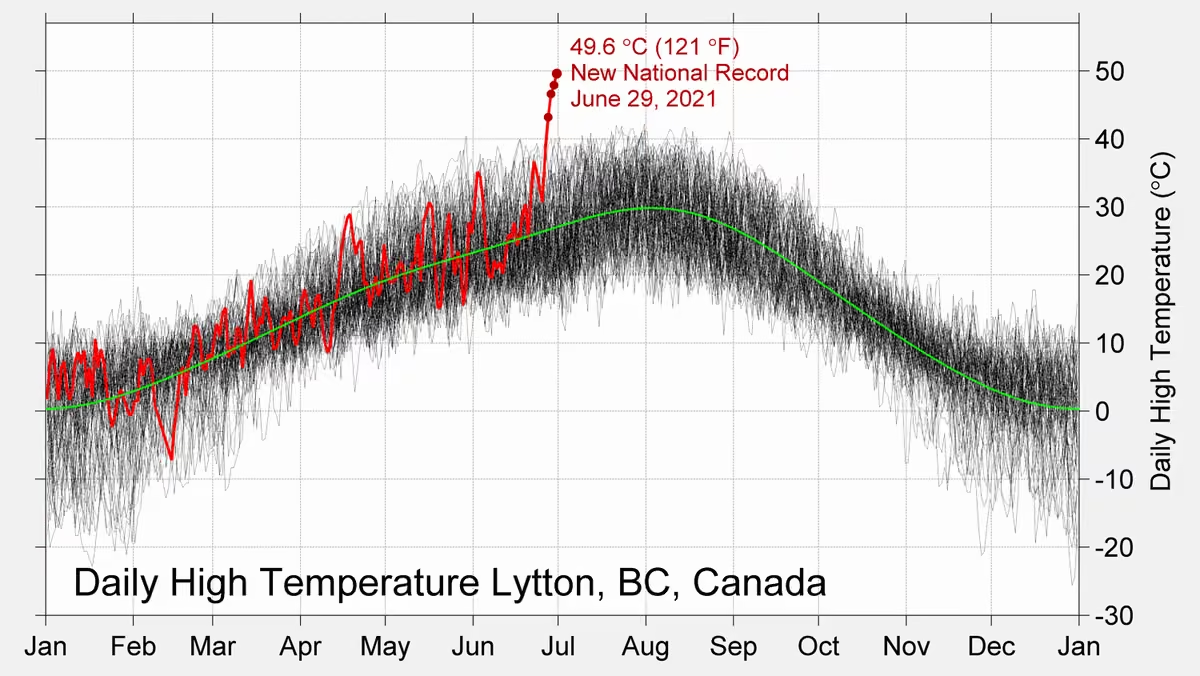
Stunning breakout far above all previously measured values to set a new national temperature record for Canada of 49.6 °C (121 °F).
This heatwave has reached further above historical means than any other summer heatwave previously recorded anywhere in North America. -
Geert Jan van Oldenborgh
@gjvoldenborgh
Als alles goed gaat midden volgende week. Het WWA team plus nog wat experts is hard aan de slag.
Chemotherapie lijkt goed te werken maar hakt er wel in.
Helga van Leur ☀
@helgavanleur
Ik vroeg mij al af wanneer de attributie-studie over deze uitzonderlijke hitte beschikbaar zou komen. Maar in dit geval: sterkte en beterschap!
-
Geert Jan van Oldenborgh
@gjvoldenborgh
Here the zonal mean temperature trends in winter and summer in ERA5. In summer there is an enhanced temperature gradient both at ground level and at jet level, wit only a remnant of Arctic amplification around 500 hPa.
-
Geert Jan van Oldenborgh
@gjvoldenborgh
Yes, about 20 degrees above normal (1991-2020).
-
Geert Jan van Oldenborgh reposted
Rolf Schuttenhelm
@RolfSchuttenh
Bizarre ("<1:1000 jaar") hitte in westen Canada & VS. Moet je dan als nieuwssite klimaatverandering onvermeld laten? Misschien maar niet, als je experts @MichaelEMann, @ClimateOfGavin, @gjvoldenborgh en @GuidovanderWerf erover spreekt:
www.nu.nl/klimaat/6142292/het-is-bloedheet-in-vs-en-canad… -
Geert Jan van Oldenborgh
@gjvoldenborgh
The database that we used (GHCN-D) does not have the long time series we demanded for this plot. Here a version demanding only 30 years from 1970. The low trends in India are explained by increased irrigation and air pollution, see eg van Oldenborgh et al, doi.org/10.5194/nhess-18-365-2018
-
Geert Jan van Oldenborgh reposted
Dr Friederike Otto
@FrediOtto
Every heatwave occurring today is made more likely and more intense by human-induced climate change. In some cases local factors enhance or counteract this effect. - For the numbers on the PNW wait for our team @wxrisk @gjvoldenborgh we're working hard on them!
-
Geert Jan van Oldenborgh
@gjvoldenborgh
40 CMIP6 monthly fields of tas, tasmin, tasmax, pr, psl & rsds are now available in the KNMI Climate Explorer (but not yet in the Atlas section). climexp.knmi.nl
-
Geert Jan van Oldenborgh
@gjvoldenborgh
Crazy: 20 degrees Celsius anomalies forecast for Monday and Tuesday in the Pacific Northwest. (ECMWF forecasts interpolated to 0.5º compared to ERA5 1991-2020). Yesterday's forecast of 43 ºC for Seattle would already be far above the historical record of 39.4ºC. Today I see 44ºC.
Geert Jan van Oldenborgh
@gjvoldenborgh
Just hoping not too many people die... Heat waves are deadly and this is going to be extreme.
We have started an attribution study of the heat, but due to my poor health it will take a bit longer than usual. -
Geert Jan van Oldenborgh reposted
Dr Friederike Otto
@FrediOtto
We @wxrisk @gjvoldenborgh are. Bit short on people though, so won’t promise a date when we’ll have numbers yet.
-
Geert Jan van Oldenborgh
@gjvoldenborgh
In Dutch we say ‘as the innkeeper is he trusts his guests”. Everything i have been accused of is standard practice in the (now vey small here) climate change denying community.
Prof. Katharine Hayhoe
@KHayhoe
It's called "projection" :)
-
Geert Jan van Oldenborgh
@gjvoldenborgh
You obviously o not read or care about arguments so it is no use to answer.
dr. Jos PhD
@weerrecords
Statistics provide indications but without physical explanation I don't think you can link with AGW. I had hoped to find something in literature about Z500 trends like Hadley cell expansion or so, but I am not sure it has been looked at.
-
Geert Jan van Oldenborgh
@gjvoldenborgh
Well, you are the expert there. My guess would be that they reason backwards: ideology demands a certain outcome and they cherrypick or search for logical fallacies until they find one that fits their world view. The exact opposite of science so a scientific debate makes no sense
Prof. Katharine Hayhoe
@KHayhoe
one wonders *why* they keep getting it wrong. In fact, one could almost predict they are more likely to get it wrong than not.
Geert Jan van Oldenborgh
@gjvoldenborgh
And one needs to apply your techniques of attaching to their world view and building up trust, ossibly through trusted third persons like preachers, before coming to 'facts".
-
Geert Jan van Oldenborgh
@gjvoldenborgh
I still have to do the actual work on this heat wave though. Their properties differ strongly from place to place and they tend to be sensitive to other factors as well. See www.worldweatherattribution.org/trends-in-weather-extreme… for a readable discussion if you are interested.
Geert Jan van Oldenborgh
@gjvoldenborgh
As we showed in Otto et al, 2012 (doi.org/10.1029/2011GL050422), that depends on the question. The anomaly is mainly due to the circulation pattern. The probability of such an event is usually mainly due to global warming because you are far in the tail and the shape parameter is <0.
-
Geert Jan van Oldenborgh
@gjvoldenborgh
Very similar plots in ERA5/analyses/forecasts: Z500 has never been so high in the area of the forecast heat. Note however that I do not take into account the thermodynamic expansion of the atmosphere raising Z500 everywhere that should be subtracted.
dr. Jos PhD
@weerrecords
Maybe also have a look at 500 hPA height? #heatdome
This post is unavailable. See it on X.Post not available here, view on X
Geert Jan van Oldenborgh
@gjvoldenborgh
As we showed in Otto et al, 2012 (doi.org/10.1029/2011GL050422), that depends on the question. The anomaly is mainly due to the circulation pattern. The probability of such an event is usually mainly due to global warming because you are far in the tail and the shape parameter is <0.
-
Geert Jan van Oldenborgh
@gjvoldenborgh
It looks a bit less impressive in the MSLP maps, with "only" a clear Scandinavian block up to day 15 or so. Attached week 2 (5-12 July), week 3 (12-19 July) and week 3 (12-19 July). Contour intervals 5 and 10 hPa.
-
Geert Jan van Oldenborgh
@gjvoldenborgh
This paper: "Due to a lack of daily, gridded soil moisture observations, we use CLM, forced by the ERA-Interim reanalysis." In recent publications doi.org/10.5194/esd-12-17-2021 doi.org/10.1088/1748-9326/ab97ca we use multiple datasets, but still land models driven by observations or reanalysis.
Timothy J Dunkerton
@tim_dunkerton
As a matter of interest, what soil moisture measurements are available?
-
Geert Jan van Oldenborgh
@gjvoldenborgh
OK, southern Finland and northwestern Russia. Sorry.
Juha Riissanen
@juhariis
How do you define "west Siberia"?
-
Geert Jan van Oldenborgh
@gjvoldenborgh
Definitely, next to global warming, see our paper from a few years back, Philip et al, 2018, Clim. Dyn., doi.org/10.1007/. s00382-017-3759-x
Timothy J Dunkerton
@tim_dunkerton
Soil moisture matters.
-
Geert Jan van Oldenborgh
@gjvoldenborgh
Plot of the day: rank of the highest Tmax of 2021 in EAR5 from 1979-now extended with ECMWF analyses up to yesterday and 10-day forecast. Highest recorded already in western North America, second-highest in west Siberia.
Geert Jan van Oldenborgh
@gjvoldenborgh
Forecast to be up to 15 ºC above normal, 10 ºC warmer than the normal warmest day of the year in the Pacific Northwest and Canadian Rockies around the 28th of June. Let's hope the forecast is not accurate...
-
Geert Jan van Oldenborgh reposted
Prof Sonia I. Seneviratne
@SISeneviratne
Effekte des Klimawandels werden schon klar in der Schweiz beobachtet. Leider wurde das bei der Abstimmung zum #co2gesetz zu wenig thematisiert. Klimawandel ist nicht billig und die Risiken nehmen mit zunehmender Erwärmung zu. @KlimaschutzCH @KlimaAllianzCH www.nccs.admin.ch/nccs/de/home/klimawandel-und-auswirkung…
-
Geert Jan van Oldenborgh
@gjvoldenborgh
Here two divergent estimates of precipitation yesterday straight from climexp.knmi.nl (of course). Not sure why GPM/IMERG does not have anything over land.
-
Geert Jan van Oldenborgh
@gjvoldenborgh
Indeed, but never underestimate natural variability. Trends in circulation are only significant over >50 years, preferably 100 years. Both observations and model results have by now thoroughly disproven the "meandering jetstream" hypothesis. I see it as a "convenient falsehood".
-
Geert Jan van Oldenborgh
@gjvoldenborgh
In general the increased temperature gradient at ground level is counteracted by a decreased gradient at jet level due to the upper tropospheric warming advected by the Hadley circulation. The net effect is close to zero, in Europe even more zonal flows in models and observations
-
Geert Jan van Oldenborgh reposted
Prof Sonia I. Seneviratne
@SISeneviratne
Present-day impacts of human-induced climate change: The 2021 spring frost damages in France were made +20-120% more likely. Switzerland was also affected: -70% apricot production in VS.
@RobertVautard @gjvoldenborgh @FrediOtto
www.worldweatherattribution.org/human-caused-climate-chan…
www.srf.ch/news/schweiz/frostschaeden-frost-vernichtet-70… -
Geert Jan van Oldenborgh reposted
KNMI
@KNMI
Nachtvorst veroorzaakte begin april grote schade aan de #wijngaarden in Noord-Frankrijk. De kans hierop is met ong 60% toegenomen door klimaatverandering. Maar door de opwarming neemt de kans op nachtvorst toch juist af, hoe zit dat? www.knmi.nl/over-het-knmi/nieuws/vaker-vorstschade-aan-wi… #klimaatbericht
-
Geert Jan van Oldenborgh
@gjvoldenborgh
Our latest WWA study led by Robert Vautard gave very interesting results. Spring frosts of course decrease relative to a fixed date, but plants also start growing earlier. This is faster, so the risk of damaging frost /increases/ www.worldweatherattribution.org/human-caused-climate-chan… @RobertVautard @FrediOtto
-
Geert Jan van Oldenborgh reposted
Copernicus ECMWF
@CopernicusECMWF
Spring 2021 in Europe...it wasn't as cold as you might have thought!
We only have to go back to 2013 to see a colder spring for Europe as a whole, and similarly cool springs used to be common. Perhaps we are all just getting used to climate change.
More➡️climate.copernicus.eu/spring-2021-europe-was-it-really-so… -
Geert Jan van Oldenborgh
@gjvoldenborgh
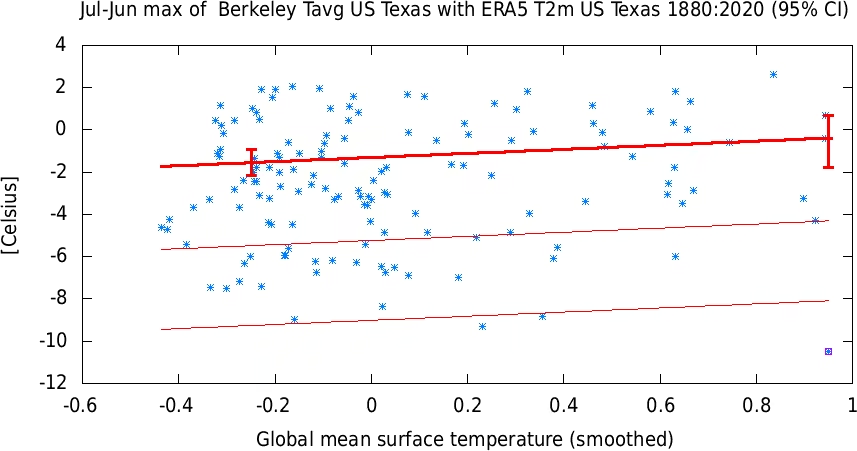
I prefer a regression against GMST as measure of trend because with that scaling hypothesis you can compare different starting dates better. More physical than the mathematical straight line. This gives a rock-steady factor two annually, less in winter, more in summer in the obs.
Geert Jan van Oldenborgh
@gjvoldenborgh
I have scripts that estimate the circulation-dependent part, will run them as soon as I recover from today’s chemo.
-
Geert Jan van Oldenborgh
@gjvoldenborgh
Here in the Netherlands we do not have enough snow for that to be a factor. Soil moisture is heavily regulated in most of the country.
Gianpaolo Balsamo
@gpbalsamo
I would concur with a dual effect of both snow & soil moisture being players for strong warming. For both trends indicate a reduction.
Snow cover ⬇️ is a more potent #climatechange factor (see Arctic).
Ultimately the 2 are connected as shorter snow season, evap⬆️ & soil drier⬇️ ? -
Geert Jan van Oldenborgh
@gjvoldenborgh
We looked into this in 2009 (doi.org/10.5194/cp-5-1-2009), where we identified for the Netherlands a shift to more westerly circulation in winter (not relevant for CH) and in the spring and summer an increase in global radiation beyond aerosols (which cancel in spring and summer).
Prof Sonia I. Seneviratne
@SISeneviratne
Hi Geert Jan, Starting to look into this. Continental regions warm more, but Europe shows esp. strong warming. My guess is: it's a combination of soil moisture-T° & snow-albedo-T° feedbacks (amplifying response to ghg forcing), decrease in aerosol forcing & climate variability.
Geert Jan van Oldenborgh
@gjvoldenborgh
A student has reproduced this for observations to now and CMIP6 but I have not seen the results.
-
Geert Jan van Oldenborgh
@gjvoldenborgh
Hi Sonia, just curious: do you know the reasons for that? Snow albedo feedback? Hochnebel albedo feedback? Aerosol effects? Circulation changes? Cloud changes? Soil moisture (of course)?
Prof Sonia I. Seneviratne
@SISeneviratne
La Suisse est dans le Top 20 des pays avec le plus de réchauffement durant les 10 dernières années.
Die Schweiz gehört zum Top 20 der Länder, die sich in den letzten 10 Jahren am meisten erwärmt haben.
@OuiloiCO2 @JaCO2Gesetz @donnefemmesfrau @KlimaschutzCH @ClimatSuisse -
Geert Jan van Oldenborgh
@gjvoldenborgh
This is (of course) factually wrong. The Southern Hemisphere is warming as expected due to increasing concentrations of greenhouse gases. No surprises for the well-informed person. climexp.knmi.nl/data/tsihadcrut5_southern_hemisphereyr0.png
NVGphoto📸
@nvangelder03
ECMWF, GFS and CFS show the same thing, very cold forecasts, can't be attributed to model bias this is real and it is not caused by anthropogenic climate change
-
Geert Jan van Oldenborgh
@gjvoldenborgh
Northern hemisphere temperatures of the first half of June look very different from May. Finally above-average here in Europe due to a northeastern extension of the Azores High. The high temperatures in North America are also under a (weaker) ridge giving more sunshine.
-
Geert Jan van Oldenborgh reposted
UNDRR
@UNDRR
Progress in attribution science can now help us answer the question below ⬇️
@wxrisk @gjvoldenborgh
www.preventionweb.net/news/view/77884 -
Geert Jan van Oldenborgh
@gjvoldenborgh
I did not yet read the article, but indeed the models got the sign wrong for the circulation anomalies last winter (previous post plots were correct, titles were not).
dr. Jos PhD
@weerrecords
@gjvoldenborgh FYI www.nature.com/articles/s41586-020-2525-0
-
Geert Jan van Oldenborgh
@gjvoldenborgh
The plots were correct, just not the titles.
Geert Jan van Oldenborgh
@gjvoldenborgh
You are correct. Will get the right ones…
-
Post not available here, view on X
Geert Jan van Oldenborgh
@gjvoldenborgh
"... studies with replication issues were cited an average of 153 times more often than those that replicated cleanly... The effect was even larger for papers published in the high-prestige journals Nature and Science." arstechnica.com/science/2021/05/for-research-citations-no…
Geert Jan van Oldenborgh
@gjvoldenborgh
You are correct. Will get the right ones…
-
Geert Jan van Oldenborgh reposted
Zeke Hausfather
@hausfath
Time to do science:
Step 1: code up the main analysis/ get results – 2 days
Step 2: do sensitivity tests, checks, and write the paper - 2 months
Step 3: get through peer review and publish - 6 months
At times its really tempting just to do Step 1 and share it on twitter 😛 -
Geert Jan van Oldenborgh
@gjvoldenborgh
Plot of the day: first look at May temperatures. Very mixed: far above normal in western and northern Siberia, North Africa; below average in central Europe (personally verified), northern India (?), Mongolia.
-
Geert Jan van Oldenborgh
@gjvoldenborgh
A weather extreme does not become a disaster without people (or nature) in harm's way (Exposure) and affected by the extreme (Vulnerability). A change in the frequency of disasters is therefore often also due to changes in V&E, which should be included in attribution studies...
Geert Jan van Oldenborgh
@gjvoldenborgh
A good example is our study of the water shortage in São Paulo in 2014/15. We found no climate signal, but the population growth and water consumption per capita had increased more than the capacity of the water system. doi.org/10.1007/s10584-021-03071-7 @FrediOtto @mkvaalst @RoopSingh
Geert Jan van Oldenborgh
@gjvoldenborgh
Of course V&E is the way to increase resilience. E.g., heat deaths can be reduced dramatically with relatively simple measures. Greenhouse gas mitigation only slows down the increase of these deadly disasters. @mkvaalst @RCClimate @RoopSingh @FrediOtto www.climatecentre.org/downloads/files/IFRCGeneva/RCCC Hea…
Geert Jan van Oldenborgh
@gjvoldenborgh
In many other studies we found strong influences of climate change on extreme weather: the precipitation of Hurricane Harvey over Houston, heat waves in Europe, bush fires in Australia. Even the drought around Cape Town had a climate change signature.
-
Geert Jan van Oldenborgh reposted
Wim Thiery
@WimThiery
Indeed, as far as I can tell not a single CMIP5 model accounts for irrigation. Simulations with CESM suggest that irrigation alleviated hot day warming (www.nature.com/articles/s41467-019-14075-4). In CMIP6, 3 models now account for irrigation, so still only a small subset: meetingorganizer.copernicus.org/EGU21/EGU21-675.html
-
Geert Jan van Oldenborgh reposted
Prof. Katharine Hayhoe
@KHayhoe
Maternal exposure to air pollution doubles subsequent risk of asthma to children. Add that to the 9M premature deaths per year due to particulate air pollution from burning fossil fuels alone and I'd say the immediate benefits of clean energy are obvious. www.theguardian.com/environment/2021/may/21/asthma-in-tod…
-
Geert Jan van Oldenborgh
@gjvoldenborgh
One point of detection & attribution is that it compares modelled trends with observed ones. Climate change is now strong enough that this often gives very useful information, eg on whether all relevant mechanisms are included in the climate models ... doi.org/10.1007/s10584-021-03071-7
Post not available here, view on X
Geert Jan van Oldenborgh
@gjvoldenborgh
And of course a famous example is the heat in the eastern US during the dust bowl, that can be explained by land use and irrigation changes that again are sometimes not yet properly included in climate models, cf maps of max Tmax trends. Cowan et al, doi.org/10.1038/s41467-020-16676-w
Geert Jan van Oldenborgh
@gjvoldenborgh
Attribution studies using our methods will show when we can trust climate models and when not to simulate past trends in extremes, and hence increase or decrease our trust in their projections. Paper doi.org/10.1007/s10584-021-03071-7, blog www.worldweatherattribution.org/pathways-and-pitfalls-in-… @FrediOtto @RobertVautard
Geert Jan van Oldenborgh
@gjvoldenborgh
There are also many examples where observed and modelled trends agree, but these are less interesting scientifically...
-
Geert Jan van Oldenborgh reposted
Lonni Besançon 🇫🇷 🇸🇪
@lonnibesancon
Our open letter about academic whistleblowers like
@MicrobiomDigest is mentioned in @guardian by @MelissaLDavey
You can find the letter here: osf.io/2awsv/
Scientists co-sign it here: docs.google.com/forms/d/e/1FAIpQLSf7AihOkHBUYLeUg6S04BCgC……
The article is here theguardian.com/science/2021/may/22/world-expert-in-scien… -
Geert Jan van Oldenborgh
@gjvoldenborgh
Ja, serieuze omslag. www.nrc.nl/nieuws/2021/05/21/olieconcerns-staan-nu-van-al…
-
Geert Jan van Oldenborgh
@gjvoldenborgh
Indeed, but people want to know future trends of extremes and in principle the physics and parametrisation of suitable models should be able to answer this. We verify whether they had the correct statistics, physics and trend in the past to in/decrease confidence in projections.
mtobis
@mtobis
One concern is that even IF a given model gets the disaster phenomenon right AND the relevant ambient trends right, it’s STILL asking a lot for the model to get the TREND in disaster events right.
-
Geert Jan van Oldenborgh reposted
Gianpaolo Balsamo
@gpbalsamo
Inspiring closure of @ClimateExp0 that gathered loads of ideas & a truly amazing participation.
There now are 163 days to @COP26 📆 in Glasgow & fingers crossed it will be an in person meeting🤞
👉 ukcop26.org
I 💯%❤️ the 4-point synthesis by Dr Edwards @flimsin👇
UK Universities Climate Network
@UKClimateUnis
And that's a wrap on #climateexp0 🎉 Over 5 days we've seen:
🗣️ 700+ live + pre-recorded presentations
🌍 Contributors from 40+ countries
💻 Over 5300 attendees, from 150+ countries
All across 5 core themes on #climatechange #science + #policy ahead of @COP26 [thread] 👇 -
Geert Jan van Oldenborgh
@gjvoldenborgh
A more insidious problem is changes in observational methods or surroundings. In De Bilt the thermometer was moved from a non-standard hut in a sheltered location to a standard one in an open field in 1951. The open field is several degrees cooler on hot days…
Geert Jan van Oldenborgh
@gjvoldenborgh
... This has been corrected for but other stations have not, in spite of major efforts. City parks hot temperature extremes seem more sensitive to lawn sprinkling schedules than climate change. We always inspect time series for suspicious jumps and trends. doi.org/10.1007/s10584-021-03071-7
-
Geert Jan van Oldenborgh
@gjvoldenborgh
Another problem is missing data. A time series with 30% missing in the 1970s and none now will miss early extremes. If the missing data is randomly distributed (the observer did not skip the hottest days) this gives a spurious probability ratio of 1/.7~1.4 doi.org/10.1007/s10584-021-03071-7
-
Geert Jan van Oldenborgh
@gjvoldenborgh
Observations are essential for attribution but can also have issues. Misplaced decimal points are common. For some studies we checked all precipitation extremes against satellites and newspapers. One time series had data 10x too low and a peak 10x too high doi.org/10.1007/s10584-021-03071-7
-
Geert Jan van Oldenborgh
@gjvoldenborgh
No, so we do the next best thing and compare physics-based computer models of the earth and this counterfactual world to compute the influence of climate change on extreme weather. After verifying that the extremes in the model are similar to those in the observations.
Timothy J Dunkerton
@tim_dunkerton
There is no Planet B against which the effects of increasing GHGs can be evaluated in a controlled laboratory setting.
-
Geert Jan van Oldenborgh reposted
EUMETSAT
@eumetsat
Witness last year’s major weather events in our new 2020 Year of Weather video 🌍 Thanks to international cooperation with our partners, we've got a full view of the entire planet in what was an exceptionally active year for the North Atlantic. Watch here: www.youtube.com/watch?v=GKFzL2XB9Ow
-
Geert Jan van Oldenborgh
@gjvoldenborgh
Here in the Netherlands more than half of new bikes sold are e-bikes now. Of course we have a decent bicycling infrastructure, that helps.
Brent Toderian
@BrentToderian
The “E-Bike Effect:” Those who bought e-bikes increased average daily bicycle use from 2.1km (1.3 miles) to 9.2km (5.7 miles), a 340% increase. The e-bike's share of all their transportation increased dramatically too; from 17% to 49%. Via @Treehugger www.treehugger.com/e-bikers-ride-much-farther-and-more-fr…
-
Geert Jan van Oldenborgh
@gjvoldenborgh
No., you are misleading your audience. Climate models are good at simulating the average weather. The global mean temperature was predicted well from the 1980s onward, seasonal continental means are realistic. I only claim that very rare extremes are not always represented well.
zerobuoyancy
@zerobuoyancy
Problems with extreme temperature and extreme precipitation means problems in climate models with the hydrological cycle. That's one of the two core components of our climate (the other one is radiative transfer). Climate models are still not up to the task.
Geert Jan van Oldenborgh
@gjvoldenborgh
Extreme heat is also difficult to represent correctly in a climate model. To start with, some old models just show unphysical temperatures, up to 70-80ºC daily max near-surface air temperatures. These cannot be used for attribution (or projections) of heat doi.org/10.1007/s10584-021-03071-7
-
Geert Jan van Oldenborgh
@gjvoldenborgh
Extreme heat is also difficult to represent correctly in a climate model. To start with, some old models just show unphysical temperatures, up to 70-80ºC daily max near-surface air temperatures. These cannot be used for attribution (or projections) of heat doi.org/10.1007/s10584-021-03071-7
-
Geert Jan van Oldenborgh
@gjvoldenborgh
An interesting aspect of Extreme Event Attribution is that it entails a comparison of climate models to reality. This does not always go well. Many CMIP5 models have an upper bound on daily precipitation of ~200 mm/dy, lower than observed in Chennai 2015. doi.org/10.1007/s10584-021-03071-7
-
Geert Jan van Oldenborgh
@gjvoldenborgh
Hier het gemiddelde dagnummer waarop de hoogste daggemiddelde temperatuur valt in ERA-interim. Precies wat Peter zegt: eerder in continentale gebieden (en nog vroeger in moesson gebieden), later aan de kust en nog later boven de oceaan.
-
Geert Jan van Oldenborgh reposted
KNMI
@KNMI
Komt dit weer nou door #klimaatverandering? Deze vraag krijgen wij vaak na extreme droogte, hitte of neerslag. Sinds enkele jaren kan de wetenschap deze vraag steeds vaker en steeds sneller beantwoorden, dankzij @wxrisk o.l.v. het KNMI. www.knmi.nl/over-het-knmi/nieuws/snelle-duiding-van-extre… #klimaatbericht
-
Geert Jan van Oldenborgh reposted
Karin van der Wiel
@karin_vdwiel
Five years ago I accidentally joined the @wxrisk attribution of Louisiana's downpours. Since then, the group learned a lot about doing effective extreme attribution studies.
These lessons are now detailed in a new paper by @gjvoldenborgh et al. ➡️ link.springer.com/article/10.1007/s10584-021-03071-7 1/3 -
Geert Jan van Oldenborgh reposted
Andrew King 🌈
@AndrewKingClim
After many event attribution analyses we have learnt some lessons on how to study extreme events and the challenges in identifying and analysing events (led by @gjvoldenborgh) link.springer.com/article/10.1007%2Fs10584-021-03071-7
-
Geert Jan van Oldenborgh reposted
Dr Friederike Otto
@FrediOtto
Experience from over 30 extremes & working with great colleagues across the world made extreme event attribution a powerful tool to understand the role of climate change in today's weather & disentangle other drivers of disasters. @makrishna @KimtaiJoy @RobertVautard @RoopSingh
Carbon Brief
@CarbonBrief
NEW - Guest post: Lessons learned from five years of extreme weather ‘rapid attribution’ | @FrediOtto @gjvoldenborgh @karin_vdwiel @mkvaalst
Read ➡️ www.carbonbrief.org/guest-post-lessons-learned-from-five-… -
Geert Jan van Oldenborgh
@gjvoldenborgh
The results are much more useful with attention paid to all steps. Many of these findings are also applicable to climate change projections and seasonal and decadal forecasts I think.
@FrediOtto @RobertVautard @karin_vdwiel @RoopSingh @mkvaalst @makrishna -
Geert Jan van Oldenborgh
@gjvoldenborgh
Lots of details and examples in the scientific paper. How does the event definition affect the results? What is the effect of missing data? Do climate models represent extreme precipitation and temperature well? Does extreme precipitation always increase? doi.org/10.1007/s10584-021-03071-7
-
Geert Jan van Oldenborgh
@gjvoldenborgh
4 check which models represent the event realistically,
5 compute the change in probability in these models,
6 synthesise the model and observational results,
7 consider the changes in vulnerability & exposure that also contributed to the impacts,
8 communicate the results. -
Geert Jan van Oldenborgh
@gjvoldenborgh
Our main finding over the years is that the actual attribution step is only one of many. We also had to
1 decide which events to analyse,
2 define the event so that the results are most useful,
3 compute how rare the event was and the change in observations,
... -
Geert Jan van Oldenborgh
@gjvoldenborgh
In line with our usual communication strategy we have three publications:
- the thoroughly reviewed scientific paper doi.org/10.1007/s10584-021-03071-7,
- an easier to read blog post www.worldweatherattribution.org/pathways-and-pitfalls-in-…,
- a shorter CarbonBrief guest post www.carbonbrief.org/guest-post-lessons-learned-from-five-….
And more tweets... -
Geert Jan van Oldenborgh
@gjvoldenborgh
In 2015 World Weather Attribution did its first analysis, a heat wave in Paris where we just had our first meeting. Since then we investigated the connection between 30 extreme events and climate change. The lessons learned have now been published in 3 forms... @FrediOtto @wxrisk
-
Geert Jan van Oldenborgh reposted
Carbon Brief
@CarbonBrief
NEW - Guest post: Lessons learned from five years of extreme weather ‘rapid attribution’ | @FrediOtto @gjvoldenborgh @karin_vdwiel @mkvaalst
Read ➡️ www.carbonbrief.org/guest-post-lessons-learned-from-five-… -
Geert Jan van Oldenborgh reposted
Littlewisehen
@littlewisehen
Schrödingers Pasta…
-
Geert Jan van Oldenborgh reposted
Martien Visser
@BM_Visser
De productie van elektriciteit in NL met zon+wind, gas en kolen. Per dag, sinds 2014. Inclusief records.
De kerncentrale Borssele, niet in de figuur, produceert bijna 12000 MWh/dag.
#grafiekvandedag -
Geert Jan van Oldenborgh
@gjvoldenborgh
I hope this is correct.
-
Geert Jan van Oldenborgh
@gjvoldenborgh
In summer there is no Arctic amplification: the Arctic is full of melting ice at 0ºC warming more slowly than further south. In winter the main effect is advection of less cold air in cold outbreaks. At jet height the temperature contrast increases, cancelling the ground level AA
Geert Jan van Oldenborgh
@gjvoldenborgh
I would argue that the effect of Arctic amplification on midlatitude weather is pretty sure by now: no effect on the circulation and a big warming effect on cold outbreaks in winter due to warmer advected air. This is clearly visible in the obs. See references in my earlier tweet
-
Geert Jan van Oldenborgh
@gjvoldenborgh
No, her ideas have been thoroughly disproven.
-
Geert Jan van Oldenborgh
@gjvoldenborgh
There have been many publications disproving more jet meandering. However, it is a very convenient story to counter climate change deniers when there is a cold wave, so it lives on in the popular media See eg doi.org/10.1002/wcc.337 doi.org/10.1088/1748-9326/ab4867 doi.org/10.1038/s41558-019-0551-4
dr. Jos PhD
@weerrecords
@gjvoldenborgh FYI www.sciencemag.org/news/2021/05/landmark-study-casts-doub… & @MichielvanWeele "the models also found no coherent sign of a second proposed effect of reduced sea ice: more frequent disruptions of the stratospheric polar vortex"
-
Geert Jan van Oldenborgh reposted
Thomas Rackow 🧊
@thomas_rackow
Animated version of Gulf Stream sea surface temperatures done with @oceanographer from yesterday - inspired by the moving media #art installations @refikanadol ! Shading and texture comes from simulated zonal currents #sciart @neuro_rish @matplotlib #fesom2
-
Geert Jan van Oldenborgh
@gjvoldenborgh
Great work. Are they going to be integrated into other databases, such as ECA&D? They would be even more useful extended to the present.
Ed Hawkins
@ed_hawkins
After a year of continued effort by a small team of volunteers we can now release the data!
Rainfall Rescue dataset v1.0.0:
doi.org/10.5281/zenodo.4754575
3.3 million observations have been quality controlled, and combined into time series from 8485 rain gauges from 6095 locations. -
Geert Jan van Oldenborgh
@gjvoldenborgh
I think the only reason the Climate Explorer (climexp.knmi.nl) is still alive is that was never funded but a Friday afternoon hobby, so it could not be discontinued. I assumed it would be surpassed by professional teams a long time ago, you mention why that did not happen
Bilal A. Mateen
@Bilal_A_Mateen
Is it useful to see a "funder" say this out loud? If so, where would it be most useful to see this (I'm assuming no-one wants to cite this twitter thread in their case for support)? And what am I missing - or in other words, what else would it be useful for "us" to acknowledge.
-
Geert Jan van Oldenborgh
@gjvoldenborgh
Next week will again be cold for the time of year here in the Netherlands, mainly in the maximum temperature. Can we please get a bit of the Russian heat? Just get rid of the Greenland block that has been there since early April, now complemented by low pressure over Scandinavia.
-
Geert Jan van Oldenborgh
@gjvoldenborgh
We found very fast rising temperatures of winter extremes almost everywhere in doi.org/10.1088/1748-9326/ab4867. Due to Arctic amplification the air coming south is just not as cold as it used to be in Arctic air outbreaks. And no, Arctic amplification does not make the jet stream meander
Zeke Hausfather
@hausfath
Lets be careful about attributing extreme winter events to climate.
The link to heat waves and extremes, as well as declining frequency of cold extremes, is unambiguous. But the connection between warming and the type of cold snap we saw in Texas in Feb is much more ambiguous. -
Geert Jan van Oldenborgh
@gjvoldenborgh
Wat gebruiken jullie nu?
-
Geert Jan van Oldenborgh
@gjvoldenborgh
So true and not only for Hispanics. I had to consolidate six names to gather all my publications in Scopus. And an Indonesian co-author with only a single name causes no end of problems.
-
Geert Jan van Oldenborgh
@gjvoldenborgh
Yes. Note that this is from a very early atmosphere-only climate model, with the heat flux into the ocean as tuning parameter and curves hand-drawn. Real model output from 1984 is high compared to the observations due to too high forcings, especially CFCs www.realclimate.org/index.php/archives/2018/06/30-years-a…
-
Geert Jan van Oldenborgh
@gjvoldenborgh
I just realised I had not aligned the graphs correctly, here a better version.
Geert Jan van Oldenborgh
@gjvoldenborgh
A more recent graph shows that global warming continued in line with the standard century-old theory based on greenhouse gases, here in Hansen et al, 1981, before the rise was actually observed in the station data. www.realclimate.org/index.php/climate-model-projections-c…
-
Geert Jan van Oldenborgh
@gjvoldenborgh
They predicted no further global warming from 2000 or so onward, which is contradicted by the facts. Their correlation also broke down after publication of the theory, which points to a coincidence rather than a physical connection. See skepticalscience.com/cosmic-rays-and-global-warming-advan… for an explainer.
Hajo Smit
@hajosmit
Nobody ever predicts global cooling based on a months anomaly. We do it based on the hard proof provided by Svensmark and Nir Shaviv. Both still waiting for the Nobel prize. A science prize that is. Not the flut peace prize the climate alarmists once were awarded.
Geert Jan van Oldenborgh
@gjvoldenborgh
Plot of the day: Copernicus ERA5 global mean 2m temperature. April is below the trend, but warmer than March. Which shows that the monthly time scale is too short to study trends. Anybody who predicted global cooling based on January 2008 was quickly proven wrong.
Geert Jan van Oldenborgh
@gjvoldenborgh
A more recent graph shows that global warming continued in line with the standard century-old theory based on greenhouse gases, here in Hansen et al, 1981, before the rise was actually observed in the station data. www.realclimate.org/index.php/climate-model-projections-c…
-
Geert Jan van Oldenborgh reposted
Nieuwsuur
@Nieuwsuur
Wetenschappers die veel naar buiten treden worden geïntimideerd en bedreigd. De Vereniging van Universiteiten werkt nu aan een plan om hen te steunen. Vrouwelijke wetenschappers @L_deJonge, @MarionKoopmans en @CatherineDVries vertellen over hun ervaringen. #nieuwsuur
This media couldn't be displayed. See it on the original post. -
Geert Jan van Oldenborgh
@gjvoldenborgh
Hier ook. Onacceptabel.
Bart Verheggen
@BVerheggen
Diezelfde dynamiek is ook terug te zien in het maatschappelijke klimaatdebat.
Vrouwelijke wetenschappers hebben het harder te verduren dan hun mannelijke collega's.
www.scientificamerican.com/article/as-climate-scientists-… -
Geert Jan van Oldenborgh
@gjvoldenborgh
Plot of the day: number of days in May with snow reported at at least one of the ~330 volunteer 8-8 precipitation stations, i.e. at 10am local summer time. Rare but happens every now and then, more frequently in the old days. Note that yesterday all snow had melted by 10 o’clock
-
Geert Jan van Oldenborgh
@gjvoldenborgh
My non-animated version (not so good at making movies).
dr sarah 🌎🔥🌈💦
@FataMorgana_LS
The escalator is still going up.
(2016 version)
www.youtube.com/watch?v=xWdJuNYLTLs -
Geert Jan van Oldenborgh
@gjvoldenborgh
See klimaatveranda.nl/2018/02/12/global-cooling-de-verschrikk… and www.knmi.nl/over-het-knmi/nieuws/hoe-zijn-oude-klimaatvoo… (in Dutch but easily machine-translatable or just follow the links) for amusing lists of failed predictions of global cooling from that time.
Geert Jan van Oldenborgh
@gjvoldenborgh
Plot of the day: Copernicus ERA5 global mean 2m temperature. April is below the trend, but warmer than March. Which shows that the monthly time scale is too short to study trends. Anybody who predicted global cooling based on January 2008 was quickly proven wrong.
-
Geert Jan van Oldenborgh reposted
Dr Friederike Otto
@FrediOtto
Prolonged Siberia heat study now peer-reviewed. Numbers are unchanged, prose is much nicer. A staggering example of just how much of a game changer climate change is on heat.
link.springer.com/article/10.1007/s10584-021-03052-w -
Geert Jan van Oldenborgh
@gjvoldenborgh
Dank! Vraagje: als er plm twee keer meer zonPV komt kunnen we de dagelijkse gang niet meer met variaties in aardgas opvangen. Wanneer verwacht je dat en is er dan genoeg opslag naar de avond? Ik zie nu slechts ~10% "opslag" via import en export (stuwmeren Noorwegen?).
Martien Visser
@BM_Visser
Wat vrolijke kleurtjes richting het weekend😀: De gemiddelde NL elektriciteitsmix over de dag in april 2021. Inclusief gemiddelde prijs ('day ahead') en CO2-emissie (beide rechter-as) #grafiekvandedag
-
Geert Jan van Oldenborgh
@gjvoldenborgh
The official Copernicus C3S discussion with maps is at climate.copernicus.eu/surface-air-temperature-april-2021
Geert Jan van Oldenborgh
@gjvoldenborgh
Plot of the day: Copernicus ERA5 global mean 2m temperature. April is below the trend, but warmer than March. Which shows that the monthly time scale is too short to study trends. Anybody who predicted global cooling based on January 2008 was quickly proven wrong.
-
Geert Jan van Oldenborgh
@gjvoldenborgh
Plot of the day: Copernicus ERA5 global mean 2m temperature. April is below the trend, but warmer than March. Which shows that the monthly time scale is too short to study trends. Anybody who predicted global cooling based on January 2008 was quickly proven wrong.
-
Geert Jan van Oldenborgh reposted
Reto Knutti
@Knutti_ETH
1/ The wind is shifting in global climate action.
Assuming full implementation of all net zero targets announced or under discussion, global warming by 2100 could be as low as 2.0°C.
climateactiontracker.org/publications/global-update-clima… -
Geert Jan van Oldenborgh
@gjvoldenborgh
Plot of the day: observed April temperature in Europe (E-OBS prelim). 1. Anomalies relative to the 1991-2020 normals, 2. Rank of April 2021 in the 1920-2021 dataset. Historically, not very cold, feels cold because we have gotten used to much warmer springs over the last decades.
Geert Jan van Oldenborgh
@gjvoldenborgh
-
Geert Jan van Oldenborgh reposted
Dr Friederike Otto
@FrediOtto
Job opportunity - work with me here @ecioxford and the amazing @wxrisk team and @TheOxfordSLP on one of the most exciting climate science initiatives in the world
my.corehr.com/pls/uoxrecruit/erq_jobspec_details_form.job… -
Geert Jan van Oldenborgh reposted
Rubert Konijn
@rubertkonijn
Geert Jan has been dedicated to climate science, inspiring others with his work on climate attribution, and by developing the KNMI Climate Explorer he played a crucial role in access to climate data for everyone. Congratulations on this well-deserved award, Sir @gjvoldenborgh
-
Geert Jan van Oldenborgh
@gjvoldenborgh
The idea behind relative Niño3.4 / ONI is that the higher tropical SST decreases the temperature contrast with the Niño3.4 SST and hence convection is suppressed regardless of the source of the heating, because the atmosphere reacts quickly enough in setting a warmer profile.
Eric Webb
@webberweather
When heat is released by El Niño, it raises temperatures in the tropics by an entire degree or so in a matter of months before cooling again. This happens on time scales that arent representative of climate change >> relative ONI may be subtracting out noise signals in many cases
Geert Jan van Oldenborgh
@gjvoldenborgh
It would be easy to check this by computing these profiles in the 20CRv3 reanalysis and measuring the adjustment times.
Unfortunately I am too ill at the moment to do that, so I leave it as an exercise for a student... -
Geert Jan van Oldenborgh reposted
Dr Friederike Otto
@FrediOtto
feels weird, but, no 270 on a hot list is actually something to be proud of if you are a woman & only published your first paper less than 9 years ago...
ECI, Univ of Oxford
@ecioxford
ECI's Myles Allen, Jim Hall, @ymalhi , Michael Obersteiner and @FrediOtto are listed in the 2021 ‘Reuters Hot List’ of top climate scientists 📣🌎 www.reuters.com/investigates/special-report/climate-chang…
-
Geert Jan van Oldenborgh
@gjvoldenborgh
Here a phase diagram of the old Niño3.4 index against the relative one. The only signal is really a shift towards higher temperatures, the ENSO events are very much straight lines so there is no indication of big El Niño's being treated different from small ones or La Niña's...
Eric Webb
@webberweather
There's no better example of relative ONI subtracting out interannual noise signals than the 1877-78 "Super" El Nino. Using a relative ONI method, you're assuming that the basic state climate during the height of 1877-78 was analogous to the late 20th century. I'm not buying that
Geert Jan van Oldenborgh
@gjvoldenborgh
Except that they are ended a bit earlier because tropical SST rise in general with a delay, so the temperature difference is smaller on the downward slope. Which may well be a good thing.
-
Geert Jan van Oldenborgh
@gjvoldenborgh
Dat klopt, maar de signaal-ruis verhouding in wind is vrij slecht en je krijgt pas significante trends op 100 jaar data of meer. Het enige dat dan overblijft is een verschuiving naar meer westenwind in de winter, die we al in 2000 vonden. ...
Geert Jan van Oldenborgh
@gjvoldenborgh
In tegenstelling daarmee is de trend naar meer zuidenwind in de zomer niet statistisch significant en ook niet consistent met klimaatmodellen, die juist een trend naar meer noordenwind simuleren. (Dat kan ook een modelfout in de respons op het SST warming hole zijn natuurlijk.)
-
Geert Jan van Oldenborgh reposted
Andrew Dessler
@AndrewDessler
In reality, the phase out of CFCs in the 1990s was so cheap and easy that no one noticed. It was even cheaper than the most optimistic predictions.
That's also true of acid rain — solving that was also far cheaper than even the optimists expected. -
Geert Jan van Oldenborgh
@gjvoldenborgh
We found that 20S-20N SST is much smoother han Niño3.4 SST, so you hardly adds any noise. Temporal smoothing just complicates the definition and changes values after the fact, so is not as easy to use.
...
Eric Webb
@webberweather
...and I'm not sure if you use temporal filtering when subtracting from tropical SST. I'm concerned about this the most because subtracting from instantaneous tropical SSTs may mean you're subtracting from noise/wx variability at times and not actual basic state climate changes.
Geert Jan van Oldenborgh
@gjvoldenborgh
More theoretically, the basic question is on what time scale the tropical atmosphere stratification adjusts to SST changes and hence whether the weather noise (or its pattern) also affects ENSO. I do not have the answer to that, but in practice it does not appear to be a problem.
-
Geert Jan van Oldenborgh
@gjvoldenborgh
Yes, because tropical SST also ha an ENSO component the amplitude would decrease using a simple relative SST. However, it is not difficult to add in the inverse of this damping, restoring the amplitude of Niño3.4 and other indices, see section 4, last paragraph and the blog fig.
Eric Webb
@webberweather
I thoroughly enjoyed your recent publication on this and think the relative ONI is a novel concept. The only concerns I had were subtracting against global tropics SST which caused some possible overdamping of ENSO events (which you noted)...
-
Geert Jan van Oldenborgh
@gjvoldenborgh
On our paper on a way to separate ENSO and global warming better. The current definitions of El Niño and La Niña are skewed by global warming so El Niño events look larger than they really are and La Niña events smaller. The admixture also gives spurious teleconnections.
NOAA Climate.gov
@NOAAClimate
The tropical Pacific Ocean is warming up! What does that mean for the way we measure the El Niño-Southern Oscillation (ENSO)? The latest ENSO Blog suggests it's time to start looking at relative sea surface temperatures. climate.gov/news-features/blogs/enso/enso-running-fever-o…
Geert Jan van Oldenborgh
@gjvoldenborgh
PS I was not allowed to comment on the first paragraphs by the blog author (and very active co-author of the underlying paper). Thanks Michelle!
-
Geert Jan van Oldenborgh
@gjvoldenborgh
The data were collected by Gerard van der Schrier from Météo France and ARPA Piemonte.
Linh Nhat Luu
@linhnluu
Which observations dataset is this? @gjvoldenborgh
-
Geert Jan van Oldenborgh
@gjvoldenborgh
However, the limited data do not allow me to estimate how much the rains intensified, the best fit is 15% but the 90% CI starts at 0%. The return period is also uncertain, at least hundreds of years in this exact location, much less for similar events throughout the Sea Alps.
Geert Jan van Oldenborgh
@gjvoldenborgh
The Copernicus Climate Change Service European State of the Climate is out. I did a quick analysis of the rainfall associated with storm Alex in SE France and adjoining Italy and found a significant intensification of observed daily extremes.climate.copernicus.eu/esotc/2020/storm-alex @RobertVautard
Geert Jan van Oldenborgh
@gjvoldenborgh
Technical detail: I wondered how the highest amount of rain could have been observed a few km downwind of the main crest of the Sea Alps at Limone. Turned out the station was moved to the top of a skiing lift and is now practically on top of that crest above the Colle di Tenda...
-
Geert Jan van Oldenborgh
@gjvoldenborgh
The Copernicus Climate Change Service European State of the Climate is out. I did a quick analysis of the rainfall associated with storm Alex in SE France and adjoining Italy and found a significant intensification of observed daily extremes.climate.copernicus.eu/esotc/2020/storm-alex @RobertVautard
-
Geert Jan van Oldenborgh
@gjvoldenborgh
First look at April NH T2m and circulation anomalies. Up to 4ºC cold anomalies in my part of the world and further into central Europe, caused by northerly flows due to a ridge over Greenland. Can someone who knows more about meteorology comment why the flow is not barotropic?
-
Geert Jan van Oldenborgh
@gjvoldenborgh
Some first thoughts & analysis on the cold first half of April here in the Netherlands with @seltini (in Dutch). @KNMI @RobertVautard
-
Geert Jan van Oldenborgh reposted
KNMI
@KNMI
Aprilletje zoet heeft zelden nog een witte hoed. Het was negentiende eeuws weer de eerste helft van #april: www.knmi.nl/over-het-knmi/nieuws/aprilletje-zoet-heeft-ze… #klimaatbericht
-
Geert Jan van Oldenborgh reposted
Karin van der Wiel
@karin_vdwiel
Nieuw @KNMI #klimaatbericht: De productie van zonne-energie heeft een veel bredere seizoenspiek dan zonneschijn. April is (gemiddeld) een heel goede productie maand! Hoe komt dit?
Op basis van productiedata van enkele 'random' daken in Nederland 😄.
➡️www.knmi.nl/over-het-knmi/nieuws/zonne-energie-loopt-voor… -
Geert Jan van Oldenborgh
@gjvoldenborgh
The current European cold period in perspective. The chilly weather here in the first half of April is caused by a ridge over Greenland, but not very extreme even compared to the warm 1991-2020 normal. Frost does damage unprotected fruit flowers. ECMWF analyses, forecast wrt ERA5
-
Geert Jan van Oldenborgh
@gjvoldenborgh
But only if you did not mind a unphysical jump at the beginning of the interval. We should have countered requiring continuity and using change point analyses much earlier, before @rahmstorf pointed this out. That would have solved the problem in AR5. Hindsight is so nice.
-
Geert Jan van Oldenborgh
@gjvoldenborgh
I know. And then when the signal emerged from the noise it turned out be so embarrassingly linear in most aspects...
LOL@TXwitterFASCIST
@stphrolland
Just to react on your "20 years ago"...
In those times, when talking about climate change at work, my colleagues, when they were not laughing, were saying, with high confidence & self esteem:
"you cant imagine how hard it is to disturb a complex system".
That was the norm. -
Geert Jan van Oldenborgh reposted
Zeke Hausfather
@hausfath
That said, 2021 will be completely consistent with the long-term warming trend the world has experienced over the past 40 years. Some years will be slightly warmer and some slightly cooler, but the long-term warming is undeniable.
-
Geert Jan van Oldenborgh
@gjvoldenborgh
I find SPM.10 a very useful one. Your updated version of TS.14 is also showing that predictions are verifying. Finally Fig.10.5 as a simple overview of forcings. And of course all the Atlas plots :-).
Ed Hawkins
@ed_hawkins
Climate graphics survey: which figures from IPCC AR5 WGI SPM/TS or IPCC SR1.5 do you find most useful for discussing climate change with broad audiences?
AR5 SPM graphics: www.ipcc.ch/report/ar5/wg1/summary-for-policymakers/
AR5 TS graphics: www.ipcc.ch/report/ar5/wg1/technical-summary/
SR1.5 graphics: www.ipcc.ch/sr15/graphics/ -
Geert Jan van Oldenborgh
@gjvoldenborgh
My Climate Explorer won the EMS Technology Award 2021. When I made the site public over 20 years ago, one of my goals was to give climate researchers all over the world access to climate data and analysis tools. I am happy it has succeeded in that.
www.emetsoc.org/ems-technology-award-2021-for-geert-jan-v… @KNMI -
Geert Jan van Oldenborgh
@gjvoldenborgh
I am afraid I found an error in the KNMI snow data in 1961–1967. Here is the corrected graph. The decrease is less spectacular but still very significant.
Geert Jan van Oldenborgh
@gjvoldenborgh
Plot of the day: number of days with snow reported at one or more of the 300+ voluntary observing stations in the Netherlands in April. The snow this morning is not yet included. Snow in April used to be quite common but has become rare. No surprise there.
-
Geert Jan van Oldenborgh
@gjvoldenborgh
Today’s daily mean temperature anomalies (ECMWF forecast wrt thx 1991-2020 ERA5 climatology). Spring is early in Canada but we have a cold outbreak in Europe.
-
Geert Jan van Oldenborgh
@gjvoldenborgh
Dit zijn de handmatige waarnemingen van de vrijwilligers die elke morgen de neerslag doorgeven. Het enige dat veranderd is, is de codering. Ik heb voor de recente waarnemingen ook de oude codering gebruikt om de reeksen homogener te maken.
Harry Geurts
@Harry_Geurts
Heel interessant. Wat een afname. Automatisering van de waarnemingen kan ook meespelen.
-
Geert Jan van Oldenborgh
@gjvoldenborgh
Plot of the day: number of days with snow reported at one or more of the 300+ voluntary observing stations in the Netherlands in April. The snow this morning is not yet included. Snow in April used to be quite common but has become rare. No surprise there.
Geert Jan van Oldenborgh
@gjvoldenborgh
This is not an official observation, but we are still working from home so it’s all I have.
-
Geert Jan van Oldenborgh
@gjvoldenborgh
And never ever look back at your failed predictions. www.knmi.nl/over-het-knmi/nieuws/hoe-zijn-oude-klimaatvoo…
Juha Riissanen
@juhariis
Certain ppl pick latest measured mth & slide start of a linear fit back until just before slope turns positive
No talk abt fit conf/pred limits naturally
Some even use KNMI climexp portal wavelet magic to *prove* that now the natural cycle changes and warming turns to cold -
Geert Jan van Oldenborgh
@gjvoldenborgh
It was a few weeks ago, I am just in a bad mood.
Zeke Hausfather
@hausfath
I assume our friends at GWPF? I just saw @gjvoldenborgh's tweet, so I'm not sure he is responding to this time around.
-
Geert Jan van Oldenborgh
@gjvoldenborgh
I hate this damn machine
I wish that they would sell it
It never does what I want it to
But only what I tell it.
(Ancient lore.)
Ryan Burgess
@burgessdryan
What’s one piece of advice you wish you got when you started coding?
#codenewbie #100daysofcode -
Geert Jan van Oldenborgh
@gjvoldenborgh
Not "skeptic", just "denying". "Propaganda" or plain "lying" are also appropriate words I think.
Zeke Hausfather
@hausfath
I see we are already in the "no warming since 2016" stage of bad climate skeptic takes...
Geert Jan van Oldenborgh
@gjvoldenborgh
The difference between climate science, which takes all data into account and attempts to approximate the truth out there, and climate propaganda, which cherry-picks bits and pieces that fit an ideology and leaves out all other inconvenient facts (green lines eyeballed by me).
-
Geert Jan van Oldenborgh reposted
Ed Hawkins
@ed_hawkins
Reminder: climate change is no April fool's joke.
We are warming the climate at an unprecedented rate, due to the burning of fossil fuels and deforestation. -
Geert Jan van Oldenborgh
@gjvoldenborgh
From a physical science point of view, I think understanding heat waves better and their large impacts would be my priority. You even see their peak in excess mortality next to covid in the Netherlands. Positive: their strong dependence on local factors makes mitigation possible.
Dr. Robert Rohde
@RARohde
Some answers might include basic climate science, but also areas like energy policy, mitigation, or adaptation, as well as efforts to translate existing science into more useful forms.
If you had money for "science" and wanted to help address climate change, where do you focus? -
Geert Jan van Oldenborgh
@gjvoldenborgh
The difference between climate science, which takes all data into account and attempts to approximate the truth out there, and climate propaganda, which cherry-picks bits and pieces that fit an ideology and leaves out all other inconvenient facts (green lines eyeballed by me).
-
Geert Jan van Oldenborgh reposted
evilSolarGuy
@SolarInMASS
If I'm reading right, Europe was just short of 80% clean kWhs yesterday. That's a few hundred million humans.
-
Geert Jan van Oldenborgh
@gjvoldenborgh
In my experience these numbers are severe undercounts. The heat wave here in the Netherlands last summer had zero reported deaths but it is clearly visible in excess death graphs with about 800 deaths, of which about 80 had age <65. Source www.cbs.nl
Jeff Berardelli
@WeatherProf
Being unprepared for extreme weather made worse by climate change has real consequences. "A staggering 111 people died after millions of Texans were left w/o power for days amid an unprecedented winter storm and a record-breaking freeze." 31 in Harris co.
www.forbes.com/sites/carlieporterfield/2021/03/25/111-tex… -
Geert Jan van Oldenborgh
@gjvoldenborgh
Plot of the day: March temperature anomalies. An early spring in Japan with cherry blossom before people booked their holidays to see it, and in other parts of Asia. Normal here—it feels cold—and above normal in eastern North America North Siberia was mild a year ago but cold now
-
Geert Jan van Oldenborgh
@gjvoldenborgh
Of course there is lots of other variability there. Regarding the long-term trend however, the CMIP5 models do not have a consistent trend in wind and AMOC and SST trends are connected (Drijfhout et al, Caesar et al). Is that model error and the similar obs SST trend wind-driven?
Dr Femke de Jong 🌊
@fmkdejong
The current cold blob is not the same as the warming hole in model predictions of the future. Studies show that a lot of other processes underly the cold blob and it’s not mainly due to the AMOC doi.org/10.1146/annurev-marine-121916-063102
-
Geert Jan van Oldenborgh
@gjvoldenborgh
Iets preciezer: àls in de tropen de zwaveldamp tot in de stratosfeer komt, wordt die niet uitgewassen maar blijft hangen en door de Brewer-Dobson circulatie in 1-2 jr naar de polen vervoerd. Na een paar maanden is de SOx omgezet in zwavelzuurdruppelts die het zonlicht reflecteren
KlimaatVerandering
@klimaatVeranda
Bij een vulkaanuitbarsting komt o.a. zwavel vrij. In de tropen is de kans groter dat dit de stratosfeer (de luchtlaag boven zo'n 10-15 km) bereikt, waar de zwaveldeeltjes (aerosolen) veel langer zonlicht reflecteren en dus voor afkoeling zorgen.
(2/n)
www.knmi.nl/kennis-en-datacentrum/uitleg/vulkaanstof
-BV -
Geert Jan van Oldenborgh
@gjvoldenborgh
CMIP5 models do show a warming hole (Drijfhout et al, ERL, 2012, plotted), individual CMIP5 models and a high-resolution model also (Ceasar et al, 2018). Both are associated with AMOC weakening, and the intra-model relation between the trend in SST and trend in AMOC is good.
Geert Jan van Oldenborgh
@gjvoldenborgh
The period from 1990 is much too short to detect a trend in a series with large variability up to the decadal scale. The warming hole SST shows no trend either over that time period, see plot. You need 100+ years to detect a trend, so we need indirect data (or wait a long time).
-
Geert Jan van Oldenborgh
@gjvoldenborgh
Discussion between some oceanographers and others whether the decrease in the AMOC is really real. Indeed direct ocean observations are too short given the large variability, but indirect observations (cold blob, differential sea-level rise, models) are long enough and convincing
Post not available here, view on X
Geert Jan van Oldenborgh
@gjvoldenborgh
The period from 1990 is much too short to detect a trend in a series with large variability up to the decadal scale. The warming hole SST shows no trend either over that time period, see plot. You need 100+ years to detect a trend, so we need indirect data (or wait a long time).
-
Geert Jan van Oldenborgh
@gjvoldenborgh
We think the situation in poorer and hotter countries must be much worse, but nobody is counting the deaths or investigating impacts of heat there. The Red Cross launched a major initiative to save many lives there. Harrington and Otto doi.org/10.1038/s41558-020-0851-8 @FrediOtto @mkvaalst
Geert Jan van Oldenborgh
@gjvoldenborgh
Partly, but not enough. Even in a rich country like the Netherlands last summer's heat wave caused about 800 excess deaths. Our buildings and behaviour, though better than in 2006, are still not up to the task of protecting us from current weather, let alone future weather...
Vanessa
@V_OttoMentz
Do you think society is preparing for these shifts in the experienced weather and natural conditions that climate change is causing?
-
Geert Jan van Oldenborgh
@gjvoldenborgh
Partly, but not enough. Even in a rich country like the Netherlands last summer's heat wave caused about 800 excess deaths. Our buildings and behaviour, though better than in 2006, are still not up to the task of protecting us from current weather, let alone future weather...
Vanessa
@V_OttoMentz
Do you think society is preparing for these shifts in the experienced weather and natural conditions that climate change is causing?
-
Geert Jan van Oldenborgh
@gjvoldenborgh
The effects on the weather anyway depend on surface fluxes and hence the cold blob most. Sea level depends on deeper oceanic changes but still shows 2x faster rises in America. Models robustly show cooling of the cold blob and AMOC weakening.
Newspaper: www.nrc.nl/nieuws/2021/03/19/de-atlantische-oceaan-doet-r…
Geert Jan van Oldenborgh
@gjvoldenborgh
Discussion between some oceanographers and others whether the decrease in the AMOC is really real. Indeed direct ocean observations are too short given the large variability, but indirect observations (cold blob, differential sea-level rise, models) are long enough and convincing
-
Geert Jan van Oldenborgh reposted
Martien Visser
@BM_Visser
Verrassing? Elektrisch fietsen leidt tot minder broeikasgasemissie dan normaal fietsen.
Vanaf pakweg 2025 scoort ook de Pedelec beter, mits regelmatig opgeladen tijdens overproductie van zon en wind.
PS: fietsen is voor klimaat veel beter dan autogebruik.
#grafiekvandedag -
Geert Jan van Oldenborgh
@gjvoldenborgh
I checked that Safari, Firefox and Chrome allow one to proceed in spite of the error message. An alternative is to use the unsecured climexp.knmi.nl
Prof Hayley J. Fowler
@HayleyJFowler
@Climate_Stephen this could be a potential issue for teaching using this on Friday....
-
Geert Jan van Oldenborgh
@gjvoldenborgh
I am afraid I let the certificate of climexp.knmi.nl expire as the (unqualified) sysadmin of that server. I will try to get a new one, but as I am in hospital this may take a while.
-
Geert Jan van Oldenborgh reposted
Maarten van Aalst
@mkvaalst
Great that formal peer review has confirmed our @wxrisk analysis of the influence of climate change on the Australian bushfires. Its timely findings have already found their use in policy and practice.
@ifrc @RedCrossAU @fionatarpey @TessaSKelly
Geert Jan van Oldenborgh
@gjvoldenborgh
After a year of reviews, our Australian bushfire risk attribution study came out. The conclusions are identical to the discussion paper, the exposition has been much improved. We wrote the first version quickly to be most useful. nhess.copernicus.org/articles/21/941/2021/ @FrediOtto @RobertVautard
-
Geert Jan van Oldenborgh
@gjvoldenborgh
[I finally had time for this.] Caesar et al show that there is huge multidecadal variability in their reconstruction of the AMOC, and the 30-yr period that is studied in Worthington et al, 1984-2016, is too short to detect a trend, even if their model is much more sophisticated.
zerobuoyancy
@zerobuoyancy
Eveneens nieuwe studie over de periode waarvoor er enigszins fatsoenelijke metingen zijn om de AMOC in kaart te brengen concludeert: "A 30-year reconstruction of the Atlantic meridional overturning circulation shows no decline". doi.org/10.5194/os-17-285-2021
-
Geert Jan van Oldenborgh
@gjvoldenborgh
It was a huge group effort of the author team and the scientists thanked in the acknowledgements. Personally, I was knackered at the end of the really intense 8 weeks last year, but it was worth it. Sometimes science has to be done quickly in order to be most useful to society.
Geert Jan van Oldenborgh
@gjvoldenborgh
After a year of reviews, our Australian bushfire risk attribution study came out. The conclusions are identical to the discussion paper, the exposition has been much improved. We wrote the first version quickly to be most useful. nhess.copernicus.org/articles/21/941/2021/ @FrediOtto @RobertVautard
-
Geert Jan van Oldenborgh
@gjvoldenborgh
After a year of reviews, our Australian bushfire risk attribution study came out. The conclusions are identical to the discussion paper, the exposition has been much improved. We wrote the first version quickly to be most useful. nhess.copernicus.org/articles/21/941/2021/ @FrediOtto @RobertVautard
-
Geert Jan van Oldenborgh reposted
IPCC
@IPCC_CH
#ipcc is saddened to hear of the loss of Gemma Teresa T. Narisma, one of the authors of the Sixth Assessment Report.
IPCC Working Group I has decided to dedicate the AR6 Working Group I Atlas to Gemma Narisma in her honour.
Read more ➡️ www.ipcc.ch/2021/03/09/obituary-gemma-teresa-narisma/ -
Geert Jan van Oldenborgh reposted
KNMI
@KNMI
Door de opwarming van de aarde raakt de belangrijkste maat voor El Niño in de war. Maar er is een alternatief. Hierdoor kunnen delen van de wereld waar #elnino veel invloed heeft zich beter voorbereiden op bijv. droogte of overstromingen. www.knmi.nl/over-het-knmi/nieuws/een-betere-maat-voor-el-… #klimaatbericht
-
Geert Jan van Oldenborgh reposted
Maarten van Aalst
@mkvaalst
Door de opwarming van de aarde raakt de belangrijkste maat voor El Niño en La Niña in de war. In een nieuw wetenschappelijk artikel stellen we een alternatief voor.
Dit @KNMI klimaatbericht legt het uit.
Dank @gjvoldenborgh!
@rodekruis @FacultyITC
www.knmi.nl/over-het-knmi/nieuws/een-betere-maat-voor-el-… -
Geert Jan van Oldenborgh reposted
Karin van der Wiel
@karin_vdwiel
I refuse to accept this btw. Tough luck for the angry ones. #internationalwomensday
Geert Jan van Oldenborgh
@gjvoldenborgh
My female colleagues like @karin_vdwiel get an order of magnitude more hate mail than I get after similar articles.
Prof. Katharine Hayhoe
@KHayhoe
On #internationalwomensday, it's clear we still have a long way to go. Here's a small taste of what female scientists such as @DrAndreaDutton and @coralsncaves experience on a regular basis. Thanks to @gjvoldenborgh for the reminder to share. www.scientificamerican.com/article/as-climate-scientists-…
-
Geert Jan van Oldenborgh
@gjvoldenborgh
My female colleagues like @karin_vdwiel get an order of magnitude more hate mail than I get after similar articles.
Prof. Katharine Hayhoe
@KHayhoe
On #internationalwomensday, it's clear we still have a long way to go. Here's a small taste of what female scientists such as @DrAndreaDutton and @coralsncaves experience on a regular basis. Thanks to @gjvoldenborgh for the reminder to share. www.scientificamerican.com/article/as-climate-scientists-…
-
Geert Jan van Oldenborgh reposted
Prof. Katharine Hayhoe
@KHayhoe
On #internationalwomensday, it's clear we still have a long way to go. Here's a small taste of what female scientists such as @DrAndreaDutton and @coralsncaves experience on a regular basis. Thanks to @gjvoldenborgh for the reminder to share. www.scientificamerican.com/article/as-climate-scientists-…
-
Geert Jan van Oldenborgh
@gjvoldenborgh
ECA&D is bezig met een Europese globale straling dataset, maar die heeft nog te veel problemen om nu te publiceren. Ik heb EUMETSAT CM-SAF satellietdata van zonnestraling aan het aardoppervlak 1983-"nu", zie trend plot. Zonuren zijn minder goed gedefinieerd en vaak inhomogeen.
Geert Jan van Oldenborgh
@gjvoldenborgh
Let op: deze data bevatten ook een trend door de afname vanaf aërosolen van de jaren '80.
-
Geert Jan van Oldenborgh
@gjvoldenborgh
No idea, I can ask the aerosol specialists at KNMI.
Leon Simons 🌍
@LeonSimons8
Do you know what the impact could be of the ~80% decrease of ship SOx aerosol emissions from 2020 (and probably significantly higher black carbon emissions) from IMO 2020 regulation on the regional climate and the AMOC?
-
Geert Jan van Oldenborgh
@gjvoldenborgh
What a loss. I only met her once but was very impressed.
Team AMDG
@TeamAMDG
Rest in Peace Dr. Gemma Narisma, Executive Director of the Manila Observatory and Associate Professor at the Physics Department of the Ateneo de Manila University School of Science and Engineering.
-
Geert Jan van Oldenborgh
@gjvoldenborgh
I agree with the teacher. If you jump from a balcony you can either fall down or up, both sides should be taught to the children to prepare them for real life.
Leo Hickman
@LeoHickman
A right-wing teacher beloved by current UK govt calls for "both sides" of climate change be taught in schools.
The policy response, yes. But not the science.
How hard is this to understand?
This all feels very 1987...
(From today's Times) -
Geert Jan van Oldenborgh reposted
NU.nl
@NUnl
In Nederland merken we mogelijk nu al dat de Golfstroom zwakker wordt: op.nu.nl/3e2Mvxd
-
Geert Jan van Oldenborgh
@gjvoldenborgh
Haarsma et al, Anthropogenic changes of the thermal and zonal flow structure over Western Europe and Eastern ... Clim Dyn, 2013, doi.org/10.1007/s00382-013-1734-8
Haarsma et al, Decelerating Atlantic meridional overturning circulation main cause ... ERL, 2015, doi.org/10.1088/1748-9326/10/9/094007
Geert Jan van Oldenborgh
@gjvoldenborgh
Agreed. It also points out that up to now, the decline of the AMOC has probably lead to /higher/ temperatures in Europe. In summer high pressure develops downstream from the warming hole giving more sunshine, in winter more westerlies due to a higher Atlantic temperature gradient
Zeke Hausfather
@hausfath
The data visualization by the @nytclimate team in this AMOC article is stunning. Definitely check it out: www.nytimes.com/interactive/2021/03/02/climate/atlantic-o…
-
Geert Jan van Oldenborgh
@gjvoldenborgh
Agreed. It also points out that up to now, the decline of the AMOC has probably lead to /higher/ temperatures in Europe. In summer high pressure develops downstream from the warming hole giving more sunshine, in winter more westerlies due to a higher Atlantic temperature gradient
Zeke Hausfather
@hausfath
The data visualization by the @nytclimate team in this AMOC article is stunning. Definitely check it out: www.nytimes.com/interactive/2021/03/02/climate/atlantic-o…
-
Geert Jan van Oldenborgh reposted
Climate Centre
@RCClimate
After research by @gjvoldenborgh & incl @mkvaalst, @CoughlanClimate & others, scientists recommend 'relative ENSO forecasting' in real time to avoid distortions from #climate change; @RedCrossAU pic, depleted Somali mini-reservoir in 2017 after #laniña - www.climatecentre.org/3992/scientists-suggest-new-way-of-…
-
Geert Jan van Oldenborgh
@gjvoldenborgh
Found a significant correlation between sunspot numbers and the global mean temperature. However, it goes the other way from what theory predicts: more solar activity cools the earth!
Exercise for students: find the logic errors, the same that are used by climate change deniers.Post not available here, view on X
Geert Jan van Oldenborgh
@gjvoldenborgh
2/4. For cyclical phenomena, start at a peak and finish at a trough to maximise the trend.
3/4. Leave out other predictors that are known to have an influence, like greenhouse gases.
Geert Jan van Oldenborgh
@gjvoldenborgh
4/4. Disregard physics and all other observations, and act as if one counterexample disproves 100 years of development of a coherent theory.
Any more? -
Geert Jan van Oldenborgh
@gjvoldenborgh
De trends zijn vrijwel gelijk voor De Bilt. De sterkere opwarming van de nachttemperaturen is alleen duidelijk in de stad, in De Bilt is het effect van de stadswarmte ~0.1 ºC (zie bv www.knmi.nl/kennis-en-datacentrum/achtergrond/warmte-eila…). Soms zien we ook een sterkere trend in Tmax door minder verdamping.
🇳🇱 Arjan Ommering™
@arjanommering
Ha! Dank voor je antwoord. Die tijden zijn cruciaal: saturatie qua verwarming in de middag, en maximale afkoeling voor de zon weer opkomt om 06h. Bebouwing / bestrating omdat die veel warmte accumuleren en weer afgeven. Het zou me niet verbazen als juist de nacht warmer is. Dank!
-
Geert Jan van Oldenborgh
@gjvoldenborgh
Ja, behalve dat wij de laagste en hoogste temperatuur van 00 tot 00 UTC gebruiken (officiële definities). Je kan de dagelijkse data downloaden van climexp.knmi.nl en die plots zo maken. (Er zijn echter geen stations met een sterk bebouwde omgeving.) Succes!
🇳🇱 Arjan Ommering™
@arjanommering
Is het mogelijk om een grafiek te maken van 1980-heden met daarin de dagtemp (bv 14h) én nachttemp (bv 06h) van hetzelfde meetstation. En dat ook voor een plek die sterk bebouwd is én een puur natuur meetstation?
-
Geert Jan van Oldenborgh reposted
Erin Coughlan de Perez
@CoughlanClimate
Our new paper out today!
People normally define #elnino by the temperature of the ocean, but this is problematic because climate change is increasing the temperature of the ocean...
See here our elegant solution to create a "relative" index for ENSO.
Geert Jan van Oldenborgh
@gjvoldenborgh
The two most important predictors for seasonal forecasts are ENSO and climate change. Unfortunately, the strength of El Niño or La Niña is traditionally estimated by the Niño3.4 index, which also rises due to global warming. We propose relative Niño indices that separate the two.
-
Geert Jan van Oldenborgh
@gjvoldenborgh
Not empirical evidence but theoretical. There are some papers showing that convection is described best by the difference between local SST and the 20S-20N average, which sets the background stability of the tropical atmosphere. Extratropjcal SST does not play such a direcct role
Dr. Robert Rohde
@RARohde
I've only just skimmed the paper, so probably I missed it, but did you consider other normalizations besides the tropical average (for example, global average SST)?
Is it empirically clear that 20 N/S gives the most useful result?
Geert Jan van Oldenborgh
@gjvoldenborgh
From section 4:
Johnson and Kosaka, doi.org/10.1007/s00382-016-3039-1, 2016.
Back and Bretherton, doi.org/10.1175/2009JCLI2392.1, 2009.
Johnson and Xie, doi.org/10.1038/ ngeo1008, 2010.
Khodri et al, doi.org/10.1038/s41467-017-00755-6, 2017.
Izumo et al, doi.org/10.1029/2019GL086182, 2020. -
Geert Jan van Oldenborgh
@gjvoldenborgh
The two most important predictors for seasonal forecasts are ENSO and climate change. Unfortunately, the strength of El Niño or La Niña is traditionally estimated by the Niño3.4 index, which also rises due to global warming. We propose relative Niño indices that separate the two.
Geert Jan van Oldenborgh
@gjvoldenborgh
Using this adjusts the strengths of El Niño and La Niña events to be more in line with atmospheric responses, the relative index it is about 0.3 ºC cooler and deletes the marginal 2019/20 El Niño. ENSO teleconnections are also more realistic without common trends, eg in Siberia.
Geert Jan van Oldenborgh
@gjvoldenborgh
The proposed relative Niño3.4 hence gives a better basis for understanding seasonal forecasts than the traditional Niño3.4 index and we hope it will be adopted widely. doi.org/10.1088/1748-9326/abe9ed @KNMI @ECMWF @NWSCPC @BOM_au @RCClimate (see also climexp.knmi.nl/kprep_fc/)
-
Geert Jan van Oldenborgh
@gjvoldenborgh
The E-OBS dataset gives more extreme values in Tmean than in Tmax on your side of the North Sea.
Tim Osborn
@TimOsbornClim
24 Feb was definitely unusually warm Tmax in E Anglia. Not sure about Tmean
-
Geert Jan van Oldenborgh
@gjvoldenborgh
There are regions in Belgium, west-central Germany, Denmark, East Anglia were daily mean temperature also broke records in E-OBS, but indeed less than maximum temperatures. @TimOsbornClim ?
-
Geert Jan van Oldenborgh
@gjvoldenborgh
Preliminary E-OBS daily updates, the mildest day in February up to 24 February 2021 was the warmest since 1920 in northern Germany, coastal Belgium and a few other regions (dark red). In the Netherlands it was the second-highest after 2019 (bright red). @frakaspar @MartinStendel
-
Geert Jan van Oldenborgh reposted
Martien Visser
@BM_Visser
Naarmate windturbines hoger worden, neemt hun capaciteitsbenutting (in vollasturen) toe. Vervanging van een 1 MW windturbine door een 4 MW exemplaar levert daarom niet 4x, maar circa 8x meer hernieuwbare elektriciteit op. #grafiekvandedag
-
Geert Jan van Oldenborgh
@gjvoldenborgh
I accept the bet for €100 that July high temperatures do show a trend here in the Netherlands.
Wei. Zhang
@WeiZhangAtmos
Haven’t seen the data but I bet u have no trend in July highs
-
Geert Jan van Oldenborgh
@gjvoldenborgh
The extent of the warm anomalies in Europe yesterday (ECMWF analysis compared to ERA5) and today (1-day ECMWF forecast).
-
Geert Jan van Oldenborgh
@gjvoldenborgh
We just recorded the second-highest February temperature in De Bilt since at least 1901, 18.7 ºC. Only 2019 had a warmer day, 18.9 ºC. These temperature would have been virtually impossible without global warming, a fit gives <0.05% chance per year then. It is ~4% now (<10%).
Geert Jan van Oldenborgh
@gjvoldenborgh
This year is the first time with 5 days above 15 ºC in February. And that 10 days after we were still skating... Cold extremes have a much thicker tail than mild ones in winter, so change less under warming. See www.knmi.nl/over-het-knmi/nieuws/alweer-zeer-zachte-lente… (Dutch) @KNMI @RobertVautard @FriederikeOtto
-
Geert Jan van Oldenborgh
@gjvoldenborgh
Eind februari 1978 was er ook een warme periode, met als warmste dag de 26e met 15,0 ºC. Inderdaad ook best lekker, maar toch lang niet zo warm als vandaag.
L.Weeber ♀ Ik Ben Blank. Trots op de boeren.
@Weeber60
Nou ik weet niet hoor maar eind jaren 70 vorige eeuw liep mijn vader ook in februari in zijn blote bast buiten op de camping. De temperatuur was toen ook erg lekker.
-
Geert Jan van Oldenborgh
@gjvoldenborgh
No, this plot shows the coldest daily mean temperature of ythe year averaged over Texas. This quantity is better comparable between datasets as it does not depend as strongly on very local conditions as Tmin, and I thought it was also very relevant for Texas.
Neil
@neipate96
you're plotting the coldest day of the year by mean Texas temperature, right? so the title should say "Tmin"?
-
Geert Jan van Oldenborgh
@gjvoldenborgh
160 years years with a 95% confidence interval starting at 70 yr according to the fit. I am not 100% happy with how well the GEV describes the data though, so I prefer the analysis where I take global warming into account. It exists and it raises the temperature of cold waves...
-
Geert Jan van Oldenborgh
@gjvoldenborgh
Yes, a sanity check on the statistics is that if it is the lowest value in 130 years the return time should be larger than that...
Steve Evans
@steve_e
Thank you Helen! I was assuming it must be 100+
-
Geert Jan van Oldenborgh
@gjvoldenborgh
You can do all my analyses yourself at the public climate data & analysis web site KNMI Climate Explorer, climexp.knmi.nl . Share & enjoy.
@huntercutting.bsky.social
@HunterCutting
Thanks!
-
Geert Jan van Oldenborgh
@gjvoldenborgh
30-yr standard deviation of TGn (the coldest daily mean temperature of the year) shows no significant trends according to the MC method of Sacha Gershunov. or by eye. Neither does 5-yr day-on-day winter variability (decorrelation scale 10 days) except maybe early in the series.
@huntercutting.bsky.social
@HunterCutting
to the eyeball it looks like the spread of variability has increased in recent years. Is that right and is it statistically signficant? @TaminoClimate
-
Geert Jan van Oldenborgh
@gjvoldenborgh
Cold extremes have clearly become less likely. This used to be a 1 in ~80 yr event in early-industrial times. This fit alone does not show a significant trend against the null hypothesis of no trend, but with the decreasing chances almost everywhere I conclude the trend is real.
James Samworth
@James_Samworth
In layman's terms: the Texas cold snap was a 1 in 180 year event. With climate change, extremes are more likely, but because on average it's warming, it's not clear whether cold extremes are more likely. But because of the uncertainty, it's best to plan for extremes.
Geert Jan van Oldenborgh
@gjvoldenborgh
Trends in Texas extreme cold days. I took the Berkeley Earth average of Tavg over the state of Texas and extended it to this month using the ERA5 reanalysis and ECMWF analyses. A simple GEV fit shifting with GMST gives a return time of 180 yr (>60) and trend 1.2 ºC (-0.5 to 2.5).
-
Geert Jan van Oldenborgh
@gjvoldenborgh
I am afraid I was lazy and made all the plots on the public Climate Explorer site, and the author of that site left a bug in that the routine prints "max" also when it should print "min" (because internally it just flips the minus sign and does a max). I'll ask him to fix that.
-
Geert Jan van Oldenborgh
@gjvoldenborgh
As Rein Haarsma and @polar_james showed the increased temperature gradient at jet altitude due to upper tropospheric warming in the tropics advected to the subtropics and the down-to-earth nature of Arctic Amplification is an opposing trend and the balance is highly uncertain.
aaronshem
@aaronshem
Correct. There is an aspect of sea ice reduction that may offset this some that is often used to mislead people.
Geert Jan van Oldenborgh
@gjvoldenborgh
Plus of course the simple fact that Arctic amplification implies that the air in cold outbreaks is now less cold. High latitude land also warms very quickly, although not as much in the climate models, probably because the stable boundary layers over snow are not represented well
-
Geert Jan van Oldenborgh
@gjvoldenborgh
indeed. This is what we find almost everywhere in the northern midlatitudes. In our ERL we use two methods: spatially local over a century, and on shorter time scales spatially aggregated (to get a good enough signal/noise ration). Both show warming trends doi.org/10.1088/1748-9326/ab4867
Andreas Schmittner 🌎🟧
@ASchmittner
Thanks. Your analysis makes sense and is important in the current often misleading discussion of the causes of this cold snap. It suggests to me that global warming does not make these events more likely. If anything it makes them less likely. Right?
-
Geert Jan van Oldenborgh
@gjvoldenborgh
Generalised Extreme Value distribution, the distribution that theoretically describes block maxima like the coldest day of the year. See en.wikipedia.org/wiki/Generalized_extreme_value_distribution and the excellent book of Coles (2001).
Andreas Schmittner 🌎🟧
@ASchmittner
What is GEV?
-
Geert Jan van Oldenborgh
@gjvoldenborgh
Yes.
Prof. Stefan Rahmstorf 🌏 🦣
@rahmstorf
So is the bottom right point this year? Coldest on record?
Geert Jan van Oldenborgh
@gjvoldenborgh
Note that heGEV is very asymmetric, with a long cold tail. A very cold event does not influence the trend as much as a very mild event (absence of cold waves). I attach the histogram of a stationary GEV fit to show this, but the results I gave were from a non-stationary one.
-
Geert Jan van Oldenborgh
@gjvoldenborgh
My GEV fit routine treats minima by changing the sign and fitting them as maxima. I’ll make the labels better one of these days.
This is the lowest daily mean temperature of the year from July to June, labelled by the first half so the current cold outbreak is in 2020. -
Geert Jan van Oldenborgh
@gjvoldenborgh
Indeed, if you would want to prove local warming from these extremes it is not statistically significant but still present and most likely, based on evidence from other places around it. You see very strong warming trends in cold extremes throughout the northern midlatitudes.
Gert Meeus 🇺🇦🤝🏼🇷🇺
@gmeeus2
This implies no evidence for warming, as the CI crosses zero?
-
Geert Jan van Oldenborgh
@gjvoldenborgh
Yes, in the current climate, with a 95% uncertainty range starting at 60 years. This means 0.6% every year, up to 1.7%. Cold extremes continue to happen, just less frequently than in ye old days, when the return time would have been about two times less (probability 2x higher).
-
Geert Jan van Oldenborgh
@gjvoldenborgh
Trends in Texas extreme cold days. I took the Berkeley Earth average of Tavg over the state of Texas and extended it to this month using the ERA5 reanalysis and ECMWF analyses. A simple GEV fit shifting with GMST gives a return time of 180 yr (>60) and trend 1.2 ºC (-0.5 to 2.5).
Geert Jan van Oldenborgh
@gjvoldenborgh
This year was included in the fit. There is a lot of variability so the positive trend is not statistically significant. We know however from other studies that cold extremes are getting warmer almost everywhere. Global warming is now visible even over winter extreme variability.
Geert Jan van Oldenborgh
@gjvoldenborgh
Cold Extremes in North America vs Mild Weather in Europe: The Winter of 2013–14 in the Context of a Warming World, BAMS 2015 doi.org/10.1175/BAMS-D-14-00036.1
Cold waves are getting milder in the northern midlatitudes, ERL 2020 doi.org/10.1088/1748-9326/ab4867
@polar_james @hausfath @PauloCeppi -
Geert Jan van Oldenborgh
@gjvoldenborgh
Hier februari met een normale schaal die alles met verklaarde variantie <4% grijs maakt en met opgeblazen schaal. De veldsignificantie is heel laag: 13% van de kaart heeft p<0.1. Op basis van puur toeval verwacht je 10%, vrijwel hetzelfde ondanks de arbitraire keuze voor februari
-
Geert Jan van Oldenborgh
@gjvoldenborgh
Some people that claim that the sunspot number is a good predictor of good skating winters here in the Netherlands, and that this year's cold event was therefore to be expected. This scatterplot shows that there is no correlation between sunspot numbers and cold winters here.
Geert Jan van Oldenborgh
@gjvoldenborgh
De drie strengste winters (1947, 1942 en 1963) waren bij hoge, middelmatige en lage zonnevlekkengetallen. Dit jaar was "zacht" met een koudegetal van 36.3, dus past ook niet in het hypothetische verband. Vorig jaar met vrijwel geen zonnevlekken en koudegetal 0.6 al helemaal niet.
Geert Jan van Oldenborgh
@gjvoldenborgh
Er is uiteraard een sterk verband met de wereldgemiddelde temperatuur. De opwarming van de aarde door broeikasgassen zorgt voor minder koude winters.
-
Geert Jan van Oldenborgh
@gjvoldenborgh
Time series of the day: the area with cold extremes (minimum temperature lower than the 10-yr return time 1979-2010) in the northern midlatitudes (30ºN–60ºN) from ERA5. It shows a clear decrease as in doi.org/10.1088/1748-9326/ab4867, and no high peak this winter yet due to sea ice or SSW
Geert Jan van Oldenborgh
@gjvoldenborgh
The same for North America, with the current event clearly showing up but not more severe than was normal up to about 1995. Nobody seems to have noticed that this area was zero last year, i.e., there were no cold days (TNn) colder than the 10-yr return value at any grid point.
Geert Jan van Oldenborgh
@gjvoldenborgh
Clarification: for ERA5 read “ERA5 extended with the ECMWF operational analyses up to yesterday and 10-day deterministic forecast.” You can do the analysis yourself on climexp.knmi.nl
-
Geert Jan van Oldenborgh
@gjvoldenborgh
First quick look at last week's low temperatures in the Netherlands. The weekly mean temperature had a return time of about 6 years and is now a factor 2.5 less likely than in early-industrial times. This is equivalent to a temperature rise of these cold extremes of 1.2 to 4.8ºC.
Geert Jan van Oldenborgh
@gjvoldenborgh
See www.knmi.nl/over-het-knmi/nieuws/hoe-vaak-wordt-het-nog-z… for the full story (in Dutch). Not an attribution, just trend detection but we are pretty sure the increase is due to greenhouse gases. The heating is so strong by now we can detect the trend even over winter variability.
-
Geert Jan van Oldenborgh
@gjvoldenborgh
Yes, see www.knmi.nl/nederland-nu/klimatologie/lijsten/hellmann . It had a cold number of 73.2, below the threshold for a "cold" winter of 100. None of the years 2009-2013 reached that threshold.
-
Geert Jan van Oldenborgh
@gjvoldenborgh
Plot of the day: cold number at De Bilt, the Netherlands. If we do not get another cold wave the current winter will have around 37, officially still "mild", just above 2016 but far below the last "normal" winter, 2012 and the last "cold" winter, 1997. www.knmi.nl/nederland-nu/klimatologie/lijsten/hellmann
Geert Jan van Oldenborgh
@gjvoldenborgh
The low values of the 1910s and 1920s may be due to volcanic activity, the resulting stratospheric aerosols usually cause more westerly flows over the Atlantic and hence milder winters in Europe (while cooling the rest of the planet). See eg Weber, 2005 and Fischer et al, 2007.
-
Geert Jan van Oldenborgh reposted
KNMI
@KNMI
De hoeveelheid #sneeuw van Darcy kunnen we in het huidige klimaat gemiddeld eens per 4 jaar verwachten. Dit is dus niet erg zeldzaam, zelfs niet in ons huidige, warmere klimaat. www.knmi.nl/over-het-knmi/nieuws/hoeveelheid-sneeuw-van-d… #klimaatbericht #stormdarcy #winter
-
Geert Jan van Oldenborgh
@gjvoldenborgh
The cold in the Netherlands next week is very local but (for us) pretty extreme. Hopefully good skating. In western Canada and US the anomalies are forecast to be much larger and widespread. ECMWF forecast compared to ERA5 1991-2020 climatology.
-
Geert Jan van Oldenborgh
@gjvoldenborgh
1/4 With snow outside and a cold week forecast here in the Netherlands (and snow and cold in the US) it is maybe a good moment to summarise an article we did last year on cold waves. Due to the large weather noise we looked at cold extremes in two ways. @RobertVautard @FrediOtto
Post not available here, view on X
Geert Jan van Oldenborgh
@gjvoldenborgh
3/4 We next looked at trends in the area covered with cold extremes that used to occur with 10% probability in 1951-1980. This area shows strong declines in North America and Europe, with fluctuations on the decadal scale. These are not at the same time and compatible with noise.
Geert Jan van Oldenborgh
@gjvoldenborgh
4/4 We conclude that, as expected from the observed planetary warming driven in large part by increasing greenhouse gases, cold waves in the northern midlatitudes are getting less severe, and find no robust evidence to the contrary. iopscience.iop.org/article/10.1088/1748-9326/ab4867/meta @KNMI.
-
Geert Jan van Oldenborgh
@gjvoldenborgh
Curious how much snow we'll get tomorrow. For comparison the annual (Jul-Jun) maximum of Netherlands-averaged snow depth. A GEV fit gives a decrease of about 55% since 1955, albeit with a 95% CI of 10% to 80%. Extended from van Oldenborgh & de Vries 2018 climexp.knmi.nl/publications/Klimaatoverzicht_maart2018.pdf
-
Geert Jan van Oldenborgh reposted
Els de Wolf
@elsdewolf1
Leuk interview met @gjvoldenborgh in @ADnl www.ad.nl/gouda/is-extreem-weer-het-gevolg-van-klimaatver…
-
Geert Jan van Oldenborgh
@gjvoldenborgh
While the SSW is ending, the cold spells in Scandinavia and northern Russia, and Western Canada and Alaska, are now in Feb 8-15 in the ECMWF forecast. Maybe the bias that @erikwk, @Domeisen_D and @TimWoollings describe in doi.org/10.1175/JCLI-D-20-0270.1 (Not the NAO but further east.)
Geert Jan van Oldenborgh
@gjvoldenborgh
(anything to escape revising papers for a few minutes...)
-
Geert Jan van Oldenborgh reposted
KNMI
@KNMI
Was weerjaar 2020 een voorproefje van een warmere toekomst? Hoe past het recordwarme & zeer zonnige jr in een langjarige trend? Jaaroverzicht klimaat www.knmi.nl/over-het-knmi/nieuws/het-klimaatverhaal-van-2020 (Afb: extreme gebeurtenis die wellicht minder is opgevallen: een winter zonder echte kou) #klimaatbericht
-
Geert Jan van Oldenborgh
@gjvoldenborgh
Not really a cold winter period here in the Netherlands in the ECMWF plume, but Scandinavia is indeed forecast to become cold next week.
-
Geert Jan van Oldenborgh
@gjvoldenborgh
The weather in the Netherlands in 2020 conformed almost too neatly to climate trends: a very mild winter with predominantly westerly flows, dry and sunny spring due to fewer clouds and less pollution, and of course an extraordinary heat wave. @karin_vdwiel www.knmi.nl/over-het-knmi/nieuws/het-klimaatverhaal-van-2020
-
Geert Jan van Oldenborgh
@gjvoldenborgh
Plot of the day: January 2021 temperature anomalies (relative to the new normal* 1991-2020) over January 2021, ECMWF analyses + forecast. Mild winter in Canada so far. SSW effect?
* yes, we are calling a warmer climate "normal" this year. Unfortunate terminology. -
Geert Jan van Oldenborgh reposted
World Meteorological Organization
@WMO
🌀Tropical Cyclone #eloise is intensifying and is forecast to make landfall overnight at #cat 2 strength near Beira, #mozambique.
High winds, heavy rainfall, storm surge, flooding. Widespread humanitarian impacts in an area still recovering from #idai.
➡️public.wmo.int/en/media/news/tropical-cyclone-eloise-thre… -
Geert Jan van Oldenborgh
@gjvoldenborgh
The Lamb & Flag, where climate scientists hang out after work (when not locked down), still discussing weather & climate most of the time obviously. Even visiting professors like me occasionally. I hope they find way to keep going.
Edmund Griffiths
@EdmundGriffiths
A pub that has operated on the same site ever since 1613 will be closed down bc it isn't profitable _during a pandemic_ & the owner (@StJohnsOx) says charity rules stop it subsidizing a loss-making business. Can these rules not be waived during the crisis?
www.oxfordmail.co.uk/news/19028173.historic-lamb-flag-pub… -
Geert Jan van Oldenborgh
@gjvoldenborgh
Hans von Storch did an interview with me in his series looking how climate scientists try to approximate the truth given the large uncertainties in this branch of science and the heavy political pressures. With a foreword by Myles Allen. @KNMI www.academia.edu/44946272/Geert_Jan_van_Oldenborgh_approa…
-
Geert Jan van Oldenborgh
@gjvoldenborgh
Another plot of the day: relative annual precipitation anomalies in the GPCC datasets (v2018 + monitoring + first guess). -0.5 means 50% less than normal, defined over all data. Dry areas have large anomalies, but so do eg China and western US & Mexico. climexp.knmi.nl/annual_overview_world_weather
-
Geert Jan van Oldenborgh
@gjvoldenborgh
Plot of the day: annual mean sea ice extent. The Arctic had the lowest value, together with 2016 (just like the global mean temperature). Data: NSIDC sea ice index.
Geert Jan van Oldenborgh
@gjvoldenborgh
The Antarctic is a lot more interesting, with a spike in 2013-2015 and a dip in 2016-2019. It is unclear to me whether the positive trend before that is part of the variability or of the response to global warming (we argued the latter, doi.org/10.1038/ngeo1767).
-
Geert Jan van Oldenborgh
@gjvoldenborgh
The forecast 2m temperature anomalies for next week in the (deterministic) ECMWF 10-day forecast. No cold yet in populated areas in spite of the SSW. @FrediOtto @MartinStendel
Geert Jan van Oldenborgh
@gjvoldenborgh
The ECMWF monthly forecast shows pretty much the same for the next weeks. Maybe the model does not capture the effects of the SSW, maybe they are useful for hedge fund managers? Although they'd be better off buying the forecasts and getting them at the same millisecond as others.
-
Geert Jan van Oldenborgh
@gjvoldenborgh
Een groot ozongat wordt veroorzaakt door een sterkere vortex, die voor grotere afkoeling zorgt omdat Antarctica geïsoleerd wordt van de minder koude omgeving. Ik vermoed dat er nog meer factoren zijn maar ben geen expert. Kennelijk is het netto effect nul of een lichte afkoeling.
Geert Jan van Oldenborgh
@gjvoldenborgh
Je kan op climexp.knmi.nl zelf plots maken waar er opwarming is en waar afkoeling. Lijkt me best boeiend maar ik heb zelf weinig tijd (zeker niet omdat ik maar 50% kan werken, ben niet erg gezond). Let wel op dat je de CO2 trend aftrekt. Veldsignificantie houdt niet over.
-
Geert Jan van Oldenborgh
@gjvoldenborgh
There were problems with the scratch SSD not being mounted. I tried to fix it and it appears to be OK now, but there may have been weird effects the last 30 minutes.
Geert Jan van Oldenborgh
@gjvoldenborgh
The KNMI Climate Explorer appears to be back up at climexp.knmi.nl. I am busy updating the global mean temperature analyses. Please report problems if you encounter any.
-
Geert Jan van Oldenborgh
@gjvoldenborgh
HadCRUT5 global mean temperature also effectively ties 2020 with 2016. The latter had a tailwind from a big El Niño, so this is compatible with the upward trend continuing unabated or even accelerating. The only way to stabilise the temperatures is to reduce CO2 emissions to zero
-
Geert Jan van Oldenborgh
@gjvoldenborgh
Berkeley Earth 2020 global mean temperature is slightly lower than 2016, which had a tailwind from a big El Niño. This is compatible with the upward trend continuing unabated or even accelerating. The only way to stabilise the temperatures is to reduce CO2 emissions to zero.
-
Geert Jan van Oldenborgh
@gjvoldenborgh
The KNMI Climate Explorer appears to be back up at climexp.knmi.nl. I am busy updating the global mean temperature analyses. Please report problems if you encounter any.
-
Geert Jan van Oldenborgh
@gjvoldenborgh
NOAA global mean temperature also effectively ties 2020 with 2016. The latter had a tailwind from a big El Niño, so this is compatible with the upward trend continuing unabated or even accelerating. The only way to stabilise the temperatures is to reduce CO2 emissions to zero.
-
Geert Jan van Oldenborgh
@gjvoldenborgh
GISTEMP global mean temperature also effectively ties 2020 with 2016. The latter had a tailwind from a big El Niño, so this is compatible with the upward trend continuing unabated or even accelerating. The only way to stabilise the temperatures is to reduce CO2 emissions to zero.
-
Geert Jan van Oldenborgh
@gjvoldenborgh
The stratospheric warming is in the initial state, these are Monday's forecasts (there will be new ones tonight). I do not know how realistic their stratosphere is, nor how well they represent the mechanism by which this very small mass change can influence the heavy troposphere.
-
Geert Jan van Oldenborgh
@gjvoldenborgh
Update: it was due to a bug in their cloud software and their helpdesk has gotten it unstuck. It will take some time to deploy again and afterwards more work for me to make sure everything works. Maybe I can do that tonight, but more probably tomorrow Friday.
Geert Jan van Oldenborgh
@gjvoldenborgh
I am having problems getting the Climate Explorer to run again at our cloud provider. Please use the test server at climexp-test.duckdns.org for the time being. I am afraid I am not very good at acting sysadmin for a server in the cloud.
-
Geert Jan van Oldenborgh
@gjvoldenborgh
I am having problems getting the Climate Explorer to run again at our cloud provider. Please use the test server at climexp-test.duckdns.org for the time being. I am afraid I am not very good at acting sysadmin for a server in the cloud.
-
Geert Jan van Oldenborgh
@gjvoldenborgh
The probability of a cold spell somewhere in the midlatitudes within a couple of weeks is also quite high without SSW. How much higher does it become with one?
-
Geert Jan van Oldenborgh
@gjvoldenborgh
Indeed.
Bob Berwyn
@bberwyn
Thanks, so it shifted east in the past few days. I saw that @extremetemps also posted about Turkey and the Black Sea region. x.com/extremetemps/status/1349147630572613633 and x.com/extremetemps/status/1349286691480211456
-
Geert Jan van Oldenborgh
@gjvoldenborgh
From my maps (eg yesterday, attached), it appears that the extreme cold is mainly in central Spain, although Portugal is also below average.
-
Geert Jan van Oldenborgh
@gjvoldenborgh
I got asked about the cold wave in Spain. There are two aspects to it. The first is that winter weather in Western Europe, on the edge of the continent, is very asymmetric. Cold extremes deviate more from the mean than mild extremes. They are also more variable, eg due to snow...
Geert Jan van Oldenborgh
@gjvoldenborgh
The effects of the warming are therefore less visible in the cold outbreaks, simply because they are so large and variable, even though they warm more quickly. The trends in mild extremes are more significant. See eg doi.org/10.1088/1748-9326/ab4867 and doi.org/10.1175/BAMS-D-14-00036.1
Geert Jan van Oldenborgh
@gjvoldenborgh
The second aspect is media attention. "Absence of cold waves causes no problems" is not a headline you will see. How many people noted that last winter in my part of the world had no cold outbreaks at all? Even now, the cold in Spain only covers a small part of the NH 12Jan map.
-
Geert Jan van Oldenborgh
@gjvoldenborgh
The ECMWF monthly forecast has no indications of any cold in Europe or North America after this week, except in Scandinavia.
Klimaattweets
@klimaattwts
A clear run for next week Geert Jan. But do you have any expectations for (early) February? You expect more negative AO/NAOs to follow as a result of SSW?
-
Geert Jan van Oldenborgh
@gjvoldenborgh
It may take a while for the official server to come back up on Wednesday as I was so busy resubmitting an event attribution overview paper that I forgot I am also sysadmin and did not bring the VM down gracefully. The side effects of the cancer treatment do not help either.
Geert Jan van Oldenborgh
@gjvoldenborgh
The Climate Explorer is unavailable today and tomorrow 12 & 13 January due to maintenance at our cloud provider. You can use the test server at our new cloud provider, climexp-test.duckdns.org, although it is not yet operational. Please report problems.
-
Geert Jan van Oldenborgh
@gjvoldenborgh
The Climate Explorer is unavailable today and tomorrow 12 & 13 January due to maintenance at our cloud provider. You can use the test server at our new cloud provider, climexp-test.duckdns.org, although it is not yet operational. Please report problems.
-
Geert Jan van Oldenborgh
@gjvoldenborgh
The anomalous warmth above the trend of 2020 was mainly in Siberia. This warming is close to the ground and hardly reaches the lower troposphere. The global mean temperatures are therefore not directly comparable. ERA5 2m temperature, UAH v6.0 temperature of the lower troposphere
-
Geert Jan van Oldenborgh
@gjvoldenborgh
No exceptional cold due to the SSW yet forecast for next week in the ECMWF model (except for Moscow).
-
Geert Jan van Oldenborgh reposted
Zeke Hausfather
@hausfath
Based on the latest ERA5 data, 2020 was the warmest on record over land by a fair margin, tied for the warmest for the global as a whole, but only the 3rd warmest over the oceans.
The world's land (where we all live) was 1.94C (3.5F) warmer than the preindustrial period in 2020. -
Geert Jan van Oldenborgh reposted
Copernicus ECMWF
@CopernicusECMWF
🌡️2020 has tied with 2016 as the warmest year on record, as well as being the hottest year recorded for Europe, according to our #copernicusclimate Change Service.
Follow this thread for more details, or read the full press release on our website➡️climate.copernicus.eu/copernicus-2020-warmest-year-record… -
Geert Jan van Oldenborgh
@gjvoldenborgh
These are smaller (I did half my PhD on these...). An obvious first point to check is the area-averaging: my ancient routines use a simple cos(latitude) approximation for the spherical lat/lon box correction, but to be precise you can use a formula taking all corners into account
-
Geert Jan van Oldenborgh
@gjvoldenborgh
In the preliminary ERA5ST reanalysis 2020 GMST is 0.02 ºC higher than 2016: equal within uncertainties. Without El Niño. The other large factor in interannual variability is high-latitude winter temperatures, Siberia contributed hugely. Copernicus will report officially tomorrow.
Geert Jan van Oldenborgh
@gjvoldenborgh
Curiously, the Copernicus global annual mean for 2020 is 0.007 ºC /lower/ than 2016, also equal when rounded to one decimal place, which seems sensible given all the uncertainties. I do not know where the differences with my averaging routines comes from. climate.copernicus.eu/sites/default/files/2021-01/ts_1mon…
-
Geert Jan van Oldenborgh
@gjvoldenborgh
Data source: ERA5 from Copernicus Climate Data Store cds.climate.copernicus.eu via KNMI Climate Explorer climexp.knmi.nl . At both sites you can analyse the data yourself and download the results (using 2020s software at CDS and 1990s software at my site).
Geert Jan van Oldenborgh
@gjvoldenborgh
In the preliminary ERA5ST reanalysis 2020 GMST is 0.02 ºC higher than 2016: equal within uncertainties. Without El Niño. The other large factor in interannual variability is high-latitude winter temperatures, Siberia contributed hugely. Copernicus will report officially tomorrow.
-
Geert Jan van Oldenborgh
@gjvoldenborgh
Here the NH overview for next week. No sign of big cold waves yet. Source ECMWF deterministic 10-day forecast.
-
Geert Jan van Oldenborgh reposted
Dr Friederike Otto
@FrediOtto
Climate change plays a role in East African droughts, but how big that role is crucially depends on how exactly we define drought. To make decisions combining & weighing lots of lines of evidence is absolutely crucial esd.copernicus.org/articles/12/17/2021/ @KimtaiJoy @gjvoldenborgh & many al.
-
Geert Jan van Oldenborgh reposted
KNMI
@KNMI
In 2020 werd weerrecord na #weerrecord gebroken. "#klimaatverandering gaat maar zeer ten dele over weerrecords," zegt #knmi'er Peter Siegmund. "De gewone dingen in het weer veranderen ook. Gemiddeld wordt elke dag iets warmer, maar dat valt minder op dan de extremen."
NRC
@nrc
In 2020 werd weerrecord na weerrecord gebroken. Van 38 graden boven de poolcirkel tot het neerslagtekort in Nederland: NRC zet de warmterecords, natuurrampen en orkanen van het afgelopen jaar op een rij. www.nrc.nl/nieuws/2020/12/28/het-warmste-jaar-ooit-in-het…
-
Geert Jan van Oldenborgh reposted
KNMI
@KNMI
2020 was samen met 2014 het #warmstejaar sinds 1901, het begin van onze metingen. Gemiddeld was de temperatuur in De Bilt 11,7°C. Dit werd al enkele weken door ons verwacht en zal de laatste dagen van het jaar niet meer veranderen. www.knmi.nl/over-het-knmi/nieuws/2020-samen-met-2014-het-… #2020 #weerrecord
-
Geert Jan van Oldenborgh
@gjvoldenborgh
Donkerrood is #1 in de reeks, dus het warmst sinds 1979, helderrood #2, de op één na warmste waarde, etc. Witte gebieden vallen buiten de top-6.
-
Geert Jan van Oldenborgh
@gjvoldenborgh
Plot of the day: in the dark red areas 2020 was the warmest year since at least 1979. Russia and Scandinavia stand out, but also the Indian and West Pacific Oceans with little variability relative to the trend. Locally also France, Belgium and the southern Netherlands.
-
Geert Jan van Oldenborgh
@gjvoldenborgh
Plot of the day: year-on-year changes in the CO2 concentrations at Mauna Loa. Still a quadratic rise in good approximations, with increments increasing from about 1 ppm/yr in the 1960s to 2.5 ppm/yr now. The emissions were 7% lower in 2020 due to the pandemic, so ~0.2 ppm here.
Geert Jan van Oldenborgh
@gjvoldenborgh
Assuming other greenhouse gases and aerosols follow the CO2 concentration (a lot of both are emitted by the fossil fuel industry) we would expect a quadratic rise of the global mean temperature. A faster than linear rise is indeed observed, although others blame aerosols.
Geert Jan van Oldenborgh
@gjvoldenborgh
The 0.2 ppm lower CO2 concentration at the end of 2020 due to the pandemic translates into a 0.002 ºC lower global mean temperature (0.01 ºC/ppm). Another way to look at it is to note it would give us almost one month more to reach net zero emissions.
-
Geert Jan van Oldenborgh
@gjvoldenborgh
Mooi overzicht van wintertrends van Rolf Schuttenhelm. decorrespondent.nl/11845/hoe-de-winter-met-de-noorderzon-…
-
Geert Jan van Oldenborgh
@gjvoldenborgh
In 1984 was het niet koud genoeg, 1985, 1986 en 1987 wel. Zie bv www.knmi.nl/kennis-en-datacentrum/achtergrond/kans-op-elf…
Het Gouden Weekend (Radio M)
@EdwinMeerman
Ben geen weeramateur maar in 1984 ijs dik genoeg en toch geen Elfstedentocht kan ik me niet herinneren.
-
Geert Jan van Oldenborgh
@gjvoldenborgh
Plot of the day: global November temperature anomalies. Above normal in most of the US, Australia and northern Europe. Still crazy high in the Arctic, partly in line with the very high trends there in the freezing half year (Oct-Mar). Source: ECMWF analyses compared to ERA5.
Geert Jan van Oldenborgh
@gjvoldenborgh
To complement here the year so far, note the logarithmic colour scale otherwise you would almost only see the Siberia temperatures. Cooler in the La Niña area, Atlantic warming hole (AMOC slowing down), parts of Canada (just a coincidence). Warmer almost everywhere else of course
-
Geert Jan van Oldenborgh reposted
Dr Friederike Otto
@FrediOtto
Climate Change is a real game-changer for extreme heat & heat is a killer. Subsaharan Africa is literally a particular hot spot, but heatwaves are not even monitored. Read from Luke & me why this matters @ecioxford theconversation.com/extreme-heat-is-a-threat-to-lives-in-… via @TC_Africa
-
Geert Jan van Oldenborgh
@gjvoldenborgh
Goed stuk over mijn collega Maarten van Aalst over rampen en klimaatverandering. www.nrc.nl/nieuws/2020/11/17/bij-rampen-neemt-de-rol-van-…
-
Geert Jan van Oldenborgh
@gjvoldenborgh
A subject that is important to me: "Challenges to understanding extreme weather changes in lower income countries". The places that are most vulnerable to changes in extremes also are the most difficult to analyse and project well. @FrediOtto @RoopSingh journals.ametsoc.org/bams/article/101/10/E1851/347710
-
Geert Jan van Oldenborgh reposted
Dr Friederike Otto
@FrediOtto
If you ever want to attribute an extreme weather event, here is your cookbook: ascmo.copernicus.org/articles/6/177/2020/ Including all the @wxrisk experience of 5 years and over 30 fast and slow studies...it got a bit nerdy...@gjvoldenborgh @RobertVautard @mkvaalst @RoopSingh @AndrewKingClim
-
Geert Jan van Oldenborgh
@gjvoldenborgh
Koudegolven nemen af, zowel door een verschuiving naar hogere temperaturen als bij ons in de toekomst een lagere variabiliteit. Het noordpoolgebied warmt 's winters veel sneller op dan de rest van de wereld dus de noordoostenwind wordt minder koud. Zie oa iopscience.iop.org/article/10.1088/1748-9326/ab4867
Paul Gillisse
@PGillisse
Er komen toch extremen, waarom dan niet extreem koud?
-
Geert Jan van Oldenborgh
@gjvoldenborgh
From my incomplete knowledge of the literature, yes. Some articles claim this is a stronger feedback than the better-known ice-albedo feedback. It also operates in the polar night.
-
Geert Jan van Oldenborgh
@gjvoldenborgh
The extra water vapour acts as a greenhouse gas preventing part of the long wave radiation from escaping...
Chris Parker
@HyperHydr0
This is crazy. I want to get off now....
hopefully the extra heat will increase OLR and cool it down faster.....
Hmm, perhaps wishful thinking isn't the best response to climate change.
Geert Jan van Oldenborgh
@gjvoldenborgh
This is how crazy the October 2m temperatures were/are forecast to be in the Arctic in October due to the lack of sea ice north of Siberia. Source: ECMWF analyses + forecast wrt ERA5, NSIDC Arctic sea-ice concentration.
-
Geert Jan van Oldenborgh
@gjvoldenborgh
This is how crazy the October 2m temperatures were/are forecast to be in the Arctic in October due to the lack of sea ice north of Siberia. Source: ECMWF analyses + forecast wrt ERA5, NSIDC Arctic sea-ice concentration.
-
Geert Jan van Oldenborgh reposted
Zack Labe
@ZLabe
I'm waiting for the refreeze.
[*Note that the basin is geographically constrained (same maximum sea ice cover = flat line). Map: sites.uci.edu/zlabe/files/2018/01/NSIDC_mapseas.png] -
Geert Jan van Oldenborgh
@gjvoldenborgh
To make seasonal forecasts it does not make sense to condition on a phenomenon that is not predictable on the seasonal time scale. I just wanted to show that the scatter plot does not show a linear or nonlinear connection between ENSO and winter temperatures in Western Europe.
-
Geert Jan van Oldenborgh
@gjvoldenborgh
Nothing either.
Peter Thorne
@climpeter
It tends to be late winter / early spring (FM) that a signal appears. What does that look like?
-
Geert Jan van Oldenborgh
@gjvoldenborgh
Plot of the day: winter (DJF) detrended Central England Temperature vs relative Niño3.4 index. I cannot see any connection between La Niña and winter temperatures in western Europe after accounting for the common trends due to global warming.
-
Geert Jan van Oldenborgh reposted
KNMI
@KNMI
Onze klimaatwetenschappers Peter Siegmund en @gjvoldenborgh in gesprek met @NUnl. #winter #weersverwachting
NU.nl
@NUnl
Horrorwinter of weer een zachte? 'Wintervoorspellingen zijn op lucht gebaseerd': www.nu.nl/algemeen/6083359/horrorwinter-of-weer-een-zacht…
-
Geert Jan van Oldenborgh reposted
Daniel Swain
@Weather_West
This *perfectly* describes the challenge of seasonal climate prediction...
XKCD Comic
@xkcdComic
Prediction xkcd.com/2370/ m.xkcd.com/2370/
-
Geert Jan van Oldenborgh
@gjvoldenborgh
Plot of the day: Copernicus ERA5 temperature anomalies for September 2020. Northern Siberia stays much too warm. climexp.knmi.nl
-
Geert Jan van Oldenborgh reposted
ClimateIT
@climateIT
This station in Piedmont (from the Regional Environmental Protection Agency) recorded 532mm on Oct 2nd in a little more than 12 hours and 585mm up to Oct 3rd morning.
Some other stations in Piedmont between Oct 2nd and 3rd:
Monte Berlino 432mm
Diga del Chiotas 384mm -
Geert Jan van Oldenborgh
@gjvoldenborgh
Plot of the day. Well, two days ago. GPM/IMERG estimate of rainfall in southeastern France and northeastern Italy. Note that satellite estimates of extreme precipitation are not very accurate. Still, the >300 mm/day around Colla di Tenda is a lot of water. @RobertVautard
Geert Jan van Oldenborgh
@gjvoldenborgh
Note that the event is too small to be picked up in other large-scale near real-time analyses... I am still waiting for the station data to be converted but I am not sure there are any public stations in the region. Calibrated radar would probably be most accurate.
-
Geert Jan van Oldenborgh reposted
Prof James Screen
@polar_james
Our new paper in a tweet:
- Jetstream is not getting wavier 〰️❌
-⬆️s & ⬇️s in waviness are internal variability
- A wavier jet 〰️ causes a warmer Arctic 🌡️🍙
- Arctic continues to warm due to climate change 🌍🌡️
advances.sciencemag.org/content/6/8/eaay2880 -
Geert Jan van Oldenborgh reposted
Greystone Books
@greystonebooks
#angryweather by @FrediOtto is out today, and it could not be more timely. Otto’s research laid out in this groundbreaking book will have profound & long-lasting impacts. Find #angryweather wherever you get your books, but make sure to support your #indiebookstores first.
-
Geert Jan van Oldenborgh reposted
Bart Verheggen
@BVerheggen
Vincent van Gogh meets Climate Change
#hurricanes -
Geert Jan van Oldenborgh reposted
NOS
@NOS
Vijf tropische stormen tegelijk boven de Atlantische Oceaan, hoe kan dat? nos.nl/l/2348530
-
Geert Jan van Oldenborgh
@gjvoldenborgh
Looking back at yesterday's heat in our part of the world with the (preliminary) E-OBS daily updates. Large TXx anomalies in Belgium and the southern Netherlands, where a new September record of 35.1 ºC was set. Record values since 1950 were set south into Switzerland (dark red).
-
Geert Jan van Oldenborgh reposted
Frank Deboosere
@frankdeboosere
Op 15 september 2020 om 16u00 in Ukkel 34,3°C
Dit is de hoogste temperatuur ooit gemeten in een maand september in Ukkel. -
Geert Jan van Oldenborgh
@gjvoldenborgh
Highest maximum temperature averaged over France since at least 1950 according to the E-OBS dataset up to 14 September (preliminary). De Bilt recorded 30.9 ºC today so far, 3rd-highest value since 1901. These temperatures used to be unusual here. @RobertVautard @FrediOtto @KNMI
-
Geert Jan van Oldenborgh
@gjvoldenborgh
Ik vermoed dat de westelijke staren (ook Oregon en Washington hebben grote branden) binnen de onzekerheid van de trajectoriën liggen. We zouden een veel groter ensemble moeten laten zien, deze drie geven slechts een indicatie.
Hydrology.NL
@HydrologyNL
Wordt de rook boven het midden van de VS opgepikt? De trajectories komen vanuit Canada, niet Californië.
-
Geert Jan van Oldenborgh
@gjvoldenborgh
Via the Azores, figure made by my colleague @ArnoudApituley
Mark McCaughrean
@markmccaughrean
Very interesting. Here’s the view from the Vlietland near Stompwijk. Crazy to think this is due to the US wildfires. Which way round the Earth did the smoke come?
-
Geert Jan van Oldenborgh reposted
Robert van Waning
@RobertvanWaning
-
Geert Jan van Oldenborgh
@gjvoldenborgh
The smoke from the western US wildfires has even reached the Netherlands (see Reeuwijk Lakes below), turning the sky is grey instead of blue. Confirmed to come from there by satellite and lidar observations, it is the layer above 6km height. Made worse by climate change. @KNMI
-
Geert Jan van Oldenborgh reposted
Brent Toderian
@BrentToderian
A 13-year study of a dozen cities found that protected bike-lanes led to a drastic decline in fatalities for ALL users of the road. As for painted bike-lanes? No safety improvement at all. And for sharrows, it’s safer to NOT have them. Via @StreetsblogUSA usa.streetsblog.org/2019/05/29/protect-yourself-separated…
-
Geert Jan van Oldenborgh reposted
KNMI
@KNMI
Waarom is de lucht vandaag niet blauw? Terwijl er maar enkele wolkenvelden zijn. De #bosbranden in het westen v/d VS brengen rookdeeltjes naar Europa. Dit kunnen we zowel zien met onze satellietwaarnemingen als met de metingen vanaf de grond met onze wolkenhoogtemeter op Cabauw.
-
Geert Jan van Oldenborgh
@gjvoldenborgh
You have to be careful. In 2014 the WMO made weather forecasts for 2050 to show what climate change could look like. They were very similar to actual weather forecasts last summer already. In our part of the world heat waves are getting hotter very quickly www.independent.co.uk/environment/climate-change-weather-…
Andrew King 🌈
@AndrewKingClim
I really like this way of communicating climate projections for extreme weather. Continued greenhouse gas emissions will mean unprecedented heat for the UK more like Melbourne's heatwaves in the current climate.
-
Geert Jan van Oldenborgh reposted
Prof Sonia I. Seneviratne
@SISeneviratne
Increasing evidence of human footprint on climate: As stated, "We are seeing the emergence of some signals that would have had almost no chance of happening without human-induced climate change" @FrediOtto @gjvoldenborgh @Weather_West @Matthew__Green www.reuters.com/article/us-climate-change-global-weather/…
-
Geert Jan van Oldenborgh reposted
Dr Friederike Otto
@FrediOtto
It's not only consistent, but for many recent extremes climate change is a key driver in the causal chain. @SISeneviratne @Weather_West @gjvoldenborgh
Reuters
@Reuters
The spate of wild weather this year is consistent with climate change, scientists say, and the world can expect even more extreme weather and higher risks from natural disasters as global emissions of greenhouse gases continue www.reuters.com/article/us-climate-change-global-weather/… by @Matthew__Green
-
Geert Jan van Oldenborgh
@gjvoldenborgh
Totally irrelevant plot: our sailing holiday in Frisia compared to wind observations at the nearest KNMI station. Good sailing, but we did reeve a lot. Data from climexp.knmi.nl of course.
-
Geert Jan van Oldenborgh
@gjvoldenborgh
Interesting article by Sjoukje Philip and Sarah Kew on drought in the Netherlands. Even in this small country there is a clear trend towards more drought inland. In the coastal zone there is an increase in precipitation, which models do not reproduce @KNMI iopscience.iop.org/article/10.1088/1748-9326/ab97ca
Geert Jan van Oldenborgh
@gjvoldenborgh
This year's precipitation deficit follows the trend quite nicely, with higher values in the south and east. These regions are also more vulnerable to drought as they are high (10-20m above sea level) and hence cannot use Rhine water.
-
Geert Jan van Oldenborgh reposted
Zeke Hausfather
@hausfath
In the Bay Area most homes do not have air conditioning. It used to only get above 85F around 5 days a year back in the 1970s (or 1900s). Today it gets above 85F around 15 days per years (and this doesn't include the exceptional 2020 heatwave).
This is climate change. -
Geert Jan van Oldenborgh
@gjvoldenborgh
Plot of the week: August 2020 ECMWF temperature analyses compared to ERA5. Parts of north Siberia stay hot, the southwestern US, and even Europe show warm anomalies. Marine heat waves in the Pacific. Winter weather in Antarctica is variable.
-
Geert Jan van Oldenborgh
@gjvoldenborgh
The first estimate of the number of people killed by the recent heat in the Netherlands: about 400 excess deaths up 16 August 2020. Source: Statistics Netherlands (CBS) www.cbs.nl/nl-nl/nieuws/2020/34/iets-hogere-sterfte-in-wa…
-
Geert Jan van Oldenborgh reposted
CBS
@statistiekcbs
In week 33 #overleden naar schatting 3 100 mensen, ruim 400 meer dan in de voorgaande weken. De toename in #sterfte is toe te schrijven aan de hittegolf. In week 32 overleden 2 609 mensen.
www.cbs.nl?sc_itemid=36b5f209-9fd8-4a9e-bc40-3170b07ab268… -
Geert Jan van Oldenborgh
@gjvoldenborgh
Plot of the day: areas where 2020 had the highest 3-day averaged maximum temperature in ERA5 1979-now (dark red), second-highest (bright red) etc. You see California's Central Valley, but look at Africa, Middle East and Siberia, with largely unknown impacts. @FrediOtto @RCClimate
-
Geert Jan van Oldenborgh reposted
Wim Thiery
@WimThiery
With all the observations collected, analysis now confirms that 8-14 August broke the all-time record in terms of weekly average daily maximum *and* daily minimum temperature across most of Belgium, not just in Uccle. Many thanks @gjvoldenborgh for this important analysis.
Geert Jan van Oldenborgh
@gjvoldenborgh
Now that the observations are in, here the minimum temperature anomalies of 8-14 August in E-OBS, (close to) the hottest week in most places and its ranking. Dark red means record warm 7day mean nights. I found it harder and harder to sleep well and concentrate on climate science
-
Geert Jan van Oldenborgh
@gjvoldenborgh
Now that the observations are in, here the minimum temperature anomalies of 8-14 August in E-OBS, (close to) the hottest week in most places and its ranking. Dark red means record warm 7day mean nights. I found it harder and harder to sleep well and concentrate on climate science
Geert Jan van Oldenborgh
@gjvoldenborgh
For comparison, here the same for the maximum temperature. The amplitudes are larger, but the area where it was record warm smaller. Variability in night-time temperatures is smaller than in afternoon temperatures. Source: E-OBS with daily updates.
-
Geert Jan van Oldenborgh
@gjvoldenborgh
Thanks! Is this written up somewhere where I can cite it? (I must admit I have not yet read the whole GCP report yet.)
Paul Skeoch
@donkeyhottie
Up to 2014 divergence was primarily due to short-term carbon sink variability while real-world emissions outpaced RCP8.5. After 2015 concentration growth mostly caught up with emissions but by that time RCP8.5 had overtaken real-world annual emissions, so divergence continues.
-
Geert Jan van Oldenborgh reposted
Paul Skeoch
@donkeyhottie
Up to 2014 divergence was primarily due to short-term carbon sink variability while real-world emissions outpaced RCP8.5. After 2015 concentration growth mostly caught up with emissions but by that time RCP8.5 had overtaken real-world annual emissions, so divergence continues.
-
Geert Jan van Oldenborgh
@gjvoldenborgh
Now that the analyses are in, updates on the temperature anomalies and rank of weekly mean maximum temperatures in Europe. The highest temperatures observed are no longer unusual, but the length of the heat wave was exceptional. In de Bilt we had eight consecutive days ≥ 30 ºC.
-
Geert Jan van Oldenborgh
@gjvoldenborgh
Terugblik op de hitte de afgelopen tijd in Nederland. www.knmi.nl/over-het-knmi/nieuws/recordwarme-week. @KNMI
-
Geert Jan van Oldenborgh reposted
Wim Thiery
@WimThiery
@DeWarmsteWeek sinds het begin van de metingen wat betreft dagelijkse maximumtemperatuur, nu ook bevestigd door de metingen in Ukkel. @gjvoldenborgh x.com/WimThiery/status/1292832047837388800
David Dehenauw
@DDehenauw
Als we de gemiddelde synoptische maximumtemperatuur van de voorbije 7 dagen (6-12/8) beschouwen, dan is het in Ukkel de warmste week geworden sinds 1833 met een waarde van 33,5 graden. De 2de warmste week is 30/6-6/7 uit 1976 met 33,4 graden als gemiddelde synoptische Tmax.
-
Geert Jan van Oldenborgh
@gjvoldenborgh
2020 is forecast to have the hottest week recorded in ERA5 + ECMWF analyses + forecasts (1979-now) in the Netherlands, northern Belgium and a surprisingly large part of England. In northern France the second hottest. This heat wave is exceptional in its length. @RobertVautard
Geert Jan van Oldenborgh
@gjvoldenborgh
Even larger areas are forecast to have record minimum temperatures, about 20 ºC here in the Netherlands.
-
Geert Jan van Oldenborgh
@gjvoldenborgh
Op basis van de waarnemingen t/m zondag 9 augustus en de verwachtingen daarna is de kans groot dat we de warmste week sinds het begin van de metingen krijgen. In de maximumtemperatuur:
Geert Jan van Oldenborgh
@gjvoldenborgh
en nog duidelijker in de minimumtemperatuur:
-
Geert Jan van Oldenborgh
@gjvoldenborgh
See also www.vrt.be/vrtnws/nl/2020/02/26/opwarming-in-ukkel-zit-aa…
-
Geert Jan van Oldenborgh
@gjvoldenborgh
Hier de 12-maands gemiddelde wereldgemiddelde temperatuur (GISTEMP). Die is op dit moment vrijwel even hoog als in 2016, zelfs zonder de rugwind van El Niño.
GreenFuture
@GreenFutureNL
De site doorbraak.be is er een uit de categorie ’alu-hoedjes’ en de schrijver van het artikel komt uit de stal van de anti-klimaatverandering roeptoeteraars. Hoe subjectief wil je het hebben?
hoax.fandom.com/nl/wiki/Doorbraak -
Geert Jan van Oldenborgh reposted
NYT Climate
@nytclimate
Extreme heat is not a future risk. It’s now. And people who are poor and marginalized are most vulnerable.
See what it’s like to live in an increasingly warming world: www.nytimes.com/interactive/2020/08/06/climate/climate-ch… -
Geert Jan van Oldenborgh reposted
Dr Friederike Otto
@FrediOtto
Since you ask: Yes, climate change is playing a big role in heatwaves like we just experience, making them more frequent and more intense - See lots of studies e.g. rb.gy/v2wlpu. Heatwaves are killers & don't just hit Europe rb.gy/bdsrdo
-
Geert Jan van Oldenborgh
@gjvoldenborgh
1901-2019: KNMI observations corrected for changes in observation technique and location in 1950 and 1951, 2020: ECMWF forecast.
Dr. Anette K⭕️ch #FBPE #BLM 🦋🌱🏳️🌈💛💙🙏🌍🌎🌏
@AnetteKoch
Fig. 2: Highest maximum temperature of the year at "De Bilt"/Netherlands during the period 1900 to 2019 (and 2020, from ECMWf model), in red, and averaged over 10-year periods, in green.
Geert Jan van Oldenborgh
@gjvoldenborgh
De verwachte hitte komende week in context van klimaatverandering over de afgelopen eeuw gezet. Tegenwoordig is dit heel normaal, we zullen er aan moeten wennen na 1,5 biljoen ton CO2 uitgestoten te hebben (plus andere broeikasgassen min aërosolen). www.knmi.nl/over-het-knmi/nieuws/de-voorspelde-hitte-van-… @KNMI
-
Geert Jan van Oldenborgh
@gjvoldenborgh
De verwachte hitte komende week in context van klimaatverandering over de afgelopen eeuw gezet. Tegenwoordig is dit heel normaal, we zullen er aan moeten wennen na 1,5 biljoen ton CO2 uitgestoten te hebben (plus andere broeikasgassen min aërosolen). www.knmi.nl/over-het-knmi/nieuws/de-voorspelde-hitte-van-… @KNMI
Geert Jan van Oldenborgh
@gjvoldenborgh
Voetnoot: we hebben de helft van de toename in hittegolven aan de emissies van broeikasgassen en aerosolen door de mens kunnen toeschrijven. De andere helft is òf dat ook maar niet goed beschreven door de klimaatmodellen, òf een ander effect dat we nog niet hebben kunnen vinden.
-
Geert Jan van Oldenborgh reposted
Martien Visser
@BM_Visser
En dan is er nog het sprookje dat datacenters stroomslurpers zijn. Welnee: dat zijn de ICT-spullen en de netwerken!
Offshoring van datacenters helpt het klimaat uiteraard niet. Los hoe het voelt als uw cloud-data op servers in bijv. China, Rusland of USA staan.
#grafiekvandedag -
Geert Jan van Oldenborgh
@gjvoldenborgh
The heat wave expected in our part of the world is forecast to not be particularly intensive: 33-34 degrees in the Netherlands on Saturday, return time ~5 years. However, it is forecast to last a long time. The weekly mean maximum temperature would be the highest observed here.
Geert Jan van Oldenborgh
@gjvoldenborgh
Last year, the ECMWF model underestimated the heat by about a degree, so it may well turn out hotter. Stay tuned.
Geert Jan van Oldenborgh
@gjvoldenborgh
TX7x was optimised for this heat wave, so it overestimates how rare it was. A standard measure we (Vautard et al, ERL, 2020, doi.org/10.1088/1748-9326/aba3d4), TG3x (annual max of 3dy mean daily mean T), gives record values but over a smaller area in the forecast @RobertVautard @FrediOtto
-
Geert Jan van Oldenborgh
@gjvoldenborgh
Forecast for Friday Tmax in Europe. If the forecast verifies it's going to be up to 15 degrees above climatology in France (today's 00Z ECMWF forecast wrt ERA5, the model tends to underestimate maximum temperatures a bit). @RobertVautard
-
Geert Jan van Oldenborgh
@gjvoldenborgh
Plot of the day: first look at July daily mean temperature anomalies. Source ECMWF analyses up to yesterday + forecasts up the 31st compared with ERA5. The heat in Siberia on the land is over, but now the Arctic Ocean north of it is melting earlier than was normal. Cool here.
-
Geert Jan van Oldenborgh reposted
Prof Sonia I. Seneviratne
@SISeneviratne
Climate Change Makes Freak Siberian Heat 600 Times Likelier. Excellent article on our @wxrisk study with comments from @valmasdel & @ruth_mottram. @andyciavarella @FrediOtto @ClimateFlavors @skalevag @gjvoldenborgh @MetOffice_Sci @ecioxford @usys_ethzh www.nytimes.com/aponline/2020/07/15/science/ap-us-sci-sib…
-
Geert Jan van Oldenborgh
@gjvoldenborgh
Good paper by my colleague @FrediOtto. Heat waves are an underestimated problem in hot countries (not only in Africa I think). www.nature.com/articles/s41558-020-0851-8
-
Geert Jan van Oldenborgh reposted
Dr Friederike Otto
@FrediOtto
Heatwaves are dangerous & we know that climate change is making them hotter & more frequent also in Africa - so why are their impacts not reported over the continent? Luke & I try to find out tiny.cc/1xrdsz & tiny.cc/gyrdsz
-
Geert Jan van Oldenborgh
@gjvoldenborgh
If we choose to start the year in July, the past year was the warmest in the GISTEMP record (and second-warmest in the NCDC series). See climexp.knmi.nl/annual_overview_world_weather/index.cgi?v…
-
Geert Jan van Oldenborgh
@gjvoldenborgh
Although the sun is at its highest point in the northern hemisphere, the hottest afternoon of the year is later in most places due to thermal inertia, mainly of the ocean. Here in Holland we have to wait 4 weeks on average. Monsoon areas peak earlier, they cool as the rains start
-
Geert Jan van Oldenborgh
@gjvoldenborgh
The effects of La Niña on the global temperature lag by 3-5 months, so we’ll get these the last few months of the year.
-
Geert Jan van Oldenborgh
@gjvoldenborgh
Hi Roger, here is Z500, you can easily make hem yourself on the Climate Explorer climexp.knmi.nl. You know that due to global warming there is a general increase in Z500 that has nothing to do with dynamics and everything with thermodynamics.
-
Geert Jan van Oldenborgh
@gjvoldenborgh
Plot of the week: first look at June 2020 temperature anomalies (ECMWF analyses and forecast compared to ERA5). The large northern Siberia anomalies have been in the news recently. Even the recently developed La Niña is visible. Via climexp.knmi.nl of course.
-
Geert Jan van Oldenborgh
@gjvoldenborgh
Temperatuur: klimaatmodellen onderschatten de opwarming tot nu toe in Nederland. Formeel kunnen we alleen dat stuk toeschrijven aan de uitstoot van broeikasgassen en aerosolen. De rest is òf door iets anders veroorzaakt òf een probleem in die modellen. Dat moeten we nog uitzoeken
Geert Jan van Oldenborgh
@gjvoldenborgh
Straling: in van Oldenborgh (2009) vonden we dat een deel van de toename van de zonneschijn in voorjaar en zomer ook in de klimaatmodellen, maar ook hier een deel ook niet. Dat artikel zijn we aan het updaten met data t/m nu, ik hoop dat we dan meer weten. www.clim-past.net/5/1/2009/cp-5-1-2009.pdf
-
Geert Jan van Oldenborgh reposted
KNMI
@KNMI
Het maximale #neerslagtekort in het voorjaar is de afgelopen 50 jaar toegenomen, met ongeveer 45%. Dit komt door een toename van de verdamping, de hoeveelheid neerslag is nauwelijks veranderd. www.knmi.nl/over-het-knmi/nieuws/toename-neerslagtekort-e… #klimaatbericht #droogte
-
Geert Jan van Oldenborgh reposted
Karin van der Wiel
@karin_vdwiel
In een nieuw #klimaatbericht meer over onze attributiestudie over de #droogte 2018 in Nederland. In een team van @KNMI en @UUGeo laten we zien dat droogte zoals 2018 in het binnenland nu vaker voorkomt dan rond 1950. --> www.knmi.nl/over-het-knmi/nieuws/vaker-droogte-in-het-bin…
-
Geert Jan van Oldenborgh reposted
Wim Thiery
@WimThiery
In our new study in @NatureComms, we provide observational and model evidence that expanding irrigation has dampened historical anthropogenic warming during hot days, with particularly strong effects over South Asia www.nature.com/articles/s41467-019-14075-4 @ETH_en @VUBrussel
-
Geert Jan van Oldenborgh
@gjvoldenborgh
The Climate Explorer was attacked this morning from ~140 IP addresses scattered around the world, cutting out grid points from the CRU TS fields from scripts at speed. Any idea whether this was a thoughtless exercise class or a DDOS attack? I blacklisted the addresses by hand.
-
Geert Jan van Oldenborgh
@gjvoldenborgh
No, no reply for months with at least a dozen attempts from me and @mkvaalst
Ed Hawkins
@ed_hawkins
@bdwake should be able to help?
-
Geert Jan van Oldenborgh
@gjvoldenborgh
Does anybody have any idea what to do in the following situation. We resubmitted a manuscript to Nature Climate Change after answering relatively positive reviews in March 2019, and have been trying to figure out what the status of it is since October 2019, but never got a reply.
-
Geert Jan van Oldenborgh
@gjvoldenborgh
It is near the top of my todo list to expand that, but I have a bit too much to do, like a big fight with reviewer #2 and worrying about my vulnerability due to multiple myeloma. And porting the Climate Explorer to the ECMWF EWC and trying to institutionalise it more.
Zeke Hausfather
@hausfath
(12 CMIP6 models, that is. It has complete CMIP5 data)
-
Geert Jan van Oldenborgh reposted
KNMI
@KNMI
Van half mrt tot eind apr was het zeer #zonnig en #droog. Het aantal zonuren in april is nu al zeer hoog. Er is geen trend in dit weertype, maar wel een duidelijke toename in de hoeveelheid zonneschijn in Nederland in het voorjaar. www.knmi.nl/over-het-knmi/nieuws/zonnige-maand-past-in-tr… #klimaatbericht
-
Geert Jan van Oldenborgh
@gjvoldenborgh
Klimaatbericht over de zonnige en droge afgelopen 40 dagen. Gedeeltelijk toeval, gedeeltelijk trend. Zoals gewoonlijk. www.knmi.nl/over-het-knmi/nieuws/zonnige-maand-past-in-tr…
-
Geert Jan van Oldenborgh reposted
PBL
@Leefomgeving
Goeie explainer van @NOS over klimaateffecten van de coronacrisis. Nieuwe studie van PBL diende als basis. www.pbl.nl/publicaties/de-invloed-van-de-coronacrisis-op-… youtu.be/sLBhHx6UJSE
-
Geert Jan van Oldenborgh
@gjvoldenborgh
Plot of the week: 2m temperature anomalies for the last few months (January-March ERA5, April ECMWF analyses / forecasts). Large positive anomalies over snow in Siberia. Trends there are not modelled correctly in current climate models, but variability is also huge.
-
Geert Jan van Oldenborgh reposted
Martien Visser
@BM_Visser
Gisteren kwam voor de tweede keer ooit meer dan 50% van alle elektriciteit uit hernieuwbare bronnen (IPCC definitie). Het leverde met 50,7% tevens een nieuw record op. #grafiekvandedag
-
Geert Jan van Oldenborgh
@gjvoldenborgh
This is how warm the winter and spring December–April have been in the Netherlands (observations plus ECMWF forecast, 1981-2010 climatology). Pity I have to stay inside so much.
Geert Jan van Oldenborgh
@gjvoldenborgh
The last month has also been great for my solar panels, February & March for the wind mills of colleagues.
-
Geert Jan van Oldenborgh reposted
Dr Friederike Otto
@FrediOtto
Apply and share bright climate enthusiasts - Operationalising attribution, there's nothing more cutting edge in climate science & you'll work with @gjvoldenborgh & me & the @wxrisk gang, and even De Bilt is really Utrecht. www.werkenvoornederland.nl/vacatures/scientist-KNMI-2020-…
-
Geert Jan van Oldenborgh
@gjvoldenborgh
Nee.
Freya Blekman
@freyablekman
ok dat zijn dan dus atmospherische EM-modellen
-
Geert Jan van Oldenborgh
@gjvoldenborgh
Ik mis nog een fysische onderbouwing zoals die voor cO2 allang bekend is. Zie bv www.knmi.nl/kennis-en-datacentrum/achtergrond/hoe-warmen-… (en daarna natuurlijk tekstboeken met alle formules). Het statistische verband is alleen een van de vele bevestigingen van deze natuurkunde.
Martijn v. Mensvoort
@handresearch
Geert-Jan, is dit een futiliteit? O.b.v. 22-jarige zonnecyclus en een eenvoudige correctie gericht op de sec. minima van de LISIRD TSI vinden we het temperatuurverloop via de 3-jarig gemiddelde waarden (correlatie t/m midden '80s: +0,963). PS. Werkt ook prima voor minima jaren.
-
Geert Jan van Oldenborgh
@gjvoldenborgh
Ik ben bang dat ik uw vraag niet begrijp, de Maxwell vergelijkingen beschrijven electromagnetische golven en andere elektrische en magnetische fenomenen. Klimaatmodellen de stroming van lucht en water, ijs, wolken, land, en interacties daartussen. Zie bv en.wikipedia.org/wiki/General_circulation_model
Freya Blekman
@freyablekman
maar worden de Maxwell vergelijkingen gedecorreleerd? dat is wat mij vaak verbaast (maar misschien is dat voor andere atmospherische modellen)
-
Geert Jan van Oldenborgh
@gjvoldenborgh
Large ozone hole over the North Pole this spring. News item and background at www.knmi.nl/over-het-knmi/nieuws/zeldzaam-ozongat-boven-d… (in Dutch). #klimaatbericht @MichielvanWeele
-
Geert Jan van Oldenborgh
@gjvoldenborgh
.. and on climexp.knmi.nl as well. Thanks Tim.
Tim Osborn
@TimOsbornClim
CRU/Jones North Atlantic Oscillation NAO index just updated to Dec 2019
Data: crudata.uea.ac.uk/cru/data/nao/
Graphs: crudata.uea.ac.uk/cru/data/nao/viz.htm
CRU/Jones Southern Oscillation Index SOI just updated to Feb 2020
Data: crudata.uea.ac.uk/cru/data/soi/ -
Geert Jan van Oldenborgh
@gjvoldenborgh
Klimaatbericht over de westenwind van de winter en de relatie met klimaatverandering (hint: niet de NAO). www.knmi.nl/over-het-knmi/nieuws/westenwindwinter
-
Geert Jan van Oldenborgh
@gjvoldenborgh
Om misverstanden te voorkomen: het zijn dus geen statistische modellen met veel willekeurige parameters, maar modellen gebaseerd op fysica met maar een paar parameters die binnen nauwe ranges getuned worden om bv de top-of-atmosphere stralingsbalans goed te krijgen.
Geert Jan van Oldenborgh
@gjvoldenborgh
Deze modellen lossen de vloeistofdynamica en stralingswetten numeriek op voor de atmosfeer en oceaan, vaak gebaseerd op weersverwachtingsmodellen. Sub-grid schaal processen worden geparametriseerd mbv grond- en satellietmetingen. en.wikipedia.org/wiki/General_circulation_model
-
Geert Jan van Oldenborgh
@gjvoldenborgh
Deze modellen lossen de vloeistofdynamica en stralingswetten numeriek op voor de atmosfeer en oceaan, vaak gebaseerd op weersverwachtingsmodellen. Sub-grid schaal processen worden geparametriseerd mbv grond- en satellietmetingen. en.wikipedia.org/wiki/General_circulation_model
-
Geert Jan van Oldenborgh
@gjvoldenborgh
Here the list with a bit more post-processing: ganesha.xs4all.nl/data/list_rcp26.txt
-
Geert Jan van Oldenborgh
@gjvoldenborgh
The best way is to griep it from the metadata:
$ fgrep model_id icmip5_tas_Amon_one_rcp26_0-360E_-90-90N_n_???.dat
If you downloaded the netcdf version you’ll have to first ncdump the headers. Hope this helps.
Zeke Hausfather
@hausfath
@gjvoldenborgh, quick KNMI climate explorer question for you. If I download monthly global mean anomalies for all RCP2.6 CMIP5 models (one run per model), the results are for "ensemble member 0" through "ensemble member 31". How can I tell which models are which ensemble members?
-
Geert Jan van Oldenborgh
@gjvoldenborgh
Yes, much higher. The observations have a best fit of a factor four and an upper bound of infinity.
-
Geert Jan van Oldenborgh
@gjvoldenborgh
We define trends as a regression on the smoothed global mean temperature. This makes them much less sensitive to the starting date and allows a sensible extrapolation from 1979 to 1900.
Evan tan
@EvanstonWx
Also I note that the probability ratios of the ERA5 ratios are from 1920 to 2019 but ERA5 fire data is only available from 1978, so a linear trend was extrapolated to 1920s?
-
Geert Jan van Oldenborgh
@gjvoldenborgh
Also in ERA5, temperature is the main factor in the trend (orange bar).
Evan tan
@EvanstonWx
I suspect that some of the discrepancy between the observations and models is because of natural variability as a large proportion of the trend in ERA5 since 1978 is due to precipitation changes, which the study could not attribute to climate change.
-
Geert Jan van Oldenborgh
@gjvoldenborgh
Our WWA attribution study of Australian bushfire risk is out. TL;DNR: due to model deficiencies we can only compute a lower bound: climate change made fire weather as severe as observed this season at least 30% more likely, but it could be much more. www.worldweatherattribution.org/bushfires-in-australia-20…
-
Geert Jan van Oldenborgh reposted
KNMI
@KNMI
De kans op weer dat bosbranden veroorzaakt zoals de afgelopen mnden in #australië is door #klimaatverandering met tenminste 30% toegenomen. Dit blijkt uit onderzoek van World Weather Attribution (@wxrisk) olv KNMI en @UniofOxford. www.knmi.nl/over-het-knmi/nieuws/kans-op-bosbranden-austr…
-
Geert Jan van Oldenborgh reposted
KNMI
@KNMI
👇 In deze top 10 technologische doorbraken staat climate change attribution: onderzoekers kunnen nu de rol van #klimaatverandering in extreem weer herkennen. Trots op #knmi'er @gjvoldenborgh! #klimaatattributie
MIT Technology Review
@techreview
Every year, we pick 10 recent technological breakthroughs that we predict will have a big impact in the years to come. We're proud to release this year’s list of the technologies that we believe will make a real difference in solving important problems. www.technologyreview.com/lists/technologies/2020/
-
Geert Jan van Oldenborgh
@gjvoldenborgh
Really surprised to find our World Weather Attribution collaboration listed in the 10 breakthrough technologies of 2020 in the MIT Technology Review www.technologyreview.com/lists/technologies/2020/ while double-checking the Australian bushfire study @FrediOtto @RobertVautard @RCClimate @mkvaalst @wxrisk
-
Geert Jan van Oldenborgh
@gjvoldenborgh
The De Bilt winter temperatures as a function of the CO2 concentration as a rough proxy for anthropogenic global warming. Before 1975 the highest value was 5.3 ºC. A simple GPD fit shows that the odds of a winter as mild as 2020 are now one in six—this is almost the new normal.
-
Geert Jan van Oldenborgh reposted
KNMI
@KNMI
De wintergemiddelde temperatuur komt gezien de weersverwachting waarschijnlijk uit op 6,4 graden, de op een na hoogste sinds 1707. Zo'n hoge wintertemp. was vroeger vrijwel onhaalbaar maar komt nu ongeveer eens in de 6 jr voor. www.knmi.nl/over-het-knmi/nieuws/zo-n-zachte-winter-wordt… #klimaatbericht #winter
-
Geert Jan van Oldenborgh
@gjvoldenborgh
Severity of winters in the Netherlands 1902-2020 as measured by the "cold number": the sum of all daily mean temperatures below 0 ºC without minus sign. This last winter came in second with 0.1.
-
Geert Jan van Oldenborgh reposted
@maxvangeuns.bsky.social
@MaxvanGeuns
Als de lenteachtige temperaturen komende week aanhouden, verovert deze winter de tweede plaats op de ranglijst van zachtste winters sinds 1900.
“Een eeuw geleden waren zulke wintertemperaturen in Nederland ondenkbaar," aldus @gjvoldenborgh van het @KNMI.
www.trouw.nl/ts-bdab4ac4 -
Geert Jan van Oldenborgh
@gjvoldenborgh
Goed stuk in Vrij Nederland over de ‘warme Golfstroom’ (de Atlantische Meridionale Overturning Circulatie eigenlijk) en de rol daarvan in klimaatverandering, vooral wat er gebeurt als hij stilvalt. www.vn.nl/warmteregelaar-aarde-zwakt-af/
-
Geert Jan van Oldenborgh reposted
Dr Friederike Otto
@FrediOtto
These researchers are us @wxrisk
nature
@Nature
Researchers have started an attribution study to determine how much global warming is to blame for the blazes that have ravaged the continent. go.nature.com/37qB2RW
-
Geert Jan van Oldenborgh
@gjvoldenborgh
Solar forcing:
Predictions of cooling twenty years ago ❌
Predictions of cooling ten years ago ❌
See eg klimaatverandering.wordpress.com/2018/02/12/global-coolin… and my summary www.knmi.nl/over-het-knmi/nieuws/hoe-zijn-oude-klimaatvoo… -
Geert Jan van Oldenborgh
@gjvoldenborgh
Back to the attribution study of the Australian bush fires with the WWA team and a contingent of Australian colleagues. www.worldweatherattribution.org
Geert Jan van Oldenborgh
@gjvoldenborgh
The Climate Explorer server is up and reachable again. Please let me know if something does not work.
Geert Jan van Oldenborgh
@gjvoldenborgh
Due to first a wrong click by me and next one from the helpdeskersolving this problem it will take a few more hours before the Climate Explorer is up again.
Geert Jan van Oldenborgh
@gjvoldenborgh
The cloud provider hosting the KNMI Climate Explorer will be down for maintenance 14 and 15 January. For urgent, small calculations you can attempt to use my 9-yr old home computer, ganesha.xs4all.nl
-
Geert Jan van Oldenborgh
@gjvoldenborgh
The Climate Explorer server is up and reachable again. Please let me know if something does not work.
Geert Jan van Oldenborgh
@gjvoldenborgh
Due to first a wrong click by me and next one from the helpdeskersolving this problem it will take a few more hours before the Climate Explorer is up again.
Geert Jan van Oldenborgh
@gjvoldenborgh
The cloud provider hosting the KNMI Climate Explorer will be down for maintenance 14 and 15 January. For urgent, small calculations you can attempt to use my 9-yr old home computer, ganesha.xs4all.nl
-
Geert Jan van Oldenborgh
@gjvoldenborgh
Due to first a wrong click by me and next one from the helpdeskersolving this problem it will take a few more hours before the Climate Explorer is up again.
Geert Jan van Oldenborgh
@gjvoldenborgh
The cloud provider hosting the KNMI Climate Explorer will be down for maintenance 14 and 15 January. For urgent, small calculations you can attempt to use my 9-yr old home computer, ganesha.xs4all.nl
-
Geert Jan van Oldenborgh
@gjvoldenborgh
Bart kennende moet het een uitstekend boek zijn. En extern gereviewd.
KlimaatVerandering
@klimaatVeranda
Vanaf 22 januari in de boekhandel!
#klimaatboek
Een kort en bondig boek waarin duidelijk wordt uitgelegd wat er zoal bekend is over klimaatverandering. Zodat je het kaf van het koren kunt scheiden in de informatiejungle van het publieke debat.
www.bartverheggen.nl/index.htm
-BV -
Geert Jan van Oldenborgh
@gjvoldenborgh
The cloud provider hosting the KNMI Climate Explorer will be down for maintenance 14 and 15 January. For urgent, small calculations you can attempt to use my 9-yr old home computer, ganesha.xs4all.nl
-
Geert Jan van Oldenborgh
@gjvoldenborgh
Special (for me) interview in the Dutch national newspaper Trouw in which I publicly say I have been living with an incurable cancer for the last 6½ years. @flimsin and others persuaded me that showing you can lead a rich live with cancer would be worth it www.trouw.nl/wetenschap/weerman-worstelt-met-de-grillen-v…
-
Geert Jan van Oldenborgh reposted
Dakota Smith
@weatherdak
Mind-blowing view of explosive wildfires in southeast Australia on Saturday.
Rampant pyrocumulus forming within the smoke plumes. -
Geert Jan van Oldenborgh
@gjvoldenborgh
For what it is worth, here the CMIP5 climate model ensemble trends of precipitation over Australia up to now. No trend except around Perth, hatched means less than natural variability. The 2019 lack of rain cannot be connected to global warming based on this ensemble.
Geert Jan van Oldenborgh
@gjvoldenborgh
Note that this is only one thread of evidence, there has been a lot of work by the Australians on this which shows there could well be a connection that is not simulated by these models. See eg www.seaci.org/publications/documents/SEACI-1 Reports/Phas… and www.seaci.org/publications/documents/SEACI-2Reports/SEACI…
-
Geert Jan van Oldenborgh
@gjvoldenborgh
Wonderful illustration of the lies the climate change denial community employs. Change the variable from the Australia-wide average to a single, probably cherry-picked, station and change the time scale to make a false statement. The drought is extraordinary.
ducdorleans
@ducdorleans61
One can also accumulate over a longer period, say 4 yrs ..
Then there is first "a bit too much", then "a bit too little" ..
(Peakhurst GC is around Sidney ..)
As it always has been in Australia .. flood, drought .. drought, flood ..
Geert Jan van Oldenborgh
@gjvoldenborgh
Note that the drought (meteorological drought, lack of rain) has not been attributed to climate change, only the high temperatures. We need to do real work to find the answer, and will publish it regardless of the outcome, also when there is no connection.
-
Geert Jan van Oldenborgh
@gjvoldenborgh
On the IOD/DMI and drought in Australia. The SON DMI is correlated to ENSO (fig.1) so the correlation of DMI with precipitation shows a mixture of DMI and ENSO teleconnections (fig.2). Assuming ENSO influences the DMI, the DMI proper affects only East Africa and Indonesia (fig.3)
-
Geert Jan van Oldenborgh
@gjvoldenborgh
Daily rainfall averaged over Australia the last two years: moderate drought in 2018, extraordinary drought in 2019, especially the last few months. Source: CPC daily analyses via climexp.knmi.nl (of course).
-
Geert Jan van Oldenborgh
@gjvoldenborgh
Plot of the day: annual mean 2019 relative precipitation anomalies in the global CPC station-based analysis. -1 means no rain at all, -0.5 half the normal amount. Australia definitely sticks out, together with Southern Africa. (Not sure Greenland and Antarctica are reliable.)
-
Geert Jan van Oldenborgh
@gjvoldenborgh
Mooi artikel van @mkeulemans over hoe de klimaatverandering nu echt duidelijk geworden is. www.volkskrant.nl/wetenschap/de-klimaatverandering-is-nu-…
-
Geert Jan van Oldenborgh
@gjvoldenborgh
A) the newspaper you showed is from 11 January 1939, well within the BOM and Berkeley analyses and two degrees cooler than 2019. B) before ~1910 thermometers were often in direct sunshine: theconversation.com/factcheck-was-the-1896-heatwave-wiped…. Do you neglect this bias? Berkeley 1896 is much cooler than 2019.
When we refuse to talk, violence starts
@Willy1000
Do you have all the data so you can proof your point ? And again HOW do you know if data before 1900 is not existing or inaccurate ? ?
-
Geert Jan van Oldenborgh
@gjvoldenborgh
A newspaper screenshot is being circulated to prove that it was warmer in Australia before the BOM series starts in 1910. However, the date on the screenshot in 11 January 1939, which had an Australian average max temp of 39.6 °C (Berkeley), two degrees cooler than last Thursday.
Geert Jan van Oldenborgh
@gjvoldenborgh
The Berkeley Earth analysis starts in 1880, so clearly shows the higher temperatures observed before ~1910 when standard Stevenson screens were widespread. Before that they were often exposed to direct sunshine. These biased temperatures were still lower than this year’s ones.
Geert Jan van Oldenborgh
@gjvoldenborgh
See theconversation.com/factcheck-was-the-1896-heatwave-wiped… for a full discussion. In any case, the 1896 heat wave was much cooler than 2019 when averaged over Australia, even with thermometers exposed to sunshine.
-
Geert Jan van Oldenborgh
@gjvoldenborgh
The date on your newspaper is 11 January 1939, well within our analysis period. Berkeley gives an Australia-wide temperature of 39.6 om that day, two degrees cooler than last Thursday. You were right, it is well evidenced, but a lot less hot. Please add the date and temperature.
ACDC
@LawsonUBS
I saw the newspaper articles from Steven Goddard’s recent video...Most of the newspaper accounts seem to predate the graph you showed Zeke so curious your thoughts on the time bias aspect.youtu.be/rxJTZvRl13Q
-
Geert Jan van Oldenborgh
@gjvoldenborgh
No, these are trends in extremes, the hottest maximum temperature of the year. There is no reason why they should average to the global mean which averages the annual mean temperature, and it does not. Please trust the numbers and logic.
-
Geert Jan van Oldenborgh
@gjvoldenborgh
120 years covers the current fossil-fuel-driven warming trend very well. Given reconstructions of the global mean temperature it is very likely the highest for the last 1000 or more years as well. The higher temperatures on geological time scales are not relevant for us.
When we refuse to talk, violence starts
@Willy1000
So they should now that current temp are no record temperatures. Furthermore 120 years is a very short data range.
-
Geert Jan van Oldenborgh
@gjvoldenborgh
It is by far the highest Australia-averaged maximum temperature since records began. From the trends it looks only possible with the local and global warming trends due to the extra heating of the extra greenhouse gases. A formal attribution would require analysing climate models
Douglas Bamford
@dougbamford
is it not the hottest since records began? So what does the situation on a particular day have to do WITH ANYTHING?
-
Geert Jan van Oldenborgh
@gjvoldenborgh
Melbourne goes back to 1855 and the Berkeley analysis has decorrelation scales that are so large that one can estimate a country average from 1880. However, I distrust observations before 1900 as the standard Stevenson screens were introduced around that time in most countries.
When we refuse to talk, violence starts
@Willy1000
How old is the oldest data from australie ?
-
Geert Jan van Oldenborgh
@gjvoldenborgh
Yes, the Arctic warms 2-3 times faster than the global mean, more in the freezing half year, less in the melting half year. However, that is totally unrelated to Australian weather.
-
Geert Jan van Oldenborgh
@gjvoldenborgh
That is definitely a possibility, but the observations do not allow for a direct investigation whether this is the case. One of the reasons to also analyse climate model output in a full attribution study, which have much more data.
Glen
@Gergyl
What if, quaint thought, the behaviour wasn't linear?
-
Geert Jan van Oldenborgh reposted
Peter Thorne
@climpeter
I feel distinctly uneasy that we are now not just weighting the dice but effectively painting sevens on the dice. I hope I’m not alone in that.
-
Geert Jan van Oldenborgh
@gjvoldenborgh
A first look at the heat in Australia. Here the maximum temperature on 18 December of the ECMWF analysis and its anomaly compared with ERA-interim (still), plus the anomalies of the Australia-wide average over the last year (includes 10-dy forecast).
Geert Jan van Oldenborgh
@gjvoldenborgh
A simple GEV fit to the observed highest Tmax of the year since 1900 shifting with the global mean temperature (constant variability). I get a clear trend (of course) of 1.1±0.4 times the global mean temperature trend. The climate is extreme in Australia but the trends are not.
Geert Jan van Oldenborgh
@gjvoldenborgh
Even in the current climate this was a rare event, with a return time >100 yr if the assumptions underlying the fit hold. This gives a Probability Ratio that is formally infinite with a 2.5% lower bound of a factor 20. A full attribution study would add validated model results.
-
Geert Jan van Oldenborgh
@gjvoldenborgh
It depends strongly on the drought index. Our East Africa drought paper explores this (discussion paper www.earth-syst-dynam-discuss.net/esd-2019-20/), we are now doing the same for the eastern Netherlands. See also www.worldweatherattribution.org/analysis/drought/ for specific cases. No global results yet.
aaronshem
@aaronshem
Thanks. I think I recall there being a lot of conflicting evidence about drought area, is this wrong?
-
Geert Jan van Oldenborgh
@gjvoldenborgh
I would not call a temperature increase of up to 2.5 times global warming for hot extremes "slightly".
aaronshem
@aaronshem
Heat and dry extremes only increase slightly.
Geert Jan van Oldenborgh
@gjvoldenborgh
My slides are at www.dropbox.com/s/xz2mg1nwjkjx67c/oldenborgh_KNAW.pptx?dl=0
The cold extremes plots are from our recently-published ERL, iopscience.iop.org/article/10.1088/1748-9326/ab4867
The hot extremes from www.worldweatherattribution.org/trends-in-weather-extreme…
Drought from bibliotheek.knmi.nl/weerbrochures/droogterapport2018.pdf
Storms from www.earth-syst-dynam.net/10/271/2019/ and references therein. -
Geert Jan van Oldenborgh reposted
Zeke Hausfather
@hausfath
After a year of work our paper on evaluating performance of historical climate models is finally out! We found that 14 of 17 the climate projections released between 1970 and 2001 effectively matched observations after they were published. doi.org/10.1029/2019GL085378 1/19
-
Geert Jan van Oldenborgh reposted
World Meteorological Organization
@WMO
Greenhouse gases in the atmosphere reach new record high, locking in #climatechange for future generations. CO2 levels reached 407.8 parts per million in 2018, up from 405.5 ppm in 2017.
-
Geert Jan van Oldenborgh reposted
ipbes
@IPBES
"Nature is declining globally at rates unprecedented in human history"
—6 months ago @IPBES launched the #globalassessment Report, sparking unprecedented public interest in #biodiversity and #ecosystemservices
Soon available: the laid out version of the Summary for Policymakers -
Geert Jan van Oldenborgh reposted
KNMI
@KNMI
De #zeespiegel stijgt steeds sneller, #gletsjers en #ijskappen smelten. Mens en natuur staan in toenemende mate onder druk. De laatste inzichten in #zeespiegelstijging en de gevolgen voor Nederland kun je nu lezen in ons eMagazine magazines.rijksoverheid.nl/knmi/knmispecials/2019/03/index #deltacongres #ipcc
-
Geert Jan van Oldenborgh
@gjvoldenborgh
First look at Ottawa Tmin after yesterday's cold wave. Conclusion: just like the coldest Tmin of the year (doi.org/10.1088/1748-9326/aa9663) the coldest anomalies in November show a strong increasing trend, 2,5±1.5 times faster than the global mean temperature. Return time was ~11 yr now.
-
Geert Jan van Oldenborgh reposted
Zeke Hausfather
@hausfath
Here are trends in observations compared to CMIP5 for every possible starting date (through present). There are certainly periods where observations are warming slower than the CMIP5 multimodel mean (and some where they are warming faster, but they remain well within the range:
-
Geert Jan van Oldenborgh reposted
Tim Osborn
@TimOsbornClim
Ten years ago my (& my colleagues) work emails were hacked, made public & misrepresented in a media frenzy.
BBC4 will broadcast a documentary about the affair next Thursday at 9pm (www.bbc.co.uk/programmes/m000b8p2)
Here are my thoughts on what happened ⤵ -
Geert Jan van Oldenborgh
@gjvoldenborgh
Yes, I provided the graphs and links to data for that one :-). Did not know about the NASA one. KNMI is also planning one, maybe translating one of the many others and adding Dutch data makes most sense.
-
Geert Jan van Oldenborgh reposted
Dr Friederike Otto
@FrediOtto
A bit more serious than we usually are but still very excited to finally have done a video with @ClimateAdam!!
Hot Mess • PBS
@HotMessPBS
NEW VIDEO! We know that climate change is making extreme weather even more extreme, but how do scientists actually figure that out? Guest host @ClimateAdam explains: youtu.be/5cY7fSbUWA8
-
Geert Jan van Oldenborgh
@gjvoldenborgh
Very well-done climate dashboard site with lots of background information. www.metoffice.gov.uk/hadobs/monitoring/gcos.html
-
Geert Jan van Oldenborgh reposted
KNMI
@KNMI
Relatief koude gebieden, jaren, seizoenen, en dagdelen warmen over het algemeen sterker op dan warmere gebieden en tijden. Koud wordt dus steeds minder #koud. Meer weten? Lees het in ons nieuwste #klimaatbericht www.knmi.nl/over-het-knmi/nieuws/koud-wordt-steeds-minder…
-
Geert Jan van Oldenborgh
@gjvoldenborgh
A set of monthly fields and surface daily fields of 20CRv3 1836-2015 is now also available on climexp.knmi.nl. Thanks Gil et al for providing this valuable dataset esrl.noaa.gov/psd/data/gridded/data.20thC_ReanV3.html.(illustration: sea-level pressure on the coldest day in the Netherlands since 1901)
-
Geert Jan van Oldenborgh
@gjvoldenborgh
And methane and other GHGs. However, in CMIP5 it stays valid for another few decades (to my great surprise).
I thought using the long-term linear relationship between CO2 and GMST, plus the lower noise in CO2 than in GMST shows acceleration that is not yet visible in GMST itself
Cedric Knight🌍 @cedric@greennet.social
@Cedders68
It will cease to be linear as relative contribution of aerosols declines over time.
The observed trend has been nearer 0.2 K/decade. -
Geert Jan van Oldenborgh
@gjvoldenborgh
Why would you assume that the relationship is the same for long-term natural forcings and fast anthropogenic forcings that emerged over the last 140 years? "I cannot have killed the lady, your honour, because the last three women before her in the village died of natural causes".
Manuel Bussmann 🌍
@manuzb32
Easy to shoot holes: plot [CO2] against [GMST] for the *Holocene* and you will see it fails. No point in plotting last ±60 years, that's only 2 'climates' (2x30yrs). You need longer timescales.
-
Geert Jan van Oldenborgh reposted
Reto Knutti
@Knutti_ETH
This is the regression proposed by Greogry 2008 doi:10.1029/2008JD010405 Fig. 6., implicitly used by many before to estimate ECS/TCR from obs. energy budget. The problem is that the constant lambda assumption won't hold in the future (pattern effect).
iacweb.ethz.ch/staff/mariaru/pdfs/KnuttiRugenstein15.pdf -
Geert Jan van Oldenborgh
@gjvoldenborgh
I am afraid that hole is easily plugged. Except for these small ENSO, volcano and economic transients, CO2 concentrations follow emissions very closely and linearly up to now, so the fraction absorbed by the ocean and land (~50%) is constant in time.
-
Geert Jan van Oldenborgh
@gjvoldenborgh
Of course there are many forcings. It is surprising how they happen to conspire into a good approximation of a linear trend. There are also many time scales, not just one, the evidence from volcanic eruptions shows a lot is caught in the 1-2 years of land and ocean mixed layer.
-
Geert Jan van Oldenborgh
@gjvoldenborgh
Can someone shoot a hole in this? 1) Year-on-year increases in CO2 concentration are still rising (like emissions) and now ~2.5 ppm/yr. 2) Global mean temperature is an almost linear function of CO2 (as proxy of GHGs and aerosols) at ~0.011 K/ppm. So the trend is now ~0.25 K/10yr
-
Geert Jan van Oldenborgh reposted
Ed Hawkins
@ed_hawkins
The 20th Century Reanalysis has had a major upgrade to v3.
3 hourly weather data is available, with 80 ensemble members at ~70km spatial resolution, for 1836-2015. Amazing resource for examining historical extreme events to consider weather-related risks. www.esrl.noaa.gov/psd/data/20thC_Rean/ -
Geert Jan van Oldenborgh reposted
Dr Friederike Otto
@FrediOtto
What I’m doing in 1 min & cartoons. @wxrisk @khaustein
University of Oxford
@UniofOxford
Is our weather being made worse by climate change?
Find out what how @ecioxford researchers answer this question... #trueplanet -
Geert Jan van Oldenborgh
@gjvoldenborgh
Graph of the week (struggling with my health, or rather the lack thereof): summer AO index. Last year the highest value on record, his year one of the lowest ones. Trend in the mean? No. Trend in variability? Until 2018 lower than normal. Never underestimate natural variability.
-
Geert Jan van Oldenborgh
@gjvoldenborgh
Hi Zeke, where can I download the SSP concentrations? (I am quite ill so would prefer to avoid search myself today). I found similar discrepancies in the RCP and SREX scenarios (attached), although mainly in the higher ones (RCP8.5 and all SREX except B1).
Zeke Hausfather
@hausfath
There is an interesting overestimate of CO2 concentrations in both MAGICC6 and FAIR diagnostics for SSP projections that @RogerPielkeJr noticed. Any thoughts on where this might come from @JoeriRogelj @DetlefvanVuuren? How do these compare to values forcing CMIP6?
-
Geert Jan van Oldenborgh reposted
Zeke Hausfather
@hausfath
I've gotten a lot of questions about what warming to-date looks like if we start prior to 1960. Here is a map of the warming between the 1880-1900 period and the last decade (2009-2018) using Berkeley Earth data. Grey regions have no nearby measurements in the late 1800s.
-
Geert Jan van Oldenborgh reposted
Copernicus ECMWF
@CopernicusECMWF
📢 September #temperature highlights from #copernicus #c3s:
🌡️Globally, this year had the warmest September in our records, although it wasn't much warmer than September 2016
🌡️European temperatures above 1981-2010 average in most areas
More detail➡️climate.copernicus.eu/surface-air-temperature-september-2019 -
Geert Jan van Oldenborgh
@gjvoldenborgh
The cooling trend in western Siberia before 1950 was an artefact in Berkeley Earth, inconsistent with the station data in the region. It has also disappeared in the latest version (forcing me to redo all plots in our ERL with the new version).
-
Geert Jan van Oldenborgh
@gjvoldenborgh
New experience: talking at the KNAW tonight about Arctic Amplification and changes in extreme weather in the observations. If there is interest I can make the slides available. knaw.nl/nl/actueel/agenda/polaire-opwarming
Geert Jan van Oldenborgh
@gjvoldenborgh
My slides are at www.dropbox.com/s/xz2mg1nwjkjx67c/oldenborgh_KNAW.pptx?dl=0
The cold extremes plots are from our recently-published ERL, iopscience.iop.org/article/10.1088/1748-9326/ab4867
The hot extremes from www.worldweatherattribution.org/trends-in-weather-extreme…
Drought from bibliotheek.knmi.nl/weerbrochures/droogterapport2018.pdf
Storms from www.earth-syst-dynam.net/10/271/2019/ and references therein.
Geert Jan van Oldenborgh
@gjvoldenborgh
The daily precipitation plot is also in www.sciencedirect.com/science/article/pii/S2212094717301858 , for the hourly precipitation look up Geert Lenderink’s publications. Finally the snow plot is from climexp.knmi.nl/publications/Klimaatoverzicht_maart2018.pdf
-
Geert Jan van Oldenborgh
@gjvoldenborgh
I just updated NOAA daily ¼º SST up to 26 September and computed the monthly mean. It is available at climexp.knmi.nl/select.cgi?sstoiv2_monthly_anom . All the tools you mention are available under "Compute mean, s.d. or extremes". The form should be self-explanatory :-).
Dr. Robert Rohde
@RARohde
Do you know if any of the tools present deviations scaled to variance or ranked compared to prior years? In the low variance Atlantic, 0.5C is more unusual than other places.
I'm not at home, so it is harder for me to check the history myself at the moment. -
Geert Jan van Oldenborgh
@gjvoldenborgh
NOAA has weekly charts at www.emc.ncep.noaa.gov/research/cmb/sst_analysis/images/wk… (and the Climate Explorer daily data if you ask).
Dr. Robert Rohde
@RARohde
I don't have the results for September yet, but Lorenzo reached category 5 status near a part of the Atlantic that was record warm in August.
Warm ocean waters help to encourage the formation of the most powerful hurricanes. -
Geert Jan van Oldenborgh
@gjvoldenborgh
Even a bit more than that, we find the increase to be 9-17% (95% CI due to natural variability), although with a few assumptions. The main one is that the percentage increase is the same for all extreme precipitation.
Prof. Jean-Pascal van Ypersele (@bsky.social)
@JPvanYpersele
The observed increase in precipitation extremes is in line with the physics at work in climate change: a warmer atmosphere can contain more water vapour, and precipitation can therefore be more intense when it occurs
Geert Jan van Oldenborgh
@gjvoldenborgh
The WWA analysis of the extreme precipitation in Texas from TS Imelda is out www.worldweatherattribution.org/rapid-attribution-of-the-… Just like Harvey a clear, about two times, increase in probability due to climate change, corresponding to 9% to 17% increase in intensity @wxrisk @FrediOtto @karin_vdwiel @fldhzd
-
Geert Jan van Oldenborgh
@gjvoldenborgh
The WWA analysis of the extreme precipitation in Texas from TS Imelda is out www.worldweatherattribution.org/rapid-attribution-of-the-… Just like Harvey a clear, about two times, increase in probability due to climate change, corresponding to 9% to 17% increase in intensity @wxrisk @FrediOtto @karin_vdwiel @fldhzd
-
Geert Jan van Oldenborgh
@gjvoldenborgh
Winter forecasts: for some reason someone in the UK always forecasts the coldest winter ever around this time of year, the Daily Express used to do it every year. Needless to say, they have been wrong the last 8 years. The trend is to fewer cold extremes. www.volkskrant.nl/wetenschap/ja-winter-is-in-aantocht-maa…
-
Geert Jan van Oldenborgh
@gjvoldenborgh
Goede samenvatting van het WMO rapport over hoe we staan met het terugdringen van klimaatverandering. Ondanks alle goede voornemens gaat het nog steeds harder de verkeerde kant op in concentraties broeikasgassen, temperatuurstijging en zeespiegelstijging. www.knmi.nl/over-het-knmi/nieuws/broeikasgassen-nemen-ver…
-
Geert Jan van Oldenborgh
@gjvoldenborgh
Found some time to look at the floods in Spain a week ago. The climatology is different from southern France storms, which @RobertVautard et al investigated: in Spain the worst extremes are over sea and just touch the coast, with intensity decreasing going south along the coast..
Post not available here, view on X
Geert Jan van Oldenborgh
@gjvoldenborgh
3/ There are not enough comparable stations to detect a trend in the observations, even though many stations go back to the 1930s. I get an increase of 7% with a 95% CI of -11 to 25% (p~0.2), so compatible with Clausius-Clapeyron scaling, but also with no change and 2xCC scaling.
Geert Jan van Oldenborgh
@gjvoldenborgh
4/ Maybe somebody has time to look at the (huge) output of convection-permitting models that have been run for this area. I have to go back to real work.
-
Geert Jan van Oldenborgh reposted
World Economic Forum
@wef
Record-breaking heatwaves killed about 1,500 people in France wef.ch/2O8mr75 #climatechange #environment
-
Geert Jan van Oldenborgh reposted
Matthias Huss
@matthias_huss
Future of the Alp's biggest #glacier according to #ch2018 scenarios assuming moderate actions to protect climate. Our new study out in @igsoc (www.cambridge.org/core/journals/journal-of-glaciology/art…)
Is the global community willing to stand together to try and save this beauty of nature?
#cryospherewednesdays -
Geert Jan van Oldenborgh reposted
Erin Coughlan de Perez
@CoughlanClimate
This is fantastic.
giulio quaggiotto
@gquaggiotto
A gallery of uncertainty visualization methods www.scientificamerican.com/article/how-to-get-better-at-e… via @flowingdata
-
Geert Jan van Oldenborgh
@gjvoldenborgh
For the 1901-2019 average of the France Metropolitain temperature I get the same number. However, taking the summers of my childhood, 1961-1980, I only get 0.3% chance for France (only 1976 was comparable to modern summers). For me in the Netherlands, childhood normals are 2% now
-
Geert Jan van Oldenborgh reposted
Zeke Hausfather
@hausfath
A much fairer assessment of how much countries are doing to reduce their emissions is on a percentage basis. There while US reductions are admirable they are far from leading the pack:
-
Geert Jan van Oldenborgh
@gjvoldenborgh
For the seasonal means, already 10 years ago, Western Europe is warming much faster than expected, doi.org/10.5194/cp-5-1-2009. For the hot extremes, 6 years ago, Min et al, Evaluation of trends in high temperature extremes in north-western Europe in RCMs, doi.org/10.1088/1748-9326/8/1/014011.
Victor Venema
@VariabilityBlog
@gjvoldenborgh: “In the Netherlands, Belgium, France, the model trends are about two times lower than the observed trends”. e360.yale.edu/digest/europe-is-warming-faster-than-even-c…
Is this already published? -
Geert Jan van Oldenborgh reposted
Dr. Robert Rohde
@RARohde
Atlantic Hurricane Wind Speed vs. Ocean Water Temperature.
Most hurricanes form at water temperatures above 26 C (79 F), and the strongest storms are powered by the hottest water.
Global warming didn't create the hurricanes, but we worry that warming may make them stronger. -
Geert Jan van Oldenborgh
@gjvoldenborgh
Not sure why the Eurostar scores so well, but just bought my tickets to Oxford & Reading by train to discuss our Copernicus bid.
Professor Mark Maslin 👋 𝕏
@ProfMarkMaslin
#climatechange zero carbon emissions target means tackling transport
Worst are Domestic flights ✈️ an aviation fuel tax could make them prohibitive expensive
Replace international flights with ultra high speed trains 🚆
Vehicle & train 🚊 emissions removed by going electric ⚡️ -
Geert Jan van Oldenborgh reposted
Climate Centre
@RCClimate
Study published by @theAGU says #europe heating up faster than predicted by #climate models due to #climatechange; @mkvaalst notes heatwave casualities do not make news, but simple actions to help vulnerable groups 'can literally save lives' - www.climatecentre.org/news/1187/a-europe-is-heating-up-ev…
-
Geert Jan van Oldenborgh
@gjvoldenborgh
The 00Z ECMWF forecast for the track of Hurricane Dorian still has large uncertainties. Communicating these remains challenging, recent research shows that standard plots are often misunderstood.
Geert Jan van Oldenborgh
@gjvoldenborgh
-
Geert Jan van Oldenborgh
@gjvoldenborgh
PS The same graph for Uccle Belgium is at frankdeboosere.be/klimaatukkel/tropischedagen.php
Geert Jan van Oldenborgh
@gjvoldenborgh
A day with maximum temperature of 30.0 ºC or more here in De Bilt, like today, has become very normal. However, I am old enough to remember that in the old days, up to 1993, there were many years without these 'tropical days'. Summer heat has become much more common.
-
Geert Jan van Oldenborgh reposted
Karin van der Wiel
@karin_vdwiel
However, these averages mask large variability within regimes. In the paper we quantify the risk of extreme low #renewableenergy production and extreme high energy shortfall in each of the regimes. #spoiler: none of the regimes have zero risk. (4/5)
-
Geert Jan van Oldenborgh
@gjvoldenborgh
Request: does anyone know how to encode netcdf metadata into PNG and PDF files? The Climate Explorer now propagates all metadata into the final netcdf/ascii file, including the URLs that reproduce the calculation. I would like to also encode that into the graphics output.
Geert Jan van Oldenborgh
@gjvoldenborgh
I know there is an Adobe standard XMP but I cannot find tools that allow me to add arbitrary metadata outside the Dublin Core to the PDF/PNG file. Preferably in such a way that they survive processing. It would be cool to have all traceability info in the published figures.
-
Geert Jan van Oldenborgh
@gjvoldenborgh
A day with maximum temperature of 30.0 ºC or more here in De Bilt, like today, has become very normal. However, I am old enough to remember that in the old days, up to 1993, there were many years without these 'tropical days'. Summer heat has become much more common.
-
Geert Jan van Oldenborgh
@gjvoldenborgh
Tegenwoordig is een tropische dag (Tmax ≥ 30 ºC) heel normaal in de zomer, maar tot 1993 waren er veel zomers zonder tropische dagen in De Bilt.
-
Geert Jan van Oldenborgh reposted
KNMI
@KNMI
Het is 30℃ geweest in #debilt, dat is de derde tropische dag op rij. Nog nooit eerder sinds het begin van de metingen was er zo laat in het jaar een #hittegolf. Uitleg over hittegolven: www.knmi.nl/kennis-en-datacentrum/uitleg/hittegolf
-
Geert Jan van Oldenborgh
@gjvoldenborgh
The current heat wave is forecast to peak later in the week in Germany and Poland. No records except that it is late in the season. (Daily mean temperature anomalies in ECMWF deterministic forecast compared to ERA-interim.)
-
Geert Jan van Oldenborgh
@gjvoldenborgh
The third period of hot weather this summer has begun here in the Netherlands, it is already 30.5 ºC outside. Not as hot as in June or July, but if it becomes an official heat wave it would be the latest in the season on record. Source: De Bilt KNMI observations / ECMWF forecasts
-
Geert Jan van Oldenborgh reposted
Dr. Robert Rohde
@RARohde
Map of all the weather stations that have reported new all-time record highs in 2019 through July 31st.
In particular, the heatwaves in Europe in June and July smashed a huge number of local records.
(Based on preliminary data, records may still require verification.) -
Geert Jan van Oldenborgh reposted
Dr. Robert Rohde
@RARohde
July 2019 was 0.84 ± 0.06 C (1.51 ± 0.10 F) warmer than the 1951-1980 average.
Or equivalently, it was 1.22 ± 0.08 C (2.20 ± 0.14 F) warmer than the 1850-1900 average. -
Geert Jan van Oldenborgh reposted
Jonathan Overpeck
@GreatLakesPeck
Latest comprehensive (@PAGES 2k dataset and many reconstruction methods) global temperature reconstruction for the last 2000 years. More than ever, confirms the unprecedented global warming of the last 100 years. And yes, the Hockey Stick confirmed again. www.nature.com/articles/s41561-019-0400-0.pdf
-
Geert Jan van Oldenborgh reposted
Prof James Screen
@polar_james
Indeed! And we even think the specific influence of sea-ice loss is to cause warmer winters, fewer/weaker cold spells and reduced winter temperature variability:
- www.nature.com/articles/nclimate2268
- journals.ametsoc.org/doi/full/10.1175/BAMS-D-14-00185.1
- agupubs.onlinelibrary.wiley.com/doi/full/10.1002/2016GL06… -
Geert Jan van Oldenborgh
@gjvoldenborgh
Very nice paper showing that Arctic sea ice anomalies are not driving increased cold winters but are caused by the same atmospheric patterns that cause colder winters. Both on interannual and longer time scales. rdcu.be/bOyUE @polar_james @karin_vdwiel @bintanja
-
Geert Jan van Oldenborgh reposted
Andrew Dessler
@AndrewDessler
With the millionth download of @NaomiOreskes consensus paper, I thought it was worth a short thread discussion consensus.
x.com/SkepticalRanger/status/1158478690054918144 -
Geert Jan van Oldenborgh reposted
Olof Reimer
@OleBoule
No, wrong. The temperature trend has increased in the 21st century, at all atmospheric levels, and is now on par with the models..
-
Geert Jan van Oldenborgh reposted
Reuters
@Reuters
Heatwave caused nearly 400 more deaths in Netherlands: stats agency www.reuters.com/article/us-weather-netherlands-idUSKCN1UZ0GA
-
Geert Jan van Oldenborgh reposted
Henry Fountain
@henryfountain
My latest, on whether climate change affected last week's heat wave in Europe. But read the whole story (only 600 words!) for a bit of context on the Greenland situation that some people are hyperventilating about. www.nytimes.com/2019/08/02/climate/european-heatwave-clim…
-
Geert Jan van Oldenborgh
@gjvoldenborgh
We received the homogenised Uccle (Brussels) series too late to include in the heatwave study. The results are similar to Lille and De Bilt after correction for the change from an open to a closed Stevenson hut in 1983. Source: KMI. @meteobenl @meteobefr @RobertVautard @FrediOtto
Geert Jan van Oldenborgh
@gjvoldenborgh
For those who want the numbers: a fit to a GEV that shift with the smoothed global mean surface temperature gives a return period in the current climate of 75 yr (24...1500 yr), a return period around 1900 of >1400 yr, a probability ratio ∞ (>36), trend ∆T 2.6 ºC (1.6...3.5 ºC)
-
Geert Jan van Oldenborgh reposted
DWD Klima und Umwelt
@DWD_klima
Eine neue Attributionsstudie zur Hitzewelle Ende Juli ist erschienen: Zumindest für Frankreich und die Niederlande hätten solche Temperaturen ohne den Klimawandel nur sehr geringe Chancen gehabt. worldweatherattribution.org @IPSL_outreach @gjvoldenborgh @FrediOtto @StottPeter
-
Geert Jan van Oldenborgh reposted
Dr Friederike Otto
@FrediOtto
The heat in July broke records all around Europe due to climate change, but heat waves play out very differently in different places. Our new rapid analysis www.worldweatherattribution.org/human-contribution-to-the… looks at 5 places, including Oxford with over 200 years of data.
-
Geert Jan van Oldenborgh reposted
KNMI
@KNMI
Hittegolven zoals vorige wk waren vroeger vrijwel onmogelijk. De kans op zulke #hitte is nu 1-2% per jr. Dit blijkt uit studie #worldweatherattribution waaraan ook #knmi heeft meegewerkt. www.knmi.nl/over-het-knmi/nieuws/hittegolven-zoals-vorige… Kaart: in donkerrode gebieden was 2019 warmste sinds ten minste 1950
-
Geert Jan van Oldenborgh reposted
Daisy Dunne
@daisydunnesci
Another quick-fire attribution study has crunched the numbers for last week's heatwave across Europe.
"We find that it was much more extreme than any other heatwave we’ve looked at over the last few years," @gjvoldenborgh tells me.
Carbon Brief
@CarbonBrief
NEW - Climate change made Europe’s 2019 record heatwave up to ‘100 times more likely’ | @daisydunnesci @gjvoldenborgh @wxrisk www.carbonbrief.org/climate-change-made-europes-2019-reco…
-
Geert Jan van Oldenborgh reposted
Carbon Brief
@CarbonBrief
NEW - Climate change made Europe’s 2019 record heatwave up to ‘100 times more likely’ | @daisydunnesci @gjvoldenborgh @wxrisk www.carbonbrief.org/climate-change-made-europes-2019-reco…
-
Geert Jan van Oldenborgh reposted
KNMI
@KNMI
Temperaturen boven de 40°C werden tijdens de lange #hittegolf in juli vorig jaar niet gehaald. Wat maakt de afgelopen hittegolf dan zo bijzonder? www.knmi.nl/over-het-knmi/nieuws/absolute-temperatuurreco… Animaties: hittegolf 2019 (boven) en 2018 (onder). Pijl geeft zuidelijke, warme stroming aan. #klimaatbericht
-
Geert Jan van Oldenborgh
@gjvoldenborgh
We hebben al een gedeeltelijke analyse gedaan (www.knmi.nl/kennis-en-datacentrum/achtergrond/kans-op-elf…), echter nog zonder klimaatmodellen. De kans op zo'n koude winter is inderdaad sinds 1956 sterk afgenomen door de opwarming van de aarde door broeikasgassen en neemt verder af zolang we die uit blijven stoten.
Hugo Spain
@HugoSpain
Hoe gaat het KNMI de 'uitzonderlijke winter' van 1956 duiden? Of warmde 'het klimaat ???' toen nog niet op?
www.knmi.nl/kennis-en-datacentrum/uitleg/recordkoude-febr… -
Geert Jan van Oldenborgh
@gjvoldenborgh
Still working hard checking and rechecking our results. Publication scheduled for Friday 2-sep-2019 13:00 CEST. @FrediOtto @StottPeter @SISeneviratne @mkvaalst @khaustein
-
Geert Jan van Oldenborgh
@gjvoldenborgh
The KNMI Climate Explorer climexp.knmi.nl is currently unreachable, as far as I can see due to problems at our cloud computing provider. If you have urgent work please contact me for a workaround.
-
Geert Jan van Oldenborgh reposted
KNMI
@KNMI
☀️ Dagje aan zee? Het antwoord op 3 veelgestelde vragen over #zeespiegelstijging: Waardoor stijgt de zeespiegel? Wat kunnen we deze eeuw in Nederland verwachten? Hoe wordt de zeespiegelstijging gemeten? #klimaat
This media couldn't be displayed. See it on the original post. -
Geert Jan van Oldenborgh reposted
KNMI
@KNMI
In #debilt werd vorige week ook een record verbroken: 37.5°C. Deze temperatuur komt in het huidige klimaat zo'n eens per 70 jaar voor. www.knmi.nl/over-het-knmi/nieuws/hoe-bijzonder-zijn-de-ni… #klimaatbericht #hitterecord #hitte
-
Geert Jan van Oldenborgh
@gjvoldenborgh
Preliminary observations of the extraordinary European heat wave. Dark red areas indicate where the the highest maximum temperature of the summer so far is the record since at least 1950 (and, given global warming, probably a few hundred years more). Source: E-OBS analysis.
Geert Jan van Oldenborgh
@gjvoldenborgh
... and here how much hotter it has been than the average hottest day of the year in 1981-2010. We are working on an attribution study.
-
Geert Jan van Oldenborgh reposted
NESSC
@NESSCresearch
Are there future consequences of the increasing temperatures in the polar regions? Get up to speed on the newest insights during the KNAW symposium on September 30. NESSC-scientists Margot Cramwinckel @MargotCram and Michiel Baatsen will both give talks!
www.nessc.nl/knaw-polar-amplification/ -
Geert Jan van Oldenborgh reposted
Zeke Hausfather
@hausfath
There are lots of ways to compare climate models to observations, but here is one of my favorites (though one of the more complicated!). Trends in temperatures (colored lines) vs models (black line is the mean, shaded is model spread) from every possible start date to present:
-
Geert Jan van Oldenborgh
@gjvoldenborgh
First look at July 2019 NH temperature anomalies (ECMWF analyses/forecast vs ERA-interim). The Arctic Ocean is pegged at zero degrees as the energy is used for melting ice, not temperature increases. No Arctic amplification in summer near the surface. Alaska was extreme.
-
Geert Jan van Oldenborgh
@gjvoldenborgh
Mooi achtergrondstuk over hittegolven van @mkeulemans in de wetenschapsbijlage van de Volkskrant. Waarom is de waargenomen trend bij ons veel hoger dan de trend in modellen?@DimCoumou kijkt naar de straalstroom, ik naar de grond, we zijn er nog niet uit. www.volkskrant.nl/wetenschap/zo-extreem-heet-dat-kan-eige…
-
Geert Jan van Oldenborgh
@gjvoldenborgh
I never thought i’d see a return time plot straight from the Climate Explorer on the front page of a newspaper. www.volkskrant.nl/nieuws-achtergrond/met-temperaturen-bov…
-
Geert Jan van Oldenborgh
@gjvoldenborgh
The first time a temperature above 40 ºC has been observed in the Netherlands. (De Bilt also broke its record again.) I had not expected this to happen so quickly. @KNMI @RobertVautard @FrediOtto @StottPeter
-
Geert Jan van Oldenborgh reposted
Guardian World
@guardianworld
Netherlands and Belgium record highest ever temperatures www.theguardian.com/world/2019/jul/24/summers-second-heat…
-
Geert Jan van Oldenborgh
@gjvoldenborgh
Uitzonderlijk.... en morgen nog heter.
-
Geert Jan van Oldenborgh
@gjvoldenborgh
Weather forecast for the Netherlands for tomorrow. Note that the all-time record for De Bilt is 35.7 °C (2006 and 2018) and anywhere in the country from 38.6 °C (in 1944). If the forecast verifies both will be broken, with the help of a trend of 3 °C over the last century. @KNMI
-
Geert Jan van Oldenborgh
@gjvoldenborgh
Plot of the afternoon: areas in North America were the highest maximum temperature in 2019 (ECMWF analyses and forecast up to 30-jul-2019) is higher than the ERA-interim record. This was not an exceptional event in TXx except in a few isolated areas.
-
Geert Jan van Oldenborgh
@gjvoldenborgh
Plot of the day: map where in the ECMWF analyses and forecasts the highest maximum temperature of 2019 (up to 30 July) is higher than in ERA-interim. The noise on coasts is due to mismatches in resolution between the analyses/forecasts and ERA-interim. I'll switch to ERA5 soon.
Geert Jan van Oldenborgh
@gjvoldenborgh
... and the same map for a measure that is more robust and describes health impacts better, the maximum of a 3-day running mean of daily mean temperature. The forecast calls for the heat to move to Scandinavia at the end of the week, I do not know how reliable that forecast is.
-
Geert Jan van Oldenborgh
@gjvoldenborgh
Weather forecast for the next few days in De Bilt (ECMWF ensemble). The record for highest maximum temperature (red dashed line, the absolute record happened to be reached one day later in 2018) may well be broken.
Geert Jan van Oldenborgh
@gjvoldenborgh
I just hope the iPhone app (based on GFS I think) is wrong.
-
Geert Jan van Oldenborgh reposted
Nieuwsuur
@Nieuwsuur
De aarde wordt warmer, maar veroorzaakt dat nou ook écht extremer weer? #klimaatverandering #nieuwsuur
This media couldn't be displayed. See it on the original post. -
Geert Jan van Oldenborgh reposted
Jane van Laar
@JanevanLaar
Vanavond in @Nieuwsuur meer over het toeschrijven van specifieke weer gebeurtenissen aan klimaatverandering, "attribution science". Met @DimCoumou @gjvoldenborgh en Bart Verheggen van @klimaatVeranda
nos.nl/l/2293450 -
Geert Jan van Oldenborgh reposted
Prof Sonia I. Seneviratne
@SISeneviratne
S. auch dazu kürzlich erschienenen #gaia Artikel von @sciforfuture. @wozukunft @Knutti_ETH www.oekom.de/fileadmin/zeitschriften/gaia_leseproben/GAIA…
-
Geert Jan van Oldenborgh
@gjvoldenborgh
Another paper from ETHZ showed that for much of the world it is already impossible to match two variables. So how can you match 19? The annual mean temperature indicates that the analogues are not good at all. Extreme day differences are 2 times the trend. doi.org/10.1088/1748-9326/aa75d7
-
Geert Jan van Oldenborgh
@gjvoldenborgh
Curious about the London=>Barcelona transition. Annual mean temperature in London (Kew) was about 10.0ºC in 1971-2000, rising 0.2ºC per decade, so expect 11.5ºC or so in 2050, also in models. Barcelona annual mean temperature was 16.0ºC, so the trend is only 1/4 of the difference
-
Geert Jan van Oldenborgh reposted
Ed Hawkins
@ed_hawkins
Bit late this year but I have updated Fig. 11.25 from IPCC AR5 to include the 2018 global temperature observations.
Note the caveats about this comparison due to slightly inconsistent definitions of global temperature between models and observations: www.climate-lab-book.ac.uk/comparing-cmip5-observations/ -
Geert Jan van Oldenborgh reposted
The Lancet Planetary Health
@TheLancetPlanet
Hot off the press: New Comment from @ClimateDann, @KKornhuber Chris Huntingford and Peter Uhe providing some context for the record-breaking #europeanheatwave, its relationship to climate change and expected impacts on people.
#openaccess #publichealth
www.thelancet.com/journals/lanplh/home -
Geert Jan van Oldenborgh reposted
Roland Pease
@PeaseRoland
European heatwave leads BBC ScienceInAction today, again, with @gjvoldenborgh of @wxrisk explaining their figure, that #agw global warming has made such events >5 times more likely.
www.bbc.co.uk/programmes/w3csym1x -
Geert Jan van Oldenborgh reposted
Climate Centre
@RCClimate
‘Hotter but less deadly? #preparedness may cut toll of #europe’s heatwave’: @meganrowling's take on @wxrisk #climate-attribution study of Euro #heatwave; pic @CRAlicante, one @CruzRojaEsp branch reminding public to check vulnerable elderly in #oladecalor - www.climatecentre.org/789/a-hotter-but-less-deadly-prepar…
-
Geert Jan van Oldenborgh
@gjvoldenborgh
They forgot the "at least" in the first sentence and last paragraph, although it is included in between...
We should do some social research why it is so systematically left out.
Dr Friederike Otto
@FrediOtto
Was man aus unseren @wxrisk Studien lernen kann & wie es wäre wenn solche vom Wetterdienst kämen anstatt von einer Handvoll Wissenschaftler die eine Woche nicht schlafen: www.zeit.de/2019/28/hitzewelle-klimawandel-globale-erwaer… via @zeitonline
-
Geert Jan van Oldenborgh reposted
Dr Friederike Otto
@FrediOtto
Nice write-up of our @wxrisk study with link to more background on the science of event attribution
nature
@Nature
Scientists were able to perform real-time analysis while at a climate conference in France, where temperatures reached 45.9°C on 28 June. go.nature.com/2Nuita2
-
Geert Jan van Oldenborgh
@gjvoldenborgh
We did an attribution study of the 2014 cold (van Oldenborgh et al, BAMS, 2015) and rapid attribution studies of cold waves in 2016 and 2017/18. In all we found reductions of the probability, ~15x in 2017/18. The increase in temperature is about 2ºC due to less cold advected air.
-
Geert Jan van Oldenborgh
@gjvoldenborgh
Thanks for checking! In what respects?
Dann Mitchell
@ClimateDann
Agreed. We also ran last months heat wave through all ensembles of all models from HAPPI (>1000 runs) to prove @gjvoldenborgh wrong, we ended up proving him right :)
-
Geert Jan van Oldenborgh reposted
KNMI
@KNMI
De #hitte vorige week was uitzonderlijk in grote delen van Europa, zeker voor juni. In Frankrijk werd vrijdag 45,9 ºC gemeten. Een verband met de #opwarming van de aarde ligt voor de hand, maar hoe sterk is dat verband? www.knmi.nl/over-het-knmi/nieuws/extreme-hitte-frankrijk-…
-
Geert Jan van Oldenborgh
@gjvoldenborgh
We found disagreements between the observed and modelled trends and statistical properties of heatwaves. These can be due to other factors than climate change in the observations or the models misrepresenting the physics of extremes Without knowing why we only quote a lower bound
Prof Tamsin Edwards
@flimsin
Yes - I only skimmed the Ars Tech article not the original study to see why that low end was taken.
-
Geert Jan van Oldenborgh
@gjvoldenborgh
/At least/ five times more, could well be much higher.
-
Geert Jan van Oldenborgh
@gjvoldenborgh
Very good summary of our results.
Ars Technica
@arstechnica
Rapid results in on climate change and the European heat wave arstechnica.com/science/2019/07/rapid-results-in-on-clima… by @SJvatn
-
Geert Jan van Oldenborgh reposted
Karin van der Wiel
@karin_vdwiel
Very honoured that I will receive the 2019 @WMO Research Award for Young Scientists.
The winning research paper is our rapid attribution of the 2016 Louisiana Downpours in collaboration with @wxrisk, @gjvoldenborgh, @kiriwhan & others, published in @EGU_HESS. -
Geert Jan van Oldenborgh
@gjvoldenborgh
/zumindest/ verfünffacht, wahrscheinlich viel mehr.
Rico Grimm
@gri_mm
Jetzt haben wir die Zahlen: Die Hitze der vergangenen Woche war nicht "normal". Die Klimakrise hat die Wahrscheinlichkeit für so ein Ereignis verfünffacht.
-
Geert Jan van Oldenborgh reposted
Adam Vaughan
@adamvaughan_uk
“This is a strong reminder again, that climate change is happening here and now", says @FrediOtto of analysis which shows global warming made Europe's heatwave at least five times more likely (the true figure is likely "much higher", says @gjvoldenborgh) www.newscientist.com/article/2208331-climate-change-made-…
-
Geert Jan van Oldenborgh reposted
Carbon Brief
@CarbonBrief
+++BREAKING+++
Exclusive: France’s record-breaking heatwave made ‘at least five times’ more likely by climate change | @daisydunnesci @FrediOtto @StottPeter @wxrisk www.carbonbrief.org/frances-record-breaking-heatwave-made… -
Geert Jan van Oldenborgh
@gjvoldenborgh
The results of our rapid attribution study are out. We defined it as the June max of 3-dy daily mean temperature in France/Toulouse in June. This was at least five times more likely due to climate change @FrediOtto @RobertVautard @SISeneviratne @StottPeter www.worldweatherattribution.org/human-contribution-to-rec…
-
Geert Jan van Oldenborgh
@gjvoldenborgh
First, we said that they were /at least/ two times more likely. The "at least" gets dropped in almost all retellings of the results (even in the BAMS press release).
@huntercutting.bsky.social
@HunterCutting
Oldenborgh et al's analysis of 2018 heatwave only looked at a handful of stations, missing the huge extant of the event, thus finding only that #climatechange made the event twice as likely.
Geert Jan van Oldenborgh
@gjvoldenborgh
Second, the results indeed depend strongly on the event definition. Our goal is to attribute the aspect that is most relevant for health impact, so we took 3-day local mean or maximum temperature. If your aim is to get the strongest statement a large area average is better.
-
Geert Jan van Oldenborgh reposted
KlimaatVerandering
@klimaatVeranda
Interview met mij door @StraverFrank in @trouw:
“De aarde warmt op, het komt door ons, de gevolgen zijn serieus, maar we kunnen er nog iets tegen doen.”
-BV
www.trouw.nl/duurzaamheid-natuur/deze-klimaatwetenschappe… -
Geert Jan van Oldenborgh
@gjvoldenborgh
Where 2019 T2m has been the highest (dark red), second highest etc on record so far. The normally hottest part of the summer is yet to come. ECMWF analyses up to 27/6, forecast the next week, still ERA-interim for the past. @RobertVautard @FrediOtto @SISeneviratne @StottPeter
-
Geert Jan van Oldenborgh reposted
Prof Sonia I. Seneviratne
@SISeneviratne
and 2 hours ago 45.9 at Gallargues le Montueux also north of Montpellier.
www.meteofrance.fr/actualites/73726667-canicule-il-n-a-ja… -
Geert Jan van Oldenborgh reposted
Prof Sonia I. Seneviratne
@SISeneviratne
Heat record broken in France (44.3°C vs 44.1°C). I am in the train in the region (on my way back to Switzerland), air conditioning is not working well & I can confirm that it is very hot... @RobertVautard @StottPeter @gjvoldenborgh @FrediOtto @cassouman40 @valmasdel @ThieryWim
Météo-France
@meteofrance
🌡️44.3°C : nouveau #record de #température absolu battu à #carpentras dans le #vaucluse en ce vendredi après-midi à 13h48. Précédent record : 44.1°C à Conqueyrac le 12/08/2003. ⚠️ Attention ce record reste provisoire, la valeur pourrait encore augmenter.
-
Geert Jan van Oldenborgh reposted
Roland Pease
@PeaseRoland
Alerted that @gjvoldenborgh and a bunch of other extreme weather experts were at the heart of this European #heatwave #chaleur, and starting a 5 day study into its #agw global warming roots (?), we got him onto BBC ScienceInAction tonight www.bbc.co.uk/programmes/w3csym1w
@KNMI_weer -
Geert Jan van Oldenborgh
@gjvoldenborgh
We started an attribution study of the current heat wave in France. Most of us are at a meeting on attribution in the middle of it, Toulouse, with a GFS forecast of 41°C tomorrow. Record for June is 39.8 and overall 40.7°C. I am curious what it’ll be. Publication after the event.
-
Geert Jan van Oldenborgh
@gjvoldenborgh
The summer so far plus ECMWF forecast up to 1 July: the highest 3dy averaged maximum temperature (TX3x) compared to the 1981-2010 climatology (ERA-interim). /Forecast/ to be more than 6 ºC above normal in parts of France and northern Spain a month before the usual peak of summer
-
Geert Jan van Oldenborgh
@gjvoldenborgh
According to the ECMWF deterministic forecast next week could rival 2003 (ERA-i) in daily maximum temperature averaged over France and next averaged over one to five days. These heat waves warm much faster than GMST in the reanalysis, this contributes about 1ºC to the difference.
-
Geert Jan van Oldenborgh reposted
Ed Hawkins
@ed_hawkins
The world is warming.
Every country around the world is warming.
The world will continue to warm until the world chooses to stop burning fossil fuels.
#showyourstripes: showyourstripes.info
www.bbc.co.uk/news/science-environment-48678196 -
Geert Jan van Oldenborgh
@gjvoldenborgh
Our WWA take on the 2019 India heat wave. There is no positive trend yet in the maximum temperatures, as increasing air pollution and irrigation mask the trend due to global warming up to now. Both make health effects worse @FrediOtto @mkvaalst @makrishna
www.carbonbrief.org/guest-post-air-pollution-irrigation-m… -
Geert Jan van Oldenborgh reposted
Carbon Brief
@CarbonBrief
NEW - Guest post: Air pollution and irrigation mask extremes of India’s 2019 heatwave | @gjvoldenborgh @ClimateFlavors @FrediOtto @khaustein @mkvaalst @makrishna @wxrisk www.carbonbrief.org/guest-post-air-pollution-irrigation-m…
-
Geert Jan van Oldenborgh
@gjvoldenborgh
Plot of the day: trends in the wettest day of the year (RX1day) at US stations. Large increases east of the Rockies. I did assume a normal distribution rather than a GEV, which is probably not good enough in dry areas, will redo when the option appears in the Climate Explorer.
Geert Jan van Oldenborgh
@gjvoldenborgh
Checking whether there are any suspicious breaks in the series (I heard that in 1976 a lot of rain gauges were replaced) here the average of 697 TXx series of ≥80-yr GHCN-D stations east of 100ºW and at least 0.25º apart. I see no obvious problems after 1900 and a clear trend.
-
Geert Jan van Oldenborgh reposted
Dr. Robert Rohde
@RARohde
Based on year-to-date temperatures and trends, we currently project a 75% likelihood that 2019 finishes as the second warmest year since 1850, behind only 2016.
-
Geert Jan van Oldenborgh
@gjvoldenborgh
WMO promotes and protects high quality climate data. Plots and data via the KNMI Climate Explorer. public.wmo.int/en/media/news/wmo-promotes-and-protects-hi…
-
Geert Jan van Oldenborgh
@gjvoldenborgh
Plot of the day: India average of the highest daily max temperature of the year. These are usually reached in May or early June, the temperature drops as soon as the rains start. 2019 is high, but TXx has a decreasing trend: air pollution and irrigation beat greenhouse warming.
Geert Jan van Oldenborgh
@gjvoldenborgh
The trend in the highest daily mean temperature of th year, averaged over India, is positive as expected. (See van Oldenborgh et al, NHESS, 2018 for details. www.nat-hazards-earth-syst-sci.net/18/365/2018/)
-
Geert Jan van Oldenborgh
@gjvoldenborgh
Area-averaged or population-averaged?
Dr. Robert Rohde
@RARohde
The air quality in the US is quite good compared to many other countries, but it is not the best in the world (places like New Zealand and Scandinavia rate better).
Also, it has not been improving during the last two years. -
Geert Jan van Oldenborgh
@gjvoldenborgh
New WMO initiative: trusted climate data. Plots and underlying data for a large part via my Climate Explorer. climatedata-catalogue.wmo.int/climate_indicators
-
Geert Jan van Oldenborgh
@gjvoldenborgh
For users of the KNMI Climate Explorer: today and tomorrow the new cloud-based server is down due to security updates of the cloud provider. I set up an emergency server at climexp.knmi.nl with a subset of the data. Please do not use for large analyses or downloads.
-
Geert Jan van Oldenborgh
@gjvoldenborgh
Bad memory... About 15 years ago I read a (physical) book with the foundational papers of climate change science, starting with all the 19th century classics, annotated from a modern perspective. However, I cannot remember title or author and cannot find it back. Can anyone help?
-
Geert Jan van Oldenborgh reposted
Carbon Brief
@CarbonBrief
Analysis: How well have climate models projected global warming? | @hausfath www.carbonbrief.org/analysis-how-well-have-climate-models… #archive
-
Geert Jan van Oldenborgh
@gjvoldenborgh
Graph of the day: earliest day with Tmax ≥ 30ºC at De Bilt. Yesterday's value (2 June) is the 9th earliest in the series. Note that before 1990, many summers did not reach 30 ºC at all, which makes it hard to do a trend analysis.
-
Geert Jan van Oldenborgh
@gjvoldenborgh
Paper with @RobertVautard and @FrediOtto on attribution of wind storm probability/intensity in Europe. Models show a slight increase, observations large decrease, probably due to roughness changes. Until that is resolved we cannot give credible projections.www.earth-syst-dynam.net/10/271/2019/
-
Geert Jan van Oldenborgh
@gjvoldenborgh
Wordt het weer extremer door klimaatverandering? Met @DimCoumou geef ik antwoord op www.nu.nl/weekend/5852649/klimaatvraag-wordt-het-nou-natt… Kaart: trends in de warmste middag van het jaar in de GHCN-D stationsdata. In het oosten van de VS is het nu nog niet zo warm als in de droge jaren '30, o.a. door irrigatie
-
Geert Jan van Oldenborgh
@gjvoldenborgh
Monthly and daily Copernicus sealevel fields are now available on the @KNMI Climate Explorer climexp-test.knmi.nl (This will become the real server climexp.knmi.nl next Tuesday 11:00 CEST).
-
Geert Jan van Oldenborgh reposted
Intrepid Science
@Intrepid_Sci
Explore historic droughts with the Australian-New Zealand Drought Atlas (#anzda) now online on Climate Explorer @KNMI. Under 'Field', chose 'Monthly and seasonal historical reconstructions': climexp.knmi.nl/selectfield_rapid.cgi?id=f1ab1c882976a9e2… Thanks @gjvoldenborgh! #drought @cabahCoE @arc_gov_au @IOPscience
-
Geert Jan van Oldenborgh
@gjvoldenborgh
Some daily ERA5 fields 19790101-20181231 (19790102 for fluxes) are now available on climexp.knmi.nl (one big file/field) climexp-test.knmi.nl (10-yr chunks).
-
Geert Jan van Oldenborgh reposted
NU.nl
@NUnl
Een nieuwe serie waarin klimaatonderzoekers persoonlijk antwoord geven op jouw klimaatvragen. Met vandaag: hoe zit het nou eigenlijk met die temperatuurstijging?
nu.nl/weekend/5816718/klimaatverandering-hoeveel-warmer-w… -
Geert Jan van Oldenborgh
@gjvoldenborgh
Korte samenvatting van de opwarming, inclusief emmercorrectiefactor. www.nu.nl/weekend/5816718/klimaatverandering-hoeveel-warm…
-
Geert Jan van Oldenborgh reposted
KNMI
@KNMI
#temperatuurreeksen zijn belangrijk voor onderzoek naar #klimaatverandering. Door veranderingen in de manier van meten en de meetomstandigheden moeten historische gegevens worden herzien. In De Bilt gaat het vooral om de max. temp. in het zomerhalfjaar. www.knmi.nl/over-het-knmi/nieuws/homogenisatie-zorgt-voor…
-
Geert Jan van Oldenborgh
@gjvoldenborgh
Running 7-day average of Tmax. You can reproduce the plot on the KNMI Climate Explorer of course. climexp.knmi.nl
-
Geert Jan van Oldenborgh reposted
Prof Richard Betts
@richardabetts
If done well, with proper expert input on observed changes and attribution, talking about climate change in weather forecast broadcasts could be really valuable for public understanding of climate science. I’m all for it. www.theguardian.com/uk-news/2019/mar/19/use-forecast-to-t…
-
Geert Jan van Oldenborgh
@gjvoldenborgh
Plot of the day: on average spring arrives earlier in the Netherlands and Germany than anywhere else at 52 ºN. Spring definition: first week with averaged Tmax>15 ºC, other definitions give similar results. Data: ERA-interim 1979-2018 (daily ERA5 is almost ready).
Geert Jan van Oldenborgh
@gjvoldenborgh
Europe with more details (E-OBS 1950-2018)
Geert Jan van Oldenborgh
@gjvoldenborgh
And of course spring is now on average 2 to 3 weeks earlier than a century ago. Data: homogenised temperature at De Bilt, NL. The same shift can be seen in nature, www.naturetoday.com/intl/nl/observations/natuurkalender/s…
-
Geert Jan van Oldenborgh
@gjvoldenborgh
How much of this is dynamically driven and how much surface-driven? A while ago we showed that less snow in eastern Europe gives skill in predicting a warm spring. The Baltic also gives persistence skill this time of year. journals.ametsoc.org/doi/full/10.1175/2007MWR2094.1
-
Geert Jan van Oldenborgh reposted
HESS Journal
@EGU_HESS
New highlight article: Attributing the 2017 Bangladesh floods from meteorological and hydrological perspectives doi.org/10.5194/hess-23-1409-2019
-
Geert Jan van Oldenborgh
@gjvoldenborgh
Gewoon de grafiek bekijken, staat onder andere op climexp.knmi.nl/annual_overview_world_weather/index.cgi?v… . Van jaar op jaar zijn er toe- en afnames, maar de langjarige trend (groene lijn) is duidelijk naar boven. De pieken naar boven komen door El Niño, een natuurlijke schommeling in het klimaat.
Tjalco van der Meij 🇺🇦🇪🇺🇳🇱🇱🇹
@Tjalco
Ik lees ook dat satteliet metingen juist lieten zien dat de temperatuur de laatste jaren is gedaald. Wat moet ik geloven?
-
Geert Jan van Oldenborgh
@gjvoldenborgh
Klopt, was voor de meelezers.
-
Geert Jan van Oldenborgh
@gjvoldenborgh
De invloed van de zon op de temperatuur aan de grond is met veel moeite te zien is minder dan 0.1 ºC. Broeikasgassen en aerosolen zijn voor 1.0 ºC verantwoordelijk. Dit is gebaseerd op redelijk simpele natuurkunde en wordt bevestigd door de oude voorspellingen te bekijken.
-
Geert Jan van Oldenborgh
@gjvoldenborgh
Attributing the 2017 floods in Bangladesh to climate change gave unexpected results: no trend in extreme rainfall up to now, but a trend towards more extremes is projected as the aerosol cooling is reduced. Hydrological models show the same for discharge. www.hydrol-earth-syst-sci.net/23/1409/2019/
-
Geert Jan van Oldenborgh
@gjvoldenborgh
Dit is de temperatuur in the thermosfeer, meer dan 80 km hoog, en heeft niets met de temperatuur aan de grond te maken.
-
Geert Jan van Oldenborgh reposted
KNMI
@KNMI
Regelmatig wordt voorspeld dat de #aarde binnenkort gaat afkoelen door de afnemende zonneactiviteit. De zonneactiviteit is de laatste tien jaar inderdaad afgenomen, maar de aarde blijft opwarmen. Hoe kan dit? www.knmi.nl/over-het-knmi/nieuws/hoe-zijn-oude-klimaatvoo… #broeikasgassen #klimaatbericht
-
Geert Jan van Oldenborgh
@gjvoldenborgh
Nice article in the Washington Post on our #elfstedentocht (Eleven Cities Tour) and the effect climate change is having on it, with a quote and graph from me. www.washingtonpost.com/news/sports/wp/2019/03/07/feature/… (our article on the changing odds is at www.knmi.nl/research/weather-climate-models/updates/proba…)
-
Geert Jan van Oldenborgh
@gjvoldenborgh
Returning to the high maximum temperatures last week, here maps of the anomalies on 27 and 28 February. It was not only the Netherlands and England but most of Europe. @RobertVautard @MartinStendel @RARohde @climpeter @TimWoollings @SimonLeeWx Source: ECMWF analysis, ERA-interim.
-
Geert Jan van Oldenborgh
@gjvoldenborgh
I had the great honour of visiting the world’s longest continuously operating weather station, @RMS_Oxford. Still hand-operated of course. Last Tuesday’s record was not as extreme as in Reading or the CET. climexp.knmi.nl/becatmax.cgi?id=ec8907341dfc63c526d08e36d…
-
Geert Jan van Oldenborgh reposted
Andrew King 🌈
@AndrewKingClim
Australia has just had its hottest summer on record easily beating the previous 2012/13 record. Heat forecast to continue through autumn too 🥵 Useful summary from @BOM_au theconversation.com/2018-19-was-australias-hottest-summer…
-
Geert Jan van Oldenborgh
@gjvoldenborgh
Plot of the week: First look at February temperatures (last two days from forecasts). Both warm and cold extremes in North America.
-
Geert Jan van Oldenborgh reposted
KNMI
@KNMI
Vandaag 18,9 ºC in De Bilt, de hoogste februari-temp. hier tenminste sinds het begin van de metingen in 1906. De kans op zo'n extreem in het huidige #klimaat is minder dan 2%, een eeuw gelden was zo'n extreem vrijwel onmogelijk. www.knmi.nl/over-het-knmi/nieuws/zachte-februaridagen-zel… #klimaatbericht
-
Geert Jan van Oldenborgh
@gjvoldenborgh
De Bilt recorded 18.9 ºC today, a new February record. Fitting a GEV to the highest February temperatures (surprisingly well-spread in the month) gives these graphs with cut-off. "Extremely unlikely" or "virtually impossible" a century ago? T>10000 yr with a few assumptions.
-
Geert Jan van Oldenborgh
@gjvoldenborgh
Please disregard, I found that the underlying data had not been updated as I assumed and it only covers the first half of February.
-
Geert Jan van Oldenborgh reposted
KNMI
@KNMI
Met #satelliet #tropomi zien we vaak kleine pluimen #so2 uit de vulkaan #popocatepetl komen, maar sinds half februari is de Mexicaanse #vulkaan duidelijker actiever geworden. Benieuwd waar deze Tropomi data voor gebruikt worden? Volg knmi_nl op Instagram: www.instagram.com/p/BuG0q4YgNbX/
-
Geert Jan van Oldenborgh
@gjvoldenborgh
It is a continuous mono-modal distribution so any cutoff is arbitrary. Let's call it El Niñito.
Peter Thorne
@climpeter
It’s the El Niño yes no yes no maybe perhaps not sure meh
-
Geert Jan van Oldenborgh reposted
Jos Olivier
@JosOlivier
#nyt: Racing the Clock, and Climate Change - beloved #dutch Frysian "Eleven Cities Iceskating Race" relocated to Austria www.nytimes.com/2019/02/07/sports/ice-skating-climate-cha…
More details on chance on an "Elfstedentocht", 1900 - 2017:
translate.google.nl/translate?hl=nl&sl=nl&tl=en&u=https%3… @Compendium_CLO) www.knmi.nl/research/weather-climate-models/updates/proba… @KNMI -
Geert Jan van Oldenborgh reposted
KNMI
@KNMI
2018 kleurde buiten de lijntjes. Bekijk het KNMI #jaaroverzicht: magazines.rijksoverheid.nl/knmi/knmi-jaaroverzicht/2018/0…
-
Geert Jan van Oldenborgh
@gjvoldenborgh
These are re-analysis data of near-surface temperature, so not directly comparable to the temperature of the lower troposphere. They are very similar to the other filled-in datasets. ERA-interim does have TLT as well, in good agreement with the models. rmets.onlinelibrary.wiley.com/doi/full/10.1002/qj.2317