Politicians, athletes, journalists, NGOs, companies... They all use
corporation-owned social networks to communicate with us. Citizens
shouldn't have to hand over their data to companies to read content
published by public entities. Public Feeds changes that by making posts
of popular accounts freely available.
Read more.
Matplotlib
Matplotlib (a portmanteau of MATLAB, plot, and library) is a plotting library for the Python programming language and its numerical mathematics extension NumPy. It provides an object-oriented API for embedding plots into applications using general-purpose GUI toolkits like Tkinter, wxPython, Qt, or GTK. There is also a procedural "pylab" interface based on a state machine (like OpenGL), designed to closely resemble that of MATLAB, though its use is discouraged. SciPy makes use of Matplotlib. More on Wikipedia
🚀 This week, we're teaching Artificial Neural Networks (ANNs) in my Machine Learning course! 🧠 That's a lot to unpack, eh? 🤯 So, how do we do it?
🔥 After working through the concepts and steps, we build and train a simple ANN together, from the ground up, using only NumPy (@numpy_team)! 💻 Every step is transparent. No black boxes! 💥
⚡ I even built an interactive dashboard using @matplotlib and ipywidgets so students can experiment with the ANN and see how it works! 🎮
Hey folks, interested in contributing and a bit ??? on where to start? Drop into our new contributor meeting (Europe/Asia/Africa friendly time) to learn a bit more about the process & ask us about work you wanna do (or already are doing).
Working on any fun fall projects? Join our next data craft circle gathering for cozy crafting and conversations! Whether you bead, collage, embroider, or just want to try something new, come meet others who are working on analog data projects. www.eventbrite.com/e/data-craft-circle-tickets-2003259801994
I’ve never been able to draw, until I learned to turn math ideas into code and explore visualizing things. More than 20 years ago I started with @WolframResearch Mathematica, now ~1000 #python scripts: from complex analysis to statistical mechanics to fractals. #builtwithmarimo
It removed many of our legacy decisions makes the streaming engine our default and promotes SQL to a first class citizen within Polars.
It comes with initial out-of-core (spill to disk) support, a new Map data type and a lot of performance improvements. In fact, we think Polars is now one of the fastest analytical SQL engines on a single node. See benchmarks in the post: pola.rs/posts/release-polars-2/
A classic Monte Carlo simulation, it takes me right back to my student days. 16 cars of equal length park at random along a street 20 cars long. #builtwithmarimo#python#numpy#matplotlib Thanks Claude Code for drawing nice cars in matplotlib 😀
It can take the models a cycle or two to train on our newest features, so please ask the model which version it's coding against & check our release notes to see what new things you can do w/ us!
MDAnalysis just landed a Research Software Maintenance Fund grant — enough to hire a dedicated Research Software Engineer. That’s what sustained backing does: it turns “someone squeezes this in” into “someone’s job is to make sure this works.” Support like Max the Stack keeps that momentum going. numfocus.org/support?hss_channel=tw-1068951084
Today in my machine learning class, we covered probability. During our discussion of Bayesian probability, we worked through the Sivia Bayesian coin demo. Then I opened my interactive @matplotlib#python dashboard and formulated our prior and likelihood directly in the computer!
We want your vote! Voting eligible PSF Members (Supporting, Contributing, and Fellow) need to affirm their membership to vote in this year’s PSF Board and/or Python Packaging Council elections to ensure that each election reaches quorum 🗳️ #python
🧩 Talk Spotlight: Hadley Wickham shares 20 years of tidyverse lessons; data grammar that shaped how we think about wrangling. Plus, his take on AI's impact on future data science workflows 🚀 #scipy2026 🔗 scipy2026.scipy.org
Hey folks, have you been working w/ Matplotlib long enough to have interacted w/ our deceased founder John Hunter? For SciPy2026 reasons, we'd love to hear/read about your memories 🥰
🚀 Get ready for an amazing week of talks, tutorials, community events, and great hallway conversations! Can’t wait to see you all in Minneapolis soon 🐍📊
🎉 Scikit-learn 1.9 released: ■Solid improvements to many existing estimators: faster, more stable, handling missing values, adding GPU support… ■Also, enhanced estimator displays in notebooks, ■And callbacks that enable progress bars or monitoring of convergence
Tree-based gradient boosting is an ensemble method that builds a powerful prediction model by sequentially adding weak learners (often decision tree stumps). 🌲📈
To help my students really get it, I built a #python@matplotlib interactive dashboard 🚀🐍
I’m stoked to teach density-based cluster analysis to my students! 🔥
Agglomerative clustering is a bottom-up hierarchical method: each point starts as its own cluster, then pairs of clusters are repeatedly merged based on similarity until one tree of clusters (a dendrogram) is formed 🌳
Very intuitive—it mirrors how we naturally perceive structure—like pointillism 🎨, where meaning emerges by progressively merging nearby points of similarity into coherent patterns!
To help my students visualize density-based cluster analysis, I built an interactive #python dashboard with @matplotlib 📊🚀
We have a pre-release we'd love y'all to test! Especially if you use non English scripts - a major part of this release is the overhaul of text and font processing to support modern font features, enabling full internationalization in all languages. github.com/matplotlib/matplotlib/releases/tag/v3.11.0rc1
A degree-100 polynomial p. Color each point z of the plane by arg(p(z)). The zeros are the points where the full color cycle closes on itself. Let the roots drift, and the colors flow with them. Made with #python#numpy#matplotlib in a @marimo_io notebook.
Analiza widoczności 329 szczytów Tatr (>2000 m n.p.m.) w promieniu 50 km. Dla każdego z 222 tys. heksagonów obliczono line-of-sight na modelu terenu Copernicus DEM 25m. @matplotlib@GdalOrg
I taught Claude Code to make beautiful @matplotlib charts!
I Built an opinionated skill for publication-quality figures, in a style that I like. It's a work in progress and I hope others will contribute. github link below 👇
We've recently released many new features that improve the developer experience for computational research, ML, and AI, including a native reactive @matplotlib element, PyTorch formatters, and remote storage inspector.
Hey folks! Interested in GSOC? Unclear how to use AI properly? Want to contribute and it's all feeling a little ?! Join us for our monthly new contributors meeting and ask all the questions!
Our latest release brings richer interactivity to machine learning and scientific computing workflows, including reactive @matplotlib plots, a matrix UI element, a native rich visualizer for @PyTorch modules, and a thread-safe progress bar for parallelizing work.
I started studying the cycle lemma and ended up creating this math art by applying cyclic permutations to a family of random walks with equal numbers of up and down steps. What is the cycle lemma? Interactive Molab below 👇 Made with #python#numpy#matplotlib and @marimo_io
I just created a perfectly working GnuRadio + QT + numpy + matplotlib program with Microsoft's Co-Pilot built into Visual Studio code. No need for expensive Claude/Anthropic credits.
It’s our birthday! 🎉 We’re beyond grateful to have spent another year supporting open source science champions like our Sponsored and Affiliated Projects. We want to say a huge thank you to everyone in our community who helps us continue this work. Here’s the future of what we can do together!
To help my students really understand hypothesis testing (not just memorize it!), I built an interactive #python dashboard with @matplotlib.
Pick different sample sets and explore the raw data (left), then watch the theoretical sampling distribution, test statistic, and critical values update live. 📊✨
Now the fun part — tweak the data until the difference in means actually becomes statistically significant. What it takes to cross that critical threshold! 🚀🔥
It’s hands-on, visual, and a great way to move from equations → intuition.
There is one more chance to join the SciPy organizing committee's Proposal Writing Office Hours on Feb. 20! Learn more on how you can get advice to polish up your proposal before hitting submit at: docs.google.com/forms/d/e/1FAIpQLSc2cViGz6wILuXtmCsvACyFy…
To help my students build intuition about analytical confidence intervals, I created an interactive #python dashboard using @matplotlib.
Adjust the sample size (n), sample mean (x̄), sample standard deviation (s), and significance level (α) to see the equation update in real time — along with the uncertainty distribution and corresponding confidence intervals.
Pair particle annihilation. We know Einstein-Rosen bridges pinch off and collapse (absent negative mass); that is the prototype for our topological pair particle annihilation event. When matter and antimatter particles meet, we model the topological collapse resulting in annihilation and the orientation of the resulting gamma rays. Check out the code...
The SciPy organizing committee has two more office hours happening this week to help you polish your proposal. This is great for everyone, but especially first-time submitters. Learn more and sign up for a time at docs.google.com/forms/d/e/1FAIpQLSc2cViGz6wILuXtmCsvACyFy…
In my new free, online #datascience e-books, I focus on creating effective and impactful visualizations.
The first step I take is always to ask: What message am I trying to communicate with this plot? From there, I design the plot specifically to make that message clear and intuitive. Rarely are my visuals the default, generic plots—each one is crafted to enhance understanding and engagement. See my ideas for model and #dataviz with,
Want to submit a proposal for @SciPyConf 2026, but need a little help? We got you. The organizing committee is hosting office hours to help you polish your proposal. This is great for everyone, including first-time submitters. Learn more and sign up at www.scipy2026.scipy.org?hss_channel=tw-750554018.
👀 But also we support a whole lot of interactivity out of the box + a whole lot of ways for you to build custom interactivity. PRs to improve the docs very welcome: matplotlib.org/stable/gallery/event_handling/index.html
After years of collaboration, thousands of commits, and incredible community coordination, NumPy 2.0 shipped smoother than anyone imagined possible in the 2010s. Ralf Gommers celebrates the teams and individuals who made it happen at #pydata Paris 🎉 🎬 www.youtube.com/watch?v=rHWCygZQgsw
And add pylustrator to make it easier to style your matplotlib plots! We also recently switched to a uv based workflow for installing and testing. I am amazed how fast and convenient uv is.
SciPy 2026 Early Bird Tickets are live! There are only 100 Early Bird tickets available. So, jump on it to get yours! Snag yours at ti.to/scipy/scipy2026?hss_channel=tw-750554018 SciPy 2026 Info: Tutorials: JULY 13-19 University of Minnesota: McNamara Alumni Center 200 Oak Street S.E., Minneapolis, MN
🎉 We’ve received 709 responses to the 2025 SOTI Survey so far! Take the survey if you create #dataviz in any capacity (hobby, work, school, art), and help us spread the word: www.surveyhero.com/c/soti2025-x
The other day I saw a post of someone visualizing the number Pi and I thought it's a good idea for a mini visualization project.
The workflow was simple. ✅Get fairly reliable pi calculation (mpmath) ✅Transform decimal points into a grid (numpy) ✅ Assign one colour per digit and plot (@matplotlib )
Mentee applications are now open for the next cohort of the DVS mentorship program! Talented mentors from around the globe and across disciplines, techniques, and tech stacks are ready to guide you in exploring new skills and career goals! Learn more: datavisualizationsociety.org/mentorship/
🗓️ SciPy reminder: Just over a month left to submit!
The CFP submission deadline is February 25. If you’re working on a talk, tutorial, or poster, now’s a great time to start polishing and get ready to submit to your favorite conference! 🚀
⚙️ Call for Workshops at IEEE VIS 2026! Have an idea worth exploring with the VIS community? Create an informal, open setting for discussion, collaboration, and innovation – propose a Workshop! 🗓 Deadline: Feb 26 🔗 shorturl.at/HGamZ
When we say “Maxed-Out Gratitude,” we mean our community. Without you, there’s no Stack to Max. Thank you for making NumFOCUS more than just code — you make it people-powered. Ready to keep that momentum going? Donate today and help us Max the Stack at 39929437.hs-sites.com/hs/payments/wNGbqSzYgvN4vf?referrer…
Today in my #machinelearning course, we’re diving into artificial neural networks! 🧠
I’ve recently updated my course materials to cover all the nuts and bolts — from forward propagation through the network to backpropagating the error derivatives for updating weights and biases.
To make it even more interactive, I built a new #python@matplotlib dashboard using the same example from my course notes. Excited to share this new hands-on content with my students today! 🚀 Stoked!
I recently taught tree-based gradient boosting in my #machinelearning course, and I could tell some students did not fully understand how it works.
So last night, I built an interactive #python@matplotlib dashboard to bring it to life!
You can train a gradient boosting model and step through each additive weak learner (stump tree) — while watching the training loss function descend via gradient updates!
Key takeaways: 1. Each weak learner is very simple on its own 2. Every model adjusts all predictions, not just a subset 3. Each learner represents an optimization step to minimize the training loss
Seeing the process unfold interactively really helps connect the #datascience to intuition. Stoked!
Here are a few Spirograph (hypotrochoid) demos made with #matplotlib. The pattern depends on the two radii and where exactly the pen is placed on the small circle.
I found the final boss of evil colormaps. It maps to an arbitrary(!?) pattern in greyscale. If you see a colormap like this during paper review, ask to change to one of the sequential colormaps of #matplotlib instead!
The Bak-Sneppen model: species in a circle, each with random fitness. Replace the weakest species (and its neighbors) with new random values. Cascading evolutionary avalanches emerge, showing self-organized criticality from simple rules. Made with #python#numpy#matplotlib
On Monday’s lecture, I introduced Bayesian linear regression and explained MCMC using the Metropolis-Hastings algorithm to sample from the posterior… but I could tell it wasn’t fully landing with the students 😕.
So yesterday, I built an interactive dashboard in #python using @matplotlib 🎨 that steps through the Markov chain 🔁—visualizing how the prior, likelihood, and acceptance probability are calculated at each step. The statistics come alive! 📈✨
Shape priorities and direct the future of DVS by joining the Board of Directors as our Programs Director. Hone your leadership skills and contribute to a highly engaged community of data viz enthusiasts. Apply by October 21: datavisualizationsociety.org/nominations/.
As part of my Bayesian linear regression lecture, I introduce Markov Chain Monte Carlo (MCMC) methods to sample from posterior distributions of model parameters. We start with the Gibbs sampler — by sampling from accessible conditional distributions, we can approximate an otherwise inaccessible joint distribution! 🔁📊
Thrilled to share @scverse_team x @ProjectBiomni! Biomni agent now supports 10 scverse core packages including scanpy, squidpy, scirpy, pertpy, etc! You can now use natural language to unlock complex single cell, spatial, and perturbation data analysis to generate novel hypothesis.
A simple MCMC (heat bath) simulation of the 3D Ising model in magnetic field, equivalent to the lattice gas-liquid model at finite temperature and chemical potential. A good excuse to try using voxels in @matplotlib Made with #python#numpy#matplotlib
Today, we dive into sampling with replacement—pulling red and yellow blocks from my trusty cowboy hat 🤠 to explore uncertainty in the underlying distribution.
Then, it’s time to fire up an interactive #python dashboard powered by @matplotlib. We run many realizations and watch bootstrap in action—visualizing variability, confidence intervals, and the beauty of resampling. 📊🔁
🎲 Monte Carlo Simulation (MCS) is one of the most powerful and versatile tools in #statistics developed over the past century.
When I introduce MCS to my students, we all launch my interactive #python dashboard using @matplotlib and we walk-through examples of adding and multiplying random variables → doing math with distributions! 📊➕✖️
You can explore the interactive notebook on my #github repo:
When I teach the Gaussian transformation, also known as Gaussian anamorphosis, I fire up my interactive #python 📊 dashboard using @matplotlib to visualize the mapping through cumulative probabilities and creation of the associated Q-Q plot 📈.
While teaching Principal Component Analysis (PCA), I use this interactive Python @matplotlib dashboard to demonstrate both the forward and reverse transformations during dimensionality reduction!
You can add a new data point and move it around, watching it go through each step: standardization, projection onto principal components, dimensionality reduction, projection back to the standardized features, and inverse standardization!
🔍 Curious about Monte Carlo simulation? Join me for a hands-on walk-through of my interactive Python 📊 dashboard built with @matplotlib! 💻 Download the code 🧠 Follow along 📈 Get hands-on experience with one of the most powerful and impactful statistical innovations of the 20th century.
Quantifying spatial continuity, i.e., the amount of variance (or change) observed over distance is very powerful. Whether in agriculture, forestry, groundwater, or the exploration of minerals, oil, and gas, understanding spatial continuity leads to better resource management.
Ever wondered what goes on behind the scenes at #euroscipy? We're pulling back the curtain on the #euroscipy2025 Call for Papers (CfP) and program selection process. Get ready for all the nerdy details! A Thread 🧵➡️
Want to analyze real-world climate trends? 📈 @marcohening's latest article shows you how to programmatically access @NASA's POWER API in Python, collect data for global hotspots, and perform sanity checks with Pandas and @Matplotlib.
Linear algebra can be abstract, but it doesn’t have to be opaque! Artemij Lehmann's visual deep dive animates vector transformations and SVD using nothing more than @matplotlib and @numpy_team.
Inclusive data visualization isn't optional... it's essential. Dario Radečić's guide demonstrates how to transform your @Matplotlib charts into accessible visualizations through thoughtful design choices that work for everyone.
🚀 Exciting news! Albert Steppi is co-presenting with Matt Haberland at SciPy 2025! They're sharing insights from their work on SciPy's new probability distribution infrastructure, addressing the decades-old performance bottleneck of Python loops in vectorized operations.
If you're attending SciPy 2025, don't miss this session! Learn how the community tackled these long-standing issues. 📊 🔗www.scipy2025.scipy.org
An alternative perspective is to fall back to a Cartesian plot with size and standard deviation as the x/y dimensions. The ternary plot gets warped to it, with the pure classes at the bottom, starting with the tiny clay on the left to the large sand particles at the right.
Corner response of a two-story building to a quarry shot that occurred 700 ft NNW of the house. Movements on the 3D plot are exaggerated by a factor of 1e4 and time is slowed down 10x. Visualization by me using @matplotlib
My accidental #matplotlib art of spring comes with some Guayasamín vibes and the return of the bunnyman. This plot was generated by analysing the condition number of a set of 2x2 variable-in-time matrices controlled by the two parameters in the axes. #scientific#art#oopsie
🧠 Yesterday in my #machinelearning course, we dove into artificial neural networks. To make model training really click, I built a simple ANN from scratch — and we trained it together, step by step:
1. Initialize random weights & biases 2. Forward pass to compute the error 3. Backpropagate the error gradients 4. Update weights & biases 5. Repeat until convergence
📊 We used my custom #python@matplotlib dashboard to manually train the network — an awesome way to visualize and truly understand what’s happening under the hood.
In my geostatistics course, I teach spatial 🗺️ and temporal ⏳ analysis using interactive #python dashboards powered by @matplotlib—like this one! 📊🐍
Add some random noise to your spatial data and watch the variogram’s nugget effect grow! 🎯✨ It’s a fun, hands-on way to explore key geostatistical concepts.
I’m creating the educational resources I wish I had when I started learning #datascience! 💡📚
Random Forest creates diversity among decision trees by limiting the number of features considered at each split. To help illustrate this concept to my students, I visualize the first split for 6 trees within a Random Forest.
Training of a 2 → 100 → 2 → 5 fully connected ReLU neural net via cross-entropy minimisation. • it starts outputting small embeddings • around epoch 300 learns an identity function • takes 1700 epochs more to unwind the data manifold
🚀 Yesterday, I gave an exciting lecture on #spatialestimation 🌍, diving into both the theory 📚 and 3 interactive #python dashboards using @matplotlib! 🎨✨ I even stayed up late 🌙 to record it so you can access it anytime!
🎥 Join me and learn everything you need to know about Simple Kriging 🔍! Watch the full lecture on #youtube here: youtu.be/ZRyiBKvqjJM
💡 Plus, I've linked the interactive dashboards for you to play around with! 💻📊
What’s cooler than that? 🤔 How about short YouTube walkthroughs 🎥 to quickly refresh those fundamental concepts 🧠, followed by a fun, step-by-step tour of each interactive dashboard? 🏎️💨
I have an upcoming talk in which I'll be describing density based clustering. With the help of @matplotlib I was able to get a nice visual aid to some of the conceptual ideas of the process.
Hey folks, been wanting to contribute? Join us tomorrow ! Ask questions, talk about what you've been working on, it's a pretty informal 'all things contributing' catch up!
How to make: 1. Compute histogram 2. Use histogram bins as norm = BoundaryNorm(bins) bins 3. Plot choropleth (probably using @geopandas) with norm = norm 4. In an inset_axes, plot histogram as bar chart and color bars using cmap(norm(bin_edge[bar_index]))
Here's a cool, simple technique I learned from Joey @Cherdarchuk: in a choropleth map, your legend can double as a histogram - showing both the colour coding ánd the data distribution.
Today, I'm diving into advanced cluster analysis in my #machinelearning course! I'll be covering density-based clustering with DBSCAN and showcasing the process using my interactive #python dashboard built with @matplotlib.
So we wrote a script in the @Spyder_IDE environment, amped up with @matplotlib , reducing a post-flight download of a @GRTAvionics EFIS. This is Airspeed, Altitude & EGT data sampled at 1Hz; this was a sliver of the 39k-line csv file analyzed.
Hey folks! Wanna contribute to open source in #2025 but it's all feeling a bit overwhelming? Join us tomorrow at our new contributor meeting to learn what it's all about and ask all your questions! hackmd.io/@matplotlib/ncm0225
📣📣 As part of the Scientific Python Translations project, we are organizing a full-day sprint to answer questions and meet new volunteer contributors interested!
Not my best work but I like this because it made 2M views on Reddit and it incorporates a lot of feedback from r/dataisbeautiful (notoriously critical with viz)
For a list of domain specific wrapper libraries - they handle the semantically important stuff, use us to tweak the aesthetics - see matplotlib.org/thirdpartypackages/
🚀 2500 palettes available 👀 Instantly see how palette looks like on 7 charts ⌨️ R/Python code available ☑️ Test for color-blindness 🔎 Filter palettes easily
The correlation coefficient fully characterizes the relationship between two features only in the case of a bivariate Gaussian distribution, where it captures both the linear dependence and the strength of the relationship.
We “accidentally” created this animation while trying to debug the boundary conditions in our code. Contours show humidity in a stratified atmosphere. Images created with @matplotlib using a hacked tab20b colormap (repeated colormap three times) #artscience
A classic proof without words showing that 1+3+5+...+(2n-1)=n² taking advantage of the fact that 2025 is a square and therefore it's the sum of all odd numbers from 1 to 89!
As I reflect on my sabbatical, I’m proud to share that I’ve dedicated much of my time to developing a free, online e-book:
Applied Geostatistics in Python: A Hands-on Guide with GeostatsPy 📘💻.
Looking back, with 32 comprehensive chapters—each featuring theory, code, data, and fully documented workflows—I feel a deep sense of accomplishment ✨. This resource is not just a collection of technical content but a practical guide to mastering geostatistics in Python 🔍📊.
Leaving industry to join academia has been an incredible opportunity to give back 🎓, and I’m thrilled to see the positive feedback from those learning and applying #geostatistics 🙌. It’s been an exciting journey, and I can’t wait for more people to explore this content 🌍.
The gghalves package is a handy extension for ggplot2 that enables you to create half-geometries, such as half-violin plots, half-dot plots, and more. It allows you to compare two data sets side-by-side, using one plot instead of two, for clearer and more compact visualizations.
✔️ Efficient Data Comparison: gghalves makes it easy to compare two groups by displaying their data in a single, merged plot, saving space and reducing clutter. ✔️ Flexible Plotting Options: Supports various geometries, including half-violin and half-box plots, making it versatile for different kinds of visual comparisons. ✔️ Smooth Integration: Works seamlessly with ggplot2, allowing you to enhance your existing visualizations without major code changes.
Whether you’re analyzing experimental results, survey responses, or any other type of grouped data, gghalves helps to keep your visualizations clean and insightful. The example visualization shown here is taken from the package website: cran.r-project.org/web/packages/gghalves/vignettes/gghalv…
If you’re eager to improve your data visualization skills, consider joining my online course, Data Visualization in R Using ggplot2 & Friends. We’ll cover ggplot2 and its extensions, helping you create clearer, more effective visuals. Click this link for detailed information: statisticsglobe.com/online-course-data-visualization-ggpl…
@matplotlib is much more than just a data visualization library.
This is just ~100 lines of code, using numpy+matplotlib
If you want to learn how to create anything with Matplotlib, the first step is to check out our new project with @R_Graph_Gallery: matplotlib-journey.com.
The Central Limit Theorem (CLT) states that the sum or average of independent random variables with any distribution rapidly approaches a Gaussian distribution. This often happens faster than you'd expect!
🎉 Great news! Pylustrator, my open-source tool for creating publication-ready @matplotlib plots, works seamlessly with the latest Matplotlib version! 🖌️✨ Curious how it can transform your figures and save your changes as reproducible Python code? Let me show you! 🧵👇
Recently held a dataviz session for @theAGU, part of their annual data viz competition for students www.agu.org/honors/freilich. The viz were great, but they often lacked focus for an audience to quickly understand what was going on.
Many students have trouble understanding #bayesian#machinelearning, to help them I coded up Bayesian linear regression with MCMC to sample the posterior from scratch. Then I built out this interactive #python dashboard with @matplotlib.
If you ever wondered if learning @matplotlib is worth your while - check out this list of the tools that build on top of Matplotlib or extend its capability.
Translation: Learning it will most certainly pay big dividends as you dive into the wider Python ecosystem.
#bayesian updating is incredible! It's both powerful and intuitive. To help my students fully grasp and visualize this concept, I built an interactive #python dashboard using @matplotlib.
Students can adjust key variables, such as the prior (probability of the event), likelihood (probability of a positive test given the event is happening), and false positive rate, and see how these influence the posterior probability. The dashboard calculates:
Probability of the event happening given a positive test
and,
Probability of the event happening given a negative test Probability of the event not happening given a positive test Probability of the event not happening given a negative test
I just released ipydrop! 🎉 A drag-and-drop widget for Python notebooks — intended for tasks like dropping CSVs into a @marimo_io notebook and plotting them w. @matplotlib. Project: github.com/kolibril13/ipydrop
Chlorophyll-a concentration for September 2024. Data from the PACE (Plankton, Aerosol, Cloud, ocean Ecosystem) mission. Plot with @matplotlib & #cartopy.
🚀 Feature engineering for #machinelearning involves numerous essential techniques, including distribution transformations. One common source of confusion among my students is distinguishing between quantile-quantile (Q-Q) distribution transformation and normalization. 🤔
(Che poi nella sua essenza uno spirografo è semplice: la somma di due numeri complessi di moduli diversi il cui argomento varia linearmente nel tempo con velocità diverse.)
'ello folks! Interested in contributing? Want advice on opening or choosing an issue? Have a pull request that's stalled out🫤? Wanna check that your talk/poster/vid uses best practices? Curious or confused about this whole open source thing? Join tomorrow!
📚 16 chapters packed with well-documented #python workflows, open-source code, and datasets — with direct links to my YouTube lectures for deeper learning! This e-book blends theory with practical coding and effective visualizations to help you understand and apply #machinelearning concepts.
⚙️ Try the examples, explore the code, and follow along with hands-on exercises. It’s a living document, so I’ll continue adding new chapters and improving content over time.
I'm here to help you dive into #datascience and #ml — let’s learn together! I'm having an awesome sabbatical! Stoked!
I just wrote a prototype for a @xyflowdev based widget! This minimal example showcases a @matplotlib color picker within a @marimo_io python notebook. What kind of interactive flow diagram would you like to explore in Python? Drop your ideas in the comments!
To help my students comprehend artificial neural networks (ANN), including initialization, backpropagation, and updating, I built an ANN from scratch and developed a custom interactive #python dashboard using @matplotlib.
Now, when I teach these concepts, students engage in hands-on, experiential learning by interacting directly with the machine. It’s a fun and effective way to make complex topics more accessible!
As always, made with @matplotlib, but also with 2 python libs I've been working on (to draw arrows and work with fonts) and which I'll talk about soon.
Jupyter has a document timeline extension now! If you're using the Real Time Collaboration functionality you get a little widget that can show and restore document state from earlier points in time
Even the colorbar cannot contain its excitement about this cool animation of buoyant convection by our student @jacobjivanov! This was our CFD class term project last semester. Animation shows scaled temperature (top panel) and velocity magnitude+streamlines (bottom).
Interested in open source? Have a class where it's extra credit? Just want to learn a bit more 'bout how to fix bugs or implement a new feature or write some docs or share your knowledge about the project? Join us!
A continuous deformation between an ollie and a double kickflip. Made with @matplotlib.
I recently posted a big update to the topological flips library that can generate these videos, check it out if you're interested: github.com/holomorpheus/topological-flips
You’ve heard of kriging—the best, linear, unbiased estimator that also gives you the kriging variance, a measure of estimation uncertainty. But do you really understand how it behaves?
M7.1 #earthquake off the south east coast of Kyushu island in Japan at 07:42 (UTC). Landslides and liquefaction are predicted to be significant to extensive. A tsunami threat has been declared for the region, with people advised to move away from the coast.
I am excited to announce the release of the first edition of my e-book, "Applied Geostatistics in Python: A Hands-on Guide with GeostatsPy".
This e-book is designed to support students & professionals learning and applying geostatistics / #spatial#dataanalytics through numerous well-documented, demonstration workflows that help you understand theory and apply best-practice all in modern, flexible #python codes.
By expanding from my GitHub repositories to an e-book, I aim to reach a broader audience with a dynamic and evolving educational resource. This living document will continuously grow in response to your feedback and needs. Also, it is integrated with my online lectures, interactive dashboards, and workflows, all based on my #opensource Python package GeostatsPy and other common open-source packages.
The special thing about @marimo_io reactive notebooks: cells execute immediately when variables change. Here, you can see it in action with a @tldraw canvas being used as a @matplotlib color picker.
Thanks to the hard work of maintainers working over the weekend and a national holiday, fixed 3.9.1.post1 wheels are now on PyPI for folks who need the fixes in 3.9.1 pypi.org/project/matplotlib/3.9.1.post1/ We're still working on getting a 3.9.2 release out ASAP.
We've pulled the 3.9.1 release from PyPI and are very sorry for the disturbance this has caused. We had originally pulled the wheels to prevent segfaults. Thank you for your patience as we work on resolving this issue.
Hey folks, many apologies but our 3.9.1 windows wheels are very broken (seems like b/c of MSVC incompatibilities). Trying to get out 3.9.2 ASAP, please use 3.9.0 and below for now!
Hey folks! Wanna contribute docs, code, tests, ci 😭, social content - as an open source project we very much appreciate and rely on everyone's work to keep running. If you'd like to help, come join us tomorrow!
We've pulled the 3.9.1 release from PyPI and are very sorry for the disturbance this has caused. We had originally pulled the wheels to prevent segfaults. Thank you for your patience as we work on resolving this issue.
Hey folks, many apologies but our 3.9.1 windows wheels are very broken (seems like b/c of MSVC incompatibilities). Trying to get out 3.9.2 ASAP, please use 3.9.0 and below for now!
Hey folks, many apologies but our 3.9.1 windows wheels are very broken (seems like b/c of MSVC incompatibilities). Trying to get out 3.9.2 ASAP, please use 3.9.0 and below for now!
How does principal component analysis in #machinelearning accomplish dimensionality reduction?
Principal Component Analysis (PCA) transforms the original features into a new set of features (principal components) through a linear combination, specifically an orthogonal transformation. These new features are ordered such that the first principal component explains the most variance, the second explains the next most variance, and so on, with each component being orthogonal to the others.
To help my students visualize this process, I developed a #python@matplotlib dashboard, projecting the data onto an arbitrary orthogonal basis that is rotated interactively. Students (like PCA) find a configuration where the principal components maximize variance explained and a correlation of 0.0!
Check it out on my #github repository: GeostatsGuy/DataScienceInteractivePython File: Interactive_PCA_Rotation.ipynb ∀. #datascience
✍🏻 I've written more than 130.000 words in @obsdmd since March.
So I also wrote this little script github.com/QuentinWach/obsidian_ai to help me automatically tag and link my notes, delete empty ones, and show me a bunch of meta-data as well as plot this activity graph with @matplotlib.
Color version of "How do the complex roots of the polynomial in the title move when t₁ and t₂ vary on S₁ x S₁?" Made with #python, #matplotlib, #numpy and #sympy.
I coded this interactive #python@matplotlib dashboard to teach #bootstrap. For ultimate flexibility I added my own custom histogram plot function.
You can set the number of bootstrap realizations and the random number seed, then calculate data and mean realizations!
Bootstrap is an incredible tool and I'm completely stoked to support #technology evangelism through my work. My mission is accessible and actionable education for all! Let's get stoked about learning powerful #datascience!
20th of July is known for being the - International Chess Day ♟♟♟
I was travelling over the weekend so couldn't celebrate it in any way but I'm making the amendments now.
I've found at least 3 ways to make a chessboard using @matplotlib.
1️⃣ using stacked bars 2️⃣ using scatter plot (a bit more fiddly) 3️⃣ using a grid of subfigures (at first I thought this is going to be the easiest but it was the most manual of them all!)
Code attached.
I'd have forgotten:
Happy belated international chess day to all the chess players out there🎉🥳!
When I teach #montecarlo methods in my #machinelearning course, I start with the classic example of calculating the ratio of the areas of a circle inscribed in a square.
We use stochastic processes and random sampling to solve problems, demonstrating the power of randomness! Stoked!
One of my favorite features of hvPlot/HoloViews are the linked axes between plots in a layout. Zooming/panning around in one plot automatically syncs the view in the other plots.
Gather around friends, and let me share a powerful secret with you!
When you sample in space 'n' times, you don't always have 'n' independent samples. Often, there's spatial continuity/redundancy between your samples!
But you can calculate the effective number of independent samples using your data locations and a spatial continuity model. I've built an interactive #python@matplotlib dashboard to demonstrate this!
I love teaching #montecarlo methods & simulation to #engineering students because it expands their minds beyond the determinism typical of our discipline.
@matplotlib's contribution to science is actually huge. I see matplotlib plots everywhere. The good choice of defaults, the powerful yet approachable API, the open availability, enable better science and better communication.
Really nice figure from @HoloViz_org is our philosophy too - check out matplotlib.org/mpl-third-party/ for a list of some of the higher level libraries you can customize w/ us.
Begin with a simple ANN and progress through training epochs, including forward pass, error calculation, backpropagation, and updating weights and biases!
There's (almost) nothing better on this earth than polishing a fancy matplotlib figure while listening to nice music and having a good (Belgian) beer or cappuccino.
Can't share the current one yet, so here are some past ones that I like, just because. (arxiv links in alt-text.)
So, kudos to @sirmarcel for his first preprint as a 🧑🚀. Now we would really like to hear what the community thinks: bring the pitchforks, burn us at the stake, or give us @matplotlib advice of how to make two overlapping curves visible! arxiv.org/html/2406.17747v1
When I teach predictive #machinelearning, I include k-nearest neighbors regression.
I demonstrate the impact of the choice of weighting function. While uniform weighting works well for dense data, it can cause unrealistic discontinuities in the prediction model when dealing with sparse data or outliers.
Hey ya folks! Wanna start or come back to contributing? Feeling a little overwhelmed at how things work? Have a stalled out PR you want to get moving? Join us tomorrow for our new contributors meeting where we chat about all things contributing! hackmd.io/@matplotlib/ncm0624
One more time on Principal Component Analysis (PCA): Recently, a student asked, "What do principal component loadings look like and can we interpret them?".
To help that student, I wrote this #python@matplotlib dashboard. Vary the strength of the correlation between features 1, 2 & 3 and watch PCA learn!
- first principal component is a combination of features 1, 2 & 3, describing about 2.7 variance of 4.0 total variance at max. correlation.
- second principal component describes all the 1.0 variance in uncorrelated feature 4
- third and fourth principal components capture the remaining variance, mostly noise
- total variance is preserved, sum principal component variance is 4.0
- without correlation, all principal components equally share the 4.0 total variance.
Since the 1950s, global plastic production has only increased and is expected to reach 1 billion tonnes per year by 2050 if we continue on the same path.
This is @tldraw in a notebook, connected to the new GPT-4o vision API. This video is at original speed, and it shows how @matplotlib plots are generated from scribbles.
I am reading an image using the @OpenCVUniverse cv2.imread() function as a grayscale image. But when I display the image using @matplotlib 's plt.imshow() function, the blacks become white and vice versa. What am I missing? The following images show the code blocks I'm using.
Hi Twitter, is there any way to display @matplotlib plots directly in iPython please? I use @Neovim and @quarto_pub to code and send the code to ipython. My terminal is iterm2.
This custom @matplotlib plot shows so called sporadic meteors and their direction of origin. The coordinate system is "co-rotating" with Earth w.r.t. the Sun. The center is Earth's Apex: Earth's "flight direction". As you can see, a lot of fast (red color) meteors come from ...
hey @xarray_dev, is there a built in way to make bivariate maps (e.g. elevation and temperature together on one map)? Am I missing smth? 🧐 or do I have to go to @matplotlib itself for it?
Retweeting this image is not intended as an endorsement of the Russian annexation of Crimea. Unfortunately data collection in, and maps of, active conflict zones may not accurately reflect international consensus on borders.
Slightly concerned that there aren't any reports of us breaking things 😶 Fixing things in release clients is much easier than in the full release, so giving it a try is a ton of help!
Hey folks, we've recently published the second v3.9 release client 🥳 Lots of nice new features and additions, so please give it a test run & let us know what got broken 🫣 github.com/matplotlib/matplotlib/releases/tag/v3.9.0rc2
Slightly concerned that there aren't any reports of us breaking things 😶 Fixing things in release clients is much easier than in the full release, so giving it a try is a ton of help!
Hey folks, we've recently published the second v3.9 release client 🥳 Lots of nice new features and additions, so please give it a test run & let us know what got broken 🫣 github.com/matplotlib/matplotlib/releases/tag/v3.9.0rc2
Hey folks, we've recently published the second v3.9 release client 🥳 Lots of nice new features and additions, so please give it a test run & let us know what got broken 🫣 github.com/matplotlib/matplotlib/releases/tag/v3.9.0rc2
Fractals generated using the chaos game of the iterated function system defined by the Möbius transformations below. Made with #python, #matplotlib and #numpy.
This week I went to the Opta forum. It was amazing and a bit scary how many people are using mplsoccer at clubs. One analyst asked how I designed it so a quick thread. 1/
We're happy to announce the release of #pandas 2.2.2. You can install it with `pip install pandas` or `mamba install -c conda-forge pandas`. Thanks to all contributors and sponsors who made this release possible! The release notes can be found at: pandas.pydata.org/docs/whatsnew/v2.2.2.html
Have you used MetPy? We'd love for you to take our 2024 User Survey. It should only take 5-10 minutes and is really important: results are used in our reports to NSF and guide our overall roadmap. Feel free to share with others who might miss it. forms.gle/eR68VPHi9QCSS8qz8
Wanna contribute but feeling a bit lost on where to start? Have a PR you want feedback on? Side project you wanna share? Join us tomorrow for our monthly new contributor meeting!
In our latest work now available at ui.adsabs.harvard.edu/abs/2024arXiv240309931J/abstract we look into the radiative connection between solar prominences and their underlying chromosphere. Tl;dr: Prominence albedo is non-negligible, altering the chromospheric /and/ prominence Ne and emergent intensity. 🌞
To support my students and anyone interested, I built out this interactive #python dashboard with @matplotlib. Change the search parameters and watch the experimental variogram change!
It doesn't take much to get from default to good looking plot in @matplotlib.
I think improving those 3 things makes a massive difference: 1) Use modern fonts from Sans Serif family (e.g. Roboto, Open Sans, Lato) 2) Use well defined colour palette (e.g. GNOME) 3) Remove unnecessary spines
Hi ya folks, do our regular US centric times not work for you? Come join our new contributor meeting tomorrow if you're interested in contributing - community, code, docs, all the things! Experienced folks are also welcome - if you want to chat about contributing, stop by!
I built out an interactive #python@matplotlib dashboard with one of my undergraduate summer research students to help anyone learning PCA (principal component analysis) for #inferential#machinelearning.
Watch a single datum go from original features, standardized features, principal component scores, dimensionality reduced, and reverse projected back to original features again!
Sure, the image is not from me but this is exactly what I am trying to replicate. Separate legend entries into categories with a title for each category.
First time creating an area chart going from right to left. 👀 Used random values along the y-axis to closer imitate the original and added a background image.
Even better trick is when you add accents to the parts of the subtitle, e.g. change the colour of some words.
This requires changing the strategy: ▪ Use `ax.text()` instead of `ax.set_title()` ▪ Then use `ax.annotate()` to append more text to the original text object. The appended text can have changed properties.
Have you ever done a dense grid search over neural network hyperparameters? Like a *really dense* grid search? It looks like this (!!). Blueish colors correspond to hyperparameters for which training converges, redish colors to hyperparameters for which training diverges.
I was just reminded I spent far too long figuring out how to represent Indian states as @matplotlib subplots for an upcoming paper on modelling energy demand. This went through many horrible iterations! Final version (left) vs first version (right).
Hey folks, interested in contributing but it all feels a bit overwhelming? Working on some cool stuff and wanna let us know about it? Join us tomorrow (Tuesday) for our monthly new contributors meeting for a chat! hackmd.io/@matplotlib/ncm0224
In the example above, we query Cole palmer's current statistics versus other FWs in the league. The response will return a pizza plot of the players statistics as shown below. @matplotlib@mplsoccer_dev was used to plot the pizza chart and fbref for the data. inspo @mckayjohns
Hey folks, interested in contributing but it all feels a bit overwhelming? Working on some cool stuff and wanna let us know about it? Join us tomorrow (Tuesday) for our monthly new contributors meeting for a chat! hackmd.io/@matplotlib/ncm0224
#duboischallenge2024 1: is a choropleth map with a alternating left-right pattern, comparing the population of Black Georgians in the years 1870 and 1890. Note the decrease of lightly populated areas, with the heavily populated areas in red shifting west.
For challenge 1... ICYI (& lazy like me😅), I have a shapefile of Georgia's counties in 1880, which seems to join nicely w/ the data. The boundaries are a bit different though (vs. Du Bois' maps)...
#duboischallenge2024 1: is a choropleth map with a alternating left-right pattern, comparing the population of Black Georgians in the years 1870 and 1890. Note the decrease of lightly populated areas, with the heavily populated areas in red shifting west.
From our 2023 State of the #dataviz Industry survey: Over 1 in 3 respondents identified that they speak languages besides English, and respondents collectively listed over 50 distinct languages. Read the full report here: datavisualizationsociety.org/state-of-the-data-viz-industry/
I'm returning to the @DataVizSociety board as the Publications Director! If you have ideas for or want to help with developing content that enlightens and engages data visualization professionals, please reach out to me.
We’re excited to announce The Pudding’s 2024 Cohort, a 10-week summer fellowship for aspiring visual storytellers. 🧑🎓 Open to college/graduate-level students and recent grads 📅 June 18 – Sept 1 💰 $7,200 stipend 📝 More details at this link! pudding.cool/career/cohort/
Somehow I ended up creating a visual that showcases the principles of electric charge interactions. Animation display how a moving charge interacts as it passes through fixed positive and negative charge. Coulomb's Law is used to calculate the electric fields. #python#matplotlib
Painted skies! 🎨🖌️🔭 A spectacular sunset turns the clouds above @CerroTololo a deep red color. Cerro Tololo, located in Chile, is a Program of @NOIRLabastro and is home to the iconic Víctor M. Blanco 4-meter Telescope. Credit: Babak Tafreshi/NOIRLab/AURA/NSF
January is nearly over and this is only the 3rd consecutive @matplotlib tip I'm posting in 2024
Let's have a look at bar charts again
A special use case when you plot them using date as x-values
They might come across weird if your date frequency is eg. weekly, monthly or yearly
It's because the default width of a `DateTime` bar is ~1 day
Therefore, if you need to plot e.g. monthly data, you need to adjust accordingly e.g. to 20 or 25 days
This might feel odd at first if all you've ever done was plotting numeric values and having the bar width between 0 and 1 - but that's the way to do it 😉
Multiplicative independent noise leads to a long-tailed lognormal distribution. In this case a simulation of cell density in many little tissue samples with multiplicative Gaussian noise 🦠🧫🔬
I demonstrate #bootstrap (from #datascience) in class with my big cowboy hat, and colored blocks. Sampling with replacement to simulate data collection and to pool realizations of the statistic of interest!
Here's my #python#dashboard with @matplotlib, add bootstrap realizations and observe the uncertainty in the proportions!
A fairly simple question with somewhat tangled answer.
Let's unravel it.
@matplotlib offers a number of methods for plotting lines spanning across the whole Axes. This is handy if you want to plot e.g.: ▪ a reference point ▪ a limit ▪ an aggregated value such as mean or median
You will have specific methods for drawing: ▪ horizontal lines ▪ vertical lines ▪ angle lines and even rectangular patch.
Those method accept relative limit values meaning they will take anything between 0 and 1.
Homework: can use the methods to draw the United Kingdom flag 🇬🇧?
Python art community has been a recent inspiration. Here is my first attempted python math art by iterating through Julia set's theta value and plotting with @matplotlib. Math is beautiful and strange.
💫 The Tracy-Widom law describes, among other things, the fluctuations of maximal eigenvalues of many random large matrix models. Today’s bonus animation illustrates this convergence ✨
▶ And last but not least - `.subplot_mosaic()` is now stable and supports subplot_kw for all your 3D/polar/geographic needs. Take it and use it till your heart's content🥳!
Introducing MakeReal in jupyter-tldraw ✨ Now you can hand-draw a plot on a @tldraw whiteboard and turn it into @matplotlib code directly in a notebook.
UofG Institute for Gravitational Research@UofGravity
We're very excited to see this paper published! Catalogue papers are a whole-collaboration effort, but IGR members played a major part in putting this one together, including @cplberry who lead the paper team and @daniel_williams who ran much of the parameter estimation analysis.
Everyone's got an evergreen list of things to learn.
Once the item ends of the list, the probability of it getting out is inversely propositional to the number of years spent on the list.
But miracles happen. Rarely, but still.
My list looks more of less like this (in no particular order): - regular expressions - ML - Turtle - review of linear algebra and programming associated with it - matplotlib animations
Like I said, prisoners sometimes escape the prison.
Ladies and Gentlemen, let me present you with my first ever @matplotlib animation.
The code for it is pure atrocity and violation of any coding standards and practices. I'm ashamed of it and therefore still on the fence whether to publish it. But it works (silver lining) and that's a good start.
Many approaches exist to visualize the time dimension of a time series, but the best way to grasp time might just be by watching it unfold! Below is a plot visualizing ERCOT's energy transition over the last few summers. #ercot#netload#solar
I was recently admiring @S_Conradi outstanding math plots (to be honest, this is a fairly frequent occurrence for me <end of off-topic>).
One thing leads to another and before I know I'm goggling his Github. And then I noticed this peculiar way of setting the visibility of spines (see Way #1.5 below). I didn't know it's possible as I was always using `for` loop (Way #1 below)!
The methods are effectively the same thing, but I didn't know you can access spines by using list of names (plural). I like the Way #1.5 more as it's more concise.
I've checked the doc and you can also access individual spines using dot: `.<name>`. That's Way #2 which I also included in the tip for completeness.
Hey folks! Wanna contribute, or ambivalent but curious? Our new contributor meeting is for you! Ask all the questions, provide all the feedback - goal is to help you navigate contributing!
Hey folks! Wanna contribute, or ambivalent but curious? Our new contributor meeting is for you! Ask all the questions, provide all the feedback - goal is to help you navigate contributing!
As Pawel (@pawjast) pointed out in our conversation about @matplotlib's `subplot_mosaic()`, a key difference when shifting from using `subplots()` to the newer function is that `subplot_mosaic()` returns a dictionary with the axes, not a list:
You can see an example of creating interesting subplot configurations using `subplot_mosaic()` in the article. Here's one:
This figure has one large central(-ish) image and six smaller images showing the red, green, and blue channels and the histograms for these channels.
There's also a blank slot in the mosaic. Can you spot it?
The relatively new `subplot_mosaic()` in Matplotlib makes this easier to create.
Here's the code to generate this plot:
You can get the full code, and access to the image used, in the article:
To close off this year's map challenge, I decided not to pick the top 12 most livable cities showing their road network based on OpenStreetMap via the OSMNx and @matplotlib
▪ Romus and Remulus: fonders of Rome ▪ Mario and Luigi: defeaters of Bowser and saviours of Princess Peach ▪ `plt.getp()` and `plt.setp()`: a pair that gets the job done in @matplotlib
اضاءة فنية💡 تم عمل هذا الرسم بمكتبة @matplotlib وشخصيا احب هذه المكتبة لأمكانياتها الكبيرة وسهولة الرسم فيها. لكن عيبها القاتل هو عدم دعم اللغة العربية بشكل مباشر (الاحرف تيجي معكوسة 😵💫)
في التغريدة السابقة شرحت كيفية الكتابة بالعربي مع matplotlib:
I came across it not so long time ago and was surprised by the fact of its existence. After all we already have `ax.twinx()` so what's that about?
It turns out `ax.secondary_xaxis()` does a slightly different job. It allows you to create another axis for the same data, but with a different unit. So you can have e.g.: ▪ seconds and hertz ▪ minutes and hours ▪ degrees and radians
In order for this function to work, you need to provide a pair of functions that make the conversion between the units. These can be: ▪ user defined functions ▪ lambdas
Naturally, there's an equivalent function for the Y-axis.
I think it's an interesting addition to the toolset.
TIL if you want to add someone as a co-author in commit/merger notes and don't know their associated commit e-mail you can put username@users.noreply.github.com 📖 thanks @coyotte508
During its first #venus#flyby, #parkersolarprobe interplanetary speed (purple) dropped ~ 2.3 km/s, sending it into a less energetic heliocentric orbit. The black dot is the probe, encountering Venus (orange) and its sphere of gravitational influence. @matplotlib rocks!🤟🏼
In a previous post, we explored how wavy lines claimed to be random functions drawn from a Gaussian process can be described as the sum of multiple sinusoidal waves. But how exactly is this useful for predictive modeling?
🎉 Tool for better documentation!! New release of sphinx-gallery, used to automatically integrate tightly narrative 🐍 examples in documentations sphinx-gallery.github.io/stable/index.html
Highlight: an optional light recommender system that shows related examples 🧵 1/3
intracranial EEG data from the human brain features extremely rich dynamics. this is a scan through frequency space to find pronounced oscillations in different regions. 〰️🙂〰️ some of these rhythms are quite hard to see with non-invasive recording modalities!
I’ve just applied your code (with minor changes) to produce a compact illustration of the proximity graphs of Italian municipalities, provinces and regions for a project I’m currently working on. Thank you very much Brennan!
The Pangeo Showcase talks are taking a break this week, but if you have something interesting to share or just want to hang out with fellow Pangeans, please stop by the Community Meeting, Wed, Nov 22, 4pm EST: pangeo.io/meeting-notes.html
When I taught principal component analysis (#pca) for #machinelearning-based #dimensionality reduction a bunch of students asked, 'What do the component loadings look like?'.
So, I coded up an interactive #python@matplotlib#dashboard! Vary the strength of the correlation and watch the loadings & variance explained change! Super cool!
#monaco Mike James performing on a high level in #euroleague this season. Rankings in a radar chart + shooting in a shot chart. Radar chart inspiration by statsbomb, python support by @mplsoccer_dev
Forest area per country. 🌳🌲Was surprised to see such a low number in Iceland, apparently it was 40% before the Vikings arrived 😯More here www.iceland.org/geography/forest/
`ax.tick_params()` is @matplotlib's common method you can use to tweak the appearance of the ticks and gridlines.
It's very flexible - you'll use it to update: ▪ only x-axis, only y-axis or both ▪ only minor ticks, only major ticks or both ▪ colour, size and the location of the ticks
And some more.
One popular example of using this method is: ➡updating colours
You can assign colours: ▪ individually to ticks, tick labels and grids
or:
▪ use `colors` parameter to set the same colour to ticks and labels
(small) pet peeve It seems like a missed opportunity to use `colors` parameter to set the same colour to ticks, labels AND grid lines.
(medium) pet peeve `labelcolor` but `grid_color`? A better consistency would be appreciated.
Has anyone ever made an art collection on @matplotlib messed up plots, or is it just me that sees some art in the unexpected beauty resulting from my mistakes?😂
This is one of the maps that will feature in my upcoming book with @locatepress. It shows the roads of France scaled according to their distance from Paris. You can accomplish this using just @geopandas and @matplotlib.
Like when you work with twin Axes in @matplotlib and create a legend.
FYI, this post is a quick "How to" on merging legends.
Sometimes you will want the legends to be separated (the default behaviour). Other times it makes sense to have one legend that encompasses all the data. Also perfectly fine.
In order to have all of the items listed in one legend you need to: 1️⃣ Save all the artists making up the plots (bars, lines, etc.) in variables 2️⃣ Then gather all of those artists in one place e.g. a `list` 3️⃣ Lastly, you need to pass the `list` to the `.legend()` method (you can choose which `Axes` you want to plot the legend on)
Bonus tip If you've done a due diligence and labelled the plots at the time of creating them (using `label=` parameter), now getting those labels shown in the legend is as easy as calling `.get_label()` method on every artist.
Hey folks! Tomorrow's our new contributor meeting, where we try to demystify the sometimes 😵💫 that is contributing! Pop in for a bit or stay the while, we'd be glad to have you and hear all about what you do w/ Matplotib & how you'd like to contribute! hackmd.io/@matplotlib/ncm1123
The scale of the fires currently burning across northern Australia is pretty unfathomable.
This animation visualises just the last two months of fire captured by #deahotspots - for context, the map covers an area larger than France, Spain and Germany combined...
Still trying to figure out how to say something with your data visualizations? Check out my thought process and my @matplotlib tips and tricks in my latest blog post:
#simulation from a Bessel Processes with dimension 4.5 showing:
🛣️250 simulated paths 🎯Expectation of the marginal distributions ✉️Probability envelope 📊Histogram of the final distribution X_T with probability density function and expectation
GM frens. Artists commonly use p5.js to create generative art. For Useless, however, I used Matplotlib @matplotlib , a plotting library for Python, because it is the main tool that I use for plotting for my daily quantitative research.
Therefore, by creating art with Matplotlib, I wanted to further explore the uncharted territory and see how data can be a medium of art.
Have you ever wondered what's happening in animations like these, where Gaussian process (GP) samples smoothly transition in response to changes in the hyperparameter (i.e., kernel lengthscale and amplitude) space?
I just used #python + @matplotlib (in a @GoogleColab notebook) to analyse two different health insurance options to see which worked out to be the better deal.
Result: Cheaper plan is cheaper, unless we incur a lot of expenses, and then expensive plan is *slightly* cheaper.
We'll be at sprints tomorrow! We've got no-code & low-code gallery tagging & various levels of anything in our issue tracker coding 😁 Sprint tickets are free, get yours today if you're in NYC!
This is probably the busiest @matplotlib tip I've shared to date.
But it's quite important and useful. It's time we talked about rcParams.
Let's be honest. Matplotlib is not in the business of making you plot pretty from the get go.
Matplotlib is in the business of providing you a tool to make any imaginable data visualization possible. So, once you've designed you cosmic plot, it's still on you to look after the aesthetic side of things.
Now, if you haven't heard of rcParams before - it's a place where all the visual aspects of you plot are saved. It's a long list of parameters with the default values for how the plots are supposed to look like.
And the good news is: - There are few convenient ways to modify rcParams.
You can: ▪ Way 1: modify parameters on a one-by-one basis ▪ Way 2: use `.update()` method to change all parameters in one go ▪ Way 3: use context manager to update the look locally
You can even create your own style, save it to a file and import it into your code before plotting - but that's a topic for another post.
Once you've plotted all there was to plot in your new shiny way and for whatever the reason want to get back to the default style, just run this command at the end: ▪ `rcdefaults()`
Now the big question: - Why would I want to tweak rcParams?
It makes sense to tweak those parameters if you: - have got many different visualizations to prepare - and care for a consistent look (e.g. in reporting or in case of creating a personal branding)
You've probably encountered these mesmerizing wiggly curves before, claimed to represent random functions drawn from a Gaussian process. But what exactly is going on behind these mysterious squiggles? 🔍
Half of the world is already past their peak in fossil power consumption. We are making progress and moving into the right direction. Do not despair and keep innovating and moving forward. Source: ember-climate.org/insights/research/half-of-the-world-has…
3/7 Mas ainda assim isso pode ser consertado se a paleta de cores, além de mudar o tom de cor, mudar a saturação e luminosidade junto. No @matplotlib do Python a paleta Spectral faz um trabalho parecido com a escolhida, porém navegando também pela saturação e luminosidade para +
Check out this #diy-axis! "Data Embroidery with Black-and-White Textures" by @tingying_he@dr_pi & Tobias Isenberg was voted Most Likely to be on Etsy Tomorrow.
Get in on the ground floor of this new vis fashion trend by attending the talk at 14:34 on Monday in Rm 110
🗺️ Analyzing road density is key for urban planning and development. This map, created with #geopandas and #matplotlib, sheds light on connectivity and accessibility in Nigeria. Let's build a more connected future! 🌍 #gis#dataviz#python
Simulation of a stochastic model for dielectric breakdown (Ref: Fractal Dimension of Dielectric Breakdown L. Niemeyer, L. Pietronero, and H. J. Wiesmann Phys. Rev. Lett. 52, 1033) Made with #python, #numpy and #matplotlib
Just discovered the third-party packages for @matplotlib! I've been using seaborn for a while, but found some additional great colormaps for my thesis.
Some examples of the submissions of the students for Lab 6, Quiz 4, and HW 3.
First photo: a side-by-side comparison of the orientation of the robot arm's tool frame from the calculation, visualization by matplotlib library of Python, and verifying with the physical robot.
How nice, #matplotlib runs inside a #jupyternotebook, inside #vscode, running from a vs-code server, connected via a ssh tunnel to an adroid mobile browser
That's a lot of open source efforts coming together
In some cases linear regression is too complicated!
My students were interested in how regularization changes the loss function, I so I made this #python interactive dashboard with @matplotlib! Change lambda & watch the model go from OLS to global mean (all slopes = 0.0)!
My immediate thoughts: 1️⃣ This looks pretty cool❗ 2️⃣ Can I do it in @matplotlib❓
So I went on to conduct my own experiment.
Matplotlib offers the following function: ▪ ax.stackplot()
It's a convenient method for plotting stacked area chart, but unless I've missed something - it doesn't allow to specify multiple hatching patterns (e.g. as a list) for the individual data series.
But, as the Americans say: ~ No biggie!
Plotting individual data series with ▪ `ax.fill_between()` and ▪ `for` look
works just as fine.
Black and white version
Colour version
I'd say the result is quite satisfactory.
Final thought One cool thing that Stefan did and I couldn't replicate in matplotlib was dashed hatching.
Using `-` will simply create a horizontal line.
I think dashed hatching looks amazing an perhaps would be a good addition to the library.
This is another @matplotlib tip and it goes like this.
There are two Axes methods which are seemingly similar. But not quite. These are: ▪ ax.set_axis_off() ▪ ax.set_frame_on()
Exhibit 1 demonstrates the difference.
1️⃣ ax.set_axis_off() It clears everything from the figure and all that's left is the data that you've plotted.
Tip: this is handy eg. when you want to use matplotlib to display image with ax.imshow() and don't need any distraction.
2️⃣ ax.set_frame_on() It removes/hides the background of the Axes. The background is a rectangle with its borders (spines). In most cases the face colour of the Figure and of the Axes stays at a default value (which is white). Therefore, if it wasn't for the spines, you wouldn't even notice this method does anything. But it does!
❗ Pet Peeve A keen eye must have noticed that: ▪ ax.set_axis_off() has an inverse method called ax.set_axis_on() ▪ ax.set_frame_on(bool) gets controlled by the bool so you pass either True or False as a parameter
New post on Multiple Views, just in time for @ieeevis!
@nicolaskruchten presents an eval framework for vis notation (eg, declarative grammars, DSLs, other toolkits). The metrics complement qualitative methods like Cognitive Dimensions of Notation medium.com/@nicolaskruchten/6c03b9292780
Hey folks? Are you African, interested in getting more involved in open source, and looking for some guidance? Check out this new program from @github:
If you’ve ever wanted to learn about open source in a structured curriculum with guidance, mentoring and opportunities; this program is for you.
I’m ecstatic about this program and I was privileged to design it. And over the course of this program I will be working with amazing folks @ukdevv@iamkingsleey@Preshh0 to run this.
I taught principal components analysis, PCA, in my #machinelearning course yesterday. Some students were curious about the component loadings!
Last night I coded this interactive PCA demonstration with @matplotlib. Change the data and watch the variance explained and loadings change for each principal component! Stoked!
1️⃣ The context ▪ This is the main plot showing your data in its full range ▪ The easiest way to create a plot (figure and ax) is to use plt.subplots() function
2️⃣ The highlight region ▪ That's the bit of the context that you want to zoom in on ▪ Use Rectangle or Polygon object (from patches module) to create the highlight region ▪ Use ax.add_patch() to place the highlighted region in the axis
3️⃣ The detail ▪ It's a smaller plot showing zoomed in data ▪ Create a list/tuple that contains 4 float numbers e.g.: rect = 0.08, 0.16, 0.4, 0.4 # x, y, width, heigh ▪ Add the new (inset axis) to the figure using: ax1 = fig.add_axes(rect)
This is why we ask that you give informative titles, fill out our template, & link to related issues and PRs. It makes it much much easier for a maintainer to review your code.
A low-effort but high-impact thing you can do in documentation, emails, PRs, etc, is to add a sentence at the top that is just "context," giving the context of the code you're working with links to the project, whatever. Not everyone coming into the doc knows what it's about.
Hey folks, we're participating this year! If you're interested in contributing, we've got a new contributor's meeting this Tuesday, Oct 3rd, 5:00PM UTC hackmd.io/@matplotlib/BkIsl94xa And if you can't make it (or even if you can) check out our contributing guide: matplotlib.org/devdocs/devel/index.html
Registration for Hacktoberfest 2023 is now live! Link your GitHub or GitLab account and get your profile ready to go to track your pull/merge requests on October 1st. hacktoberfest.com/auth/
Central limit theorem... often stated, but do we understand it?
I made a #python@matplotlib dashboard to perform averaging over 'n' random variables. Choose any input distribution and watch the output approach the Gaussian distribution!
Hey folks, we're participating this year! If you're interested in contributing, we've got a new contributor's meeting this Tuesday, Oct 3rd, 5:00PM UTC hackmd.io/@matplotlib/BkIsl94xa And if you can't make it (or even if you can) check out our contributing guide: matplotlib.org/devdocs/devel/index.html
Registration for Hacktoberfest 2023 is now live! Link your GitHub or GitLab account and get your profile ready to go to track your pull/merge requests on October 1st. hacktoberfest.com/auth/
Ok last one! Now a bit smoother (thanks for some frame interpolation and @matplotlib tweaks) with rank 7 matrix. Still impressed on how easy it was to speed this thing up with JAX without losing the intuitive @numpy_team syntax! Highly recommended!
I've spent a lot of time making scientific figures in @matplotlib. On my blog, I've put together my take on best practices to get you from your data to a publishable figure: shorturl.at/psvzM. This is the demo figure I created. Please share with whoever may find it useful!
The paper covers everything you need to know about PyMC, from its inception and key features to its real-world applications in #finance, #healthcare, and #environmental science
Inspired by the wonderful "Computational Discovery on Jupyter" by By Neil J. Calkin, Eunice Y.S. Chan, and @corless_rob and the gallery of www.bohemianmatrices.com. Each plot represents eigenvalues of the corresponding matrix. Made with #python, @matplotlib and @numpy_team .
I'm half way through this workshop from @PythonMaps . It's really good and it mentions cartopy too. I didn't realize there's so many options to choose from in terms of plotting maps!
We generally aim for the API to not hold an opinion on aesthetic choices b/c that varies by domain, but highly recommend learning your field's best practices
Simulation of the second law of thermodynamics. Inspired to "A statistical approach to the second law of thermodynamics using a computer simulation" Bellomonte, Sperandeo-Mineo - Eur. J. Phys. 18 321 DOI 10.1088/0143-0807/18/5/00
Live capturing a waveform from @Siglent_Tech#sds1202x-E oscilloscope, performing #fft and calculating #thd. Makes it much easier to tune receiver and stereo decoder. All done in #python and @matplotlib.
An easy way to visually check if the data distribution is skewed and has a long tail is to plot the histogram. In Python this can be done easily using @matplotlib or seaborn. #mlzoomcamp
If you like R-style bar chart but all you know is Python & @matplotlib - things are possible 😊.
The key tweak to achieve this look is to move the spines away from the axis canvas using the following method: ▪ ax.spines[position].set_position(("outward", offset_number))
The remaining tweaks include: ▪ removing spines ▪ making y-axis ticks a bit longer
And that's it. Super easy❗
And here's a version for when you printer is temporarily out of ink: ▪ x-axis ticks are a nice touch if you decide to bring them back
Still think @matplotlib can't do ANYTHING with your visualizations? Then you'll want to check out my latest blogpost where I re-created a some data-viz I found on r/dataisbeautiful
I use Matplotlib @matplotlib to create art. It's a visualization tool in Python. Not a matter of preference but it's a tool that I use everyday for my quantitative research so I thought why not use this to create art? Turns out, it sufficiently created aesthetically pleasing art
- So what else can I use @matplotlib for? - you ask.
OK, no one asked but I'll tell you anyway.
- Use case number 473: recreating music album covers.
And before you say anything, keep in mind it was a short plotting exercise.
Though it bugs me I couldn't figure out more accurate formula to create letters A and M in the middle of the wave (as they are in the original cover) - any suggestions?
Since I had fun working on this, I'm certain I'll do more re-creations soon.
What album do you think has got programmatically re-creatable cover?
And then you come across a feature that is simple and obvious and handy and deep down you had an inkling it's possible but never cared or felt a need to explore.
That's how I feel about @matplotlib's interactive plots.
I knew you could activate interactive plots, I didn't know it's this simple!
Large codebase, older than some of our contributors, so there are corners not yet on our documented standards, and cleanup can't really be automated. This kinda work can be done in batches and can be a good way to learn a corner of the library...
Sometimes the least shiny tasks are some of the most impactful... like on @matplotlib manually going through the .rst files and getting all the heading formats to conform to matplotlib.org/devdocs/devel/document.html would make editing much easier
Very nice. It's not up there (yet) but take a look at our third party list for some more theming packages and add your own! matplotlib.org/mpl-third-party/
I made a little convenience package for more elegant plots in Python. 'opinionated' is now on PyPi and GitHub (github.com/MNoichl/opinionated). It should be easy to use and provides typographically appealing plots in just three extra lines of code.
Matplotlib is eager to add padding when labels etc are outside the figure, often convenient but it bites you here. You can flip the issue from stretching your title-ax to full width to instead adding some margin next to your plot-ax. The funky colors are just for illustration 😜.
After 3 weeks of work, finally I got the first version of #wisemeeple an AI based boardgame recommender So happy and ready to improve details for the first release :)
Could any @matplotlib experts tell me how to get an axis completely flush against figure edges? So the space with the red squiggly lines doesn't exist at all?
Step into the spotlight by following users or teams. Get real-time notifications of new notes or hot discussions from the people you follow. hackmd.io/@matplotlib @matplotlib
@NASAWebb and @ESA_Euclid dancing around Sun-Earth L2 lagrangian point, plotted with @matplotlib. This video spans 2 years of operations from Aug2023 to Aug2025. Euclid is on a "simple" Lissajous orbit, Webb on a Halo orbit, a periodic and cyclic family of Lissajous orbits.
Hey folks! Do you have fixes and features you'd like to make? But not quite sure how to go about it? Join us tomorrow to learn how! Your questions are much appreciated 🥰 hackmd.io/@matplotlib/ncm2023
Day 3 of my geospatial journey with #siklós, famous for its castle and also the nearby wine region, the town of 10k, where I have the most important family ties.
We're happy to announce the release of #pandas 2.1.0. You can install it with `pip install pandas` or `mamba install -c conda-forge pandas`. You can find what's new in this version in the release notes. Thanks to all contributors and sponsors who made this release possible!
The color maps are indeed super nice. I've build a small port of the color maps to be used in matplotlib. Feel free to use it: pypi.org/project/farrow-and-ball/0.0.1/
farrowandball: ggplot color palettes inspired by British paint manufacturer Farrow & Ball. Really nice --- I wish it was in @matplotlib! github.com/km4htc/farrowandball
farrowandball: ggplot color palettes inspired by British paint manufacturer Farrow & Ball. Really nice --- I wish it was in @matplotlib! github.com/km4htc/farrowandball
If you don't need to fine tune every parameter in your plot (font size, tick length, etc.), you can take advantage of the following convenience method:
I built out an interactive #python dashboard with @matplotlib to teach #machinelearning model parameter training with an heuristic for the case of k-means clustering.
We have built a new visualization lib in Python: PyGWalker, which can turn your dataframe into a tableau-style UI with one line of code. (There is also a R's version: GWalkR) github.com/Kanaries/pygwalker
I've worked with @matplotlib enough now to be well aware of its flexibility. But I'm always in for a nice surprise.
Recently I've spent quite some time with histogram plot and noticed there are two way you can set up bins for it: ▪ specify number of bins as an integer ▪ specify range of values for every bin (it can be int or float)
With the latter option I was surprised you can have unequal bins which result in a variable bin width (see purple plot below).
Lots of X-ray flares! Check out this movie showing all the large(ish) flares observed with the @stix_so instrument on-board @ESASolarOrbiter since Jan 2021 as it makes its orbit around the Sun 🌞〰️🛰️ size of circle = relative size of flare made with @SunPyProject@matplotlib
If you're unsure of which method to use for creating subplots, subplot_mosaic is always a good starting point: fig, axd = plt.subplot_mosaic([['point', 'area'], ['line', 'line']])
Sure Excel is cool. But have you tried @matplotlib to achieve some tricky plots or customize / annotate them ? I've just plotted my gap at my theoretical goal of books read with a simple csv file from @goodreads and 🐍 df.cumsum, pd.concat and plot(drawstyle = 'steps')!
Been using @matplotlib instead of trying to figure out tikz pictures in tikz-cd layout & that's turned into more examples in the annotation tutorial (and a pending mathtex docs pr) on how matplotlib + pgf backend is a workable substitute matplotlib.org/devdocs/users/explain/text/annotations.html
Quick example showing it with Cartopy, AFAIK in the past it would have always needed separate calls to "fig.add_axes / fig.add_subplot", not anymore! 🥰
Apart from the obvious layout features, something that I also really like about it are the per-subplot kwargs it enables (as a nested dict). I've used that for example with Cartopy projections, having one large/global axes and another detailed local one.
TIL that, #googlecolab has rolled out an exciting new feature ✨ Colab now supports the ability to preview a wide range of plot types for any pandas DataFrame right within the notebook. 📊📈 Once you find a plot that best represents your data, Colab auto-inserts the corresponding code into your notebook.
A really cool feature of @matplotlib 's annotation is that you can anchor a label to two artists. Here gamma_2 is at x = .5 braces, y = gamma_1 y Learned this by working on the annotation tutorial, which is always my fave way to learn. matplotlib.org/devdocs/users/explain/text/annotations.html
Hey folks, 1st Tuesday of the month means chatting about contributing time! Feeling confused, overwhelmed, frustrated about contributing? Feeling excited but not sure how to dip in a toe? Want to tell us about what you're doing? Come on over! hackmd.io/@matplotlib/ncm2023
Hey folks, 1st Tuesday of the month means chatting about contributing time! Feeling confused, overwhelmed, frustrated about contributing? Feeling excited but not sure how to dip in a toe? Want to tell us about what you're doing? Come on over! hackmd.io/@matplotlib/ncm2023
Recorded lectures, with 100s of #python code walk-throughs, interactive dashboards to explore concepts & models, and well-documented, best-practice demonstrations.
Given a positive test, '+', what is the probability that the an 'Event' is happening? Change the probability of the event, P(Event), true positive, P(+|Event), and false positive, P(-|Event), conditional probabilities, then watch the change in the posterior, P(Event|+)!
I also added P(Not Event|+), P(Event|-) & P(Not Event|-).
I've been exploring step plot options in @matplotlib recently.
It turns out there's quite a few options to choose from. Let's have a look and learn how to use every one of them.
1️⃣ ax.step()
It makes sense the function for producing step plots is called... step()!
It provides `where` parameter that, depending on the type of step you're after, accepts the following options: ▪ `pre` ▪ `mid` ▪ `post`
One thing to remember is that you always have to provide x and (the respective) y values for the plot.
2️⃣ ax.plot()
Yes. The good ol` plot() function can do step plotting.
It's possible thanks to the `drawstyle` parameter. Mind that in this case the acceptable options are slightly different compared with the steps() function. They are: ▪ `steps-pre` ▪ `steps-mid` ▪ `steps-post`
Remember, that the plot() function only needs y values and it will generate respective x's staring from 0, 1, ... if that's what you're after.
3️⃣ ax.plot() & ax.fill_between()
This is the coolest trick today as ax.plot() can be accompanied with ax.fill_between() to create a nice shading under the line plot.
The ax.fill_between() offers `step` parameter which accepts options similar to the ax.step() function: ▪ `pre` ▪ `mid` ▪ `post`
4️⃣ ax.stairs()
Last but not least - the stairs() function. It needs to be given two parameters: ▪ `values` : these are the y's or step height ▪ `edges`: this are the x's or step width
The caveat with the edges is that the `len(edges)` must be +1 compared with the length of the values.
For example: - If you have 5 values, you need 6 edges.
There aren't any parameter for choosing the step type but depending on how you build your edges, you'll be able to achieve the following options: ▪ `pre` ▪ `post`
I must admit this functions seems a bit complicated and I'm struggling to think of a case where I would use this function over previous ones. But it's here. And now you know and if you want, you can use it.
I built out an interactive @matplotlib dashboard to visualize the performance of the k-means clustering #heuristic with Delaunay triangulation & solution clustering in inertia and feature space.
What did I learn?
1. Know your #machinelearning tools: solution stability is lower than expected in many cases, there may be many local minimums!
2. Exploring with #code: in the #python ecosystem its so easy to bolt on a new algorithm for powerful analysis or visualization.
New Preprint titled 𝐑𝐨𝐛𝐮𝐬𝐭 𝐜𝐡𝐚𝐨𝐬 𝐢𝐧 𝐨𝐫𝐢𝐞𝐧𝐭𝐚𝐭𝐢𝐨𝐧-𝐫𝐞𝐯𝐞𝐫𝐬𝐢𝐧𝐠 𝐚𝐧𝐝 𝐧𝐨𝐧-𝐢𝐧𝐯𝐞𝐫𝐭𝐢𝐛𝐥𝐞 𝐭𝐰𝐨-𝐝𝐢𝐦𝐞𝐧𝐬𝐢𝐨𝐧𝐚𝐥 𝐩𝐢𝐞𝐜𝐞𝐰𝐢𝐬𝐞-𝐥𝐢𝐧𝐞𝐚𝐫 𝐦𝐚𝐩𝐬 from my PhD work is out in Arxiv today.
I'm enjoying playing with the k-means #clustering#heuristic. We often use heuristics, short cuts that sacrifice accuracy for speed. #machinelearning or cognition, #heuristics make life feasible!
But do we understand our heuristics? Do we know how they work? Do we understand the bargain that we made? #datascience
PS. I'm also quite annoyed that the Code Interpreter training data has been so heavily polluted with the outdated @matplotlib API. The MPL team has put such a lot of effort to make it much better including creating better docs, and now we are back at step 1.
This week, I taught that the #machinelearning k-means #clustering solution #heuristic is quite robust. ... then I thought, wouldn't it be fun to demo with code?
I visualize the cluster prototype iterations & report the inertia CDF. For this case, there are 2 possible solutions, 1 global & 1 local (that occurs over 5% of runs)! Interactive @matplotlib is so powerful!
We have a bugfix release! All sorts of fixes, some in pdf and for missing values and in compatibility and clipping and layout and check the release notes! 🥳 github.com/matplotlib/matplotlib/releases/tag/v3.7.2
We’re getting back into the groove after the long weekend with @CharmingData's blog post on creating an interactive web app with @matplotlib, #python, and #dash. 🕺
Matplotlib is useful for building static plots and charts, but when interactive components (e.g. dropdown menus, sliders, and buttons) are incorporated with Dash, users can dynamically modify data and observe real-time updates.
Read this step-by-step guide to learn how to leverage Matplotlib's robust plots with Dash's intuitive API to create dynamic and immersive data visualizations. ➡️ plotly.com/blog/dash-matplotlib/
Here is a summary of observations from both @GeminiObs telescopes in June 2023, divided by instrument and color-coded by location. Welcome back Gemini North 🥳!
Hey folks! Are you interested in contributing but feeling a little overwhelmed? Not quite sure where to start or what's important? Come join our new contributors meeting this Tuesday! Agenda at : hackmd.io/@matplotlib/ryQ0xkTxi
Hey folks! Are you interested in contributing but feeling a little overwhelmed? Not quite sure where to start or what's important? Come join our new contributors meeting this Tuesday! Agenda at : hackmd.io/@matplotlib/ryQ0xkTxi
We're participating! We've got a bunch of great projects, including a collab w/ @geopandas to improve integration & w/ @QuantStack to make an ipcanvas backend! Google has broadened eligibility to include bootcamps! Learn more about our projects at github.com/matplotlib/matplotlib/wiki/GSOC-2021-ideas
We're participating! We've got a bunch of great projects, including a collab w/ @geopandas to improve integration & w/ @QuantStack to make an ipcanvas backend! Google has broadened eligibility to include bootcamps! Learn more about our projects at github.com/matplotlib/matplotlib/wiki/GSOC-2021-ideas
I spent the last few weeks working on a new release w/ new docs (residentmario.github.io/geoplot/index.html), bugfixes, and feature improvements. Some things it can do:
We have a participating student! We're psyched that mentoring with @geopandas, we get to work with a student to improve integration between our projects.


 Matplotlib
@matplotlib

 Ren
@Ryrenz
 Michael Pyrcz🌻

 IEEE VIS
 Data Visualization Society

 Simone Conradi


 Polars


 Luis Montejo


 GitHub Projects Community


 am i suzu or am i selene?
 vik
 NumFOCUS


 PyData

 Luis Pedro Coelho


 Matt Harrison
 richard

 SciPyConf

 Gael Varoquaux 🦋

 Giuseppe Petricca

 Marcin Szwagrzyk

 Tim

 marimo
 Pawel Jastrzebski 🇵🇱 🇬🇧


 Dr. Kate Holterhoff
 The Orbital Mechanic

 grplot

 Philip Oldfield

 Thrill Science ✡️ עם ישראל חי

 n622


 Akshay Agrawal


 Carl Burks


 PyCon US


 David5D


 Shisato


 Anthony Starks

 stacktower


 Quansight
 Richard Gerum


 Biplab P.

 Charlie Marsh

 Marc Skov Madsen, PhD, CFA®


 ApertureNeuro

 ZY-LunarCrater🌕🪐🇨🇳

 Zac Swider

 Panel


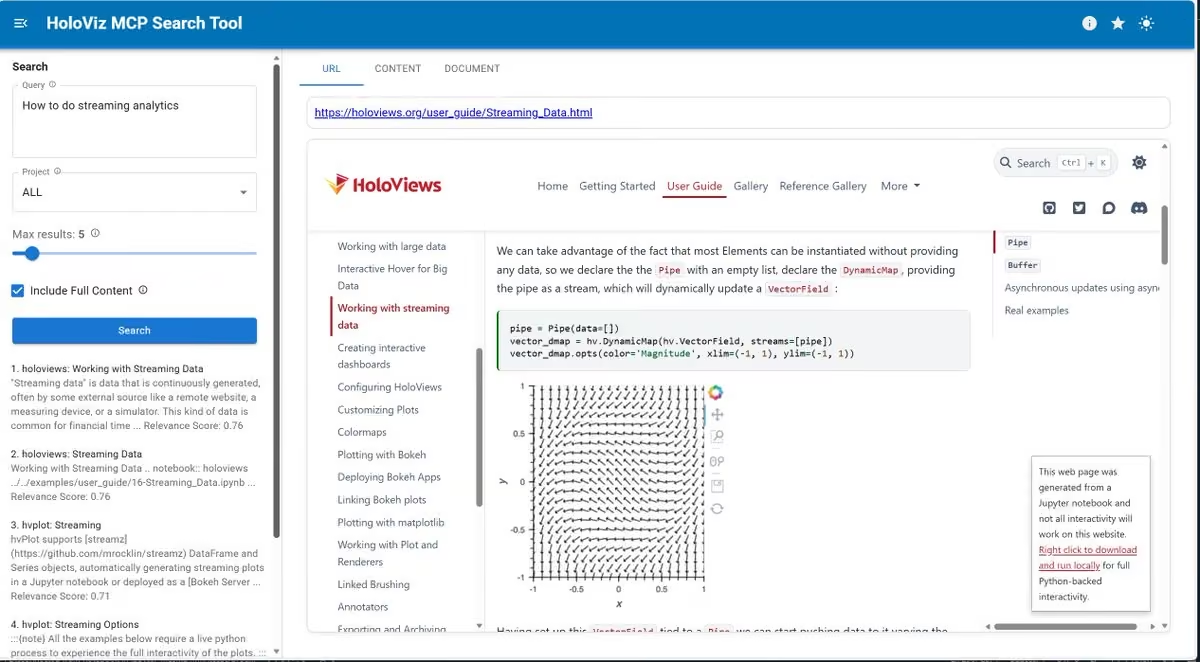

 Ethan
 Esteban Carisimo

 Allen Downey
 jasalt
 Bierock Obama
 scipython3

 Axel Donath

 Wasiq Ali Yasir


 Niko


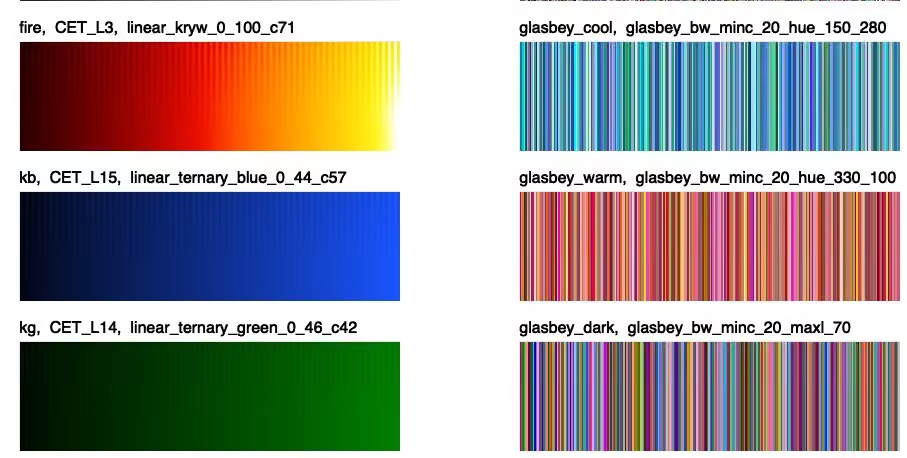
 Jure Leskovec

 Rutger


 Joseph

 Kota


 Squadbase
 Aditya Asopa


 Vanishing


 EuroSciPy

 Mark Vanstone


 lee_j_joon
 Keyon Vafa
 Towards Data Science


 Yan Holtz

 VISxAI

 Sia Mah
 Andrés M-T


 GRASS
 Quentin
 Scientific Python


 Alfredo Canziani
 Marco Piani 🇮🇹🇨🇦


 Alex Rutson


 Leland McInnes


 Koen Van den Eeckhout


 AVTech Engineering LLC 🇺🇸


 Luciano Scarpulla

 Antonio Tropiano 🪳


 Xarray
 zarr_dev


 Jack Morris

 Computational Fluid Dynamics group


 Joachim Schork

 Ren Yuan

 Sophia Yang

 Spyder IDE


 US National Gemini Office
 Jatin K Malik
 Quant Girl 👩🏽💻🌸


 Jan-Hendrik Müller


 Cameron Riddell


 Tom Nicholas
 Robert Haase

 _oxymoron_i


 Jacob Ivanov 🇺🇸


 Swagat Saurav Mishra

 Sharlo'


 orporick


 Chris Holdgraf
 lewis martin

 Lisa Hornung

 Jeremy Howard
 namuaN
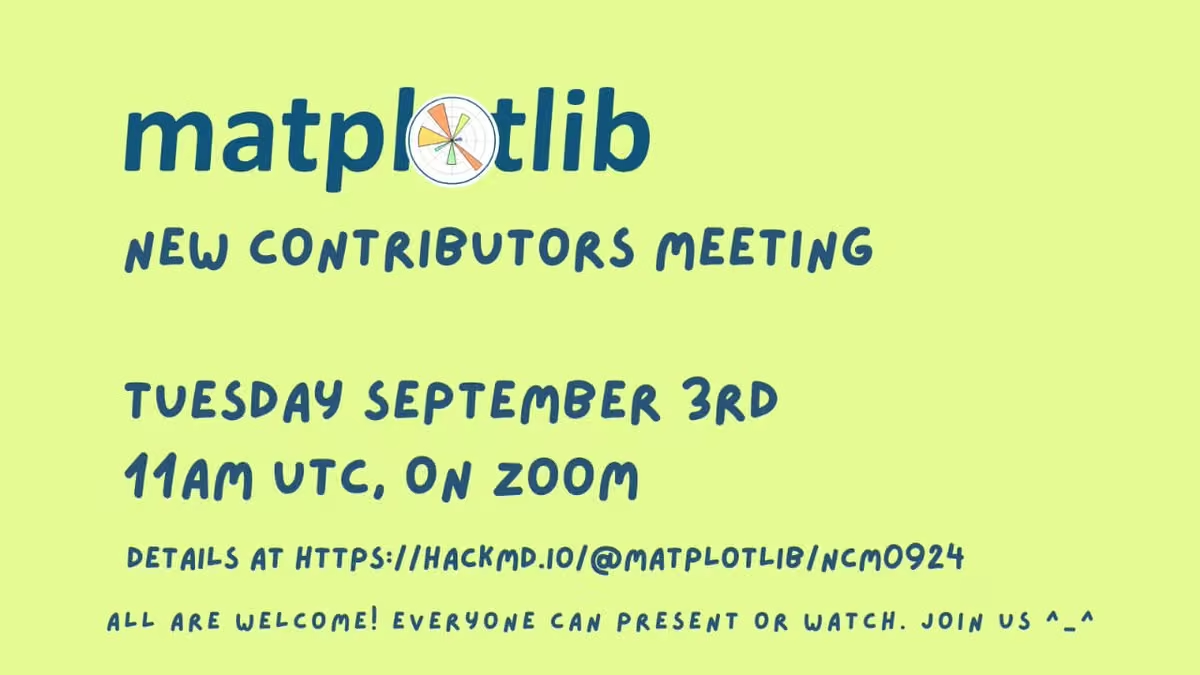
 Sebastian Flores 🌳


 Gabriel Martins

 Jeremy Pinto
 Hannah

 mplsoccer_dev


 ah

 Kyle Kelley
 Tsahi Asher


 Cameron Harwick 👾🏛
 からのしょこ

 Lukas Heinrich


 Marvin Schmitt 👉🦋


 Rowan Cockett 🦋
 Lucas Beyer (bl16)


 COSMO Lab 🇨🇭🇪🇺

 Gustavo Quintero

 Inessa Pawson 💙💛
 Max Grover
 California Python

 napari

 Andreas Hornig


 スモビジ予備校
 Alan Sheehan


 Amit Subhash Chejara


 Mouse Vs Python
 Geoffrey.ts

 Thomas Albin

 -
 Aaron Gokaslan

 Tyler Sloan


 Kedasha ✨


 Philip Brohan


 Nicola Borghi

 MetPy

 Dr. James Beattie


 Lee de Mora


 Jack Jenkins


 Whiterose

 Akshay Deshmukh


 Jacob Tomlinson
 Joe Lucas
 Jascha Sohl-Dickstein

 Alejandro López
 Fanurs C.E. Teh

 Kieran Hunt


 Stephen Gruppetta
 Khuyen Tran
 Python Maps


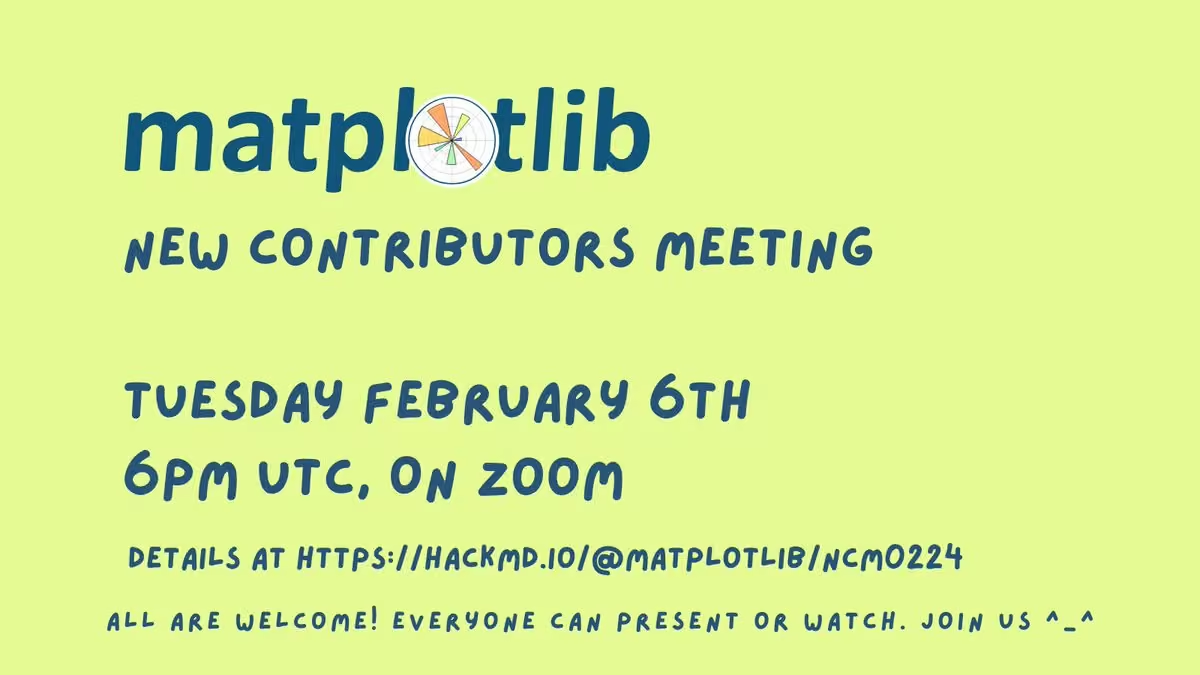
 Jay


 Dennis Kao


 Will Decker
 Tobias de Jong

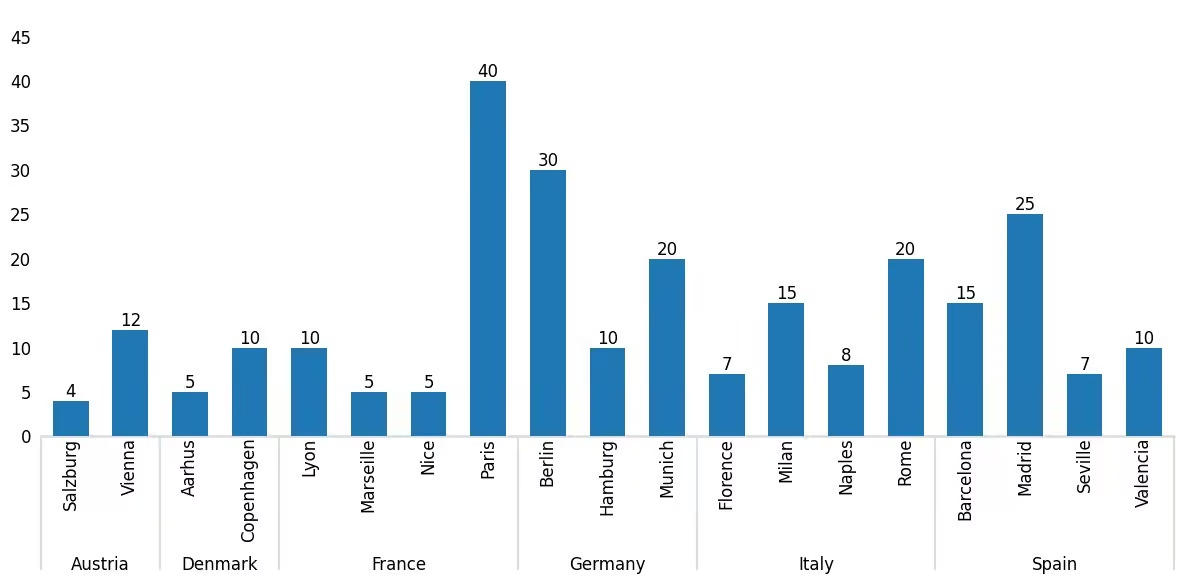


 Elijah Meeks
 Kayson Fakhar

 C Stuart Adams 🇪🇺 📷🖋📡


 troll


 Aitor Morales-Gregorio


 Achim Zeileis @zeileis@fosstodon.org


 Simon Gascoin
 Pengfei

 py5

 AKA NickleDave


 Milan Janosov


 Dominik Haitz


 UofG Institute for Gravitational Research


 Vince Buffalo


 PyData London


 Michael Waskom


 يحيى التلمساني


 merve

 Louis Tiao


 Natalie Schaworonkow
 Pietro Monticone

 Pangeo
 Jared Rennie

 gaussianhoops

 Aman Chokshi


 Conor Hayes


 ChenHP

 Vincenzo Lomonaco


 سیاسی پائے تھون


 Topi Tjukanov


 hexagonone.eth

 Dr Robbi Bishop-Taylor 🦋


 chiko
 Adam Michael Wood

 Jon Ollington


 Dr. Saavik Ford


 Simon Kuestenmacher

 Pedro Cintra

 Kyle Barron kylebarron.dev on bsky

 alt.VIS at #IEEEVIS


 Williams Omotayo Adaji-Agbane


 Oleg Zendel


 Thomas Bury
 Madi Dian


 wat@Pythonブログ

 シバッチ


 m förster


 Maarten A. Breddels


 Stefan Pullen

 Python_cursos

 Ubuntu-Touch


 Jessica Hullman

 Mark Muetzelfeldt
 Teresa Kubacka
 Debasish
 RJ Andrews

 Fortune Uwha


 Kyle J Gillett


 💛
 Timon Merk


 Wicked


 vicki


 World of Statistics
 Hacktoberfest
 Eduardo Balbinot

 Toviah Moldwin


 PyMC Developers https://bayes.club/@pymc

 Swiss Python Summit

 Mauro Silberberg


 FM Homelab
 Sylvia Schmitt


 Jan Tünnermann


 Alexander CS Hendorf
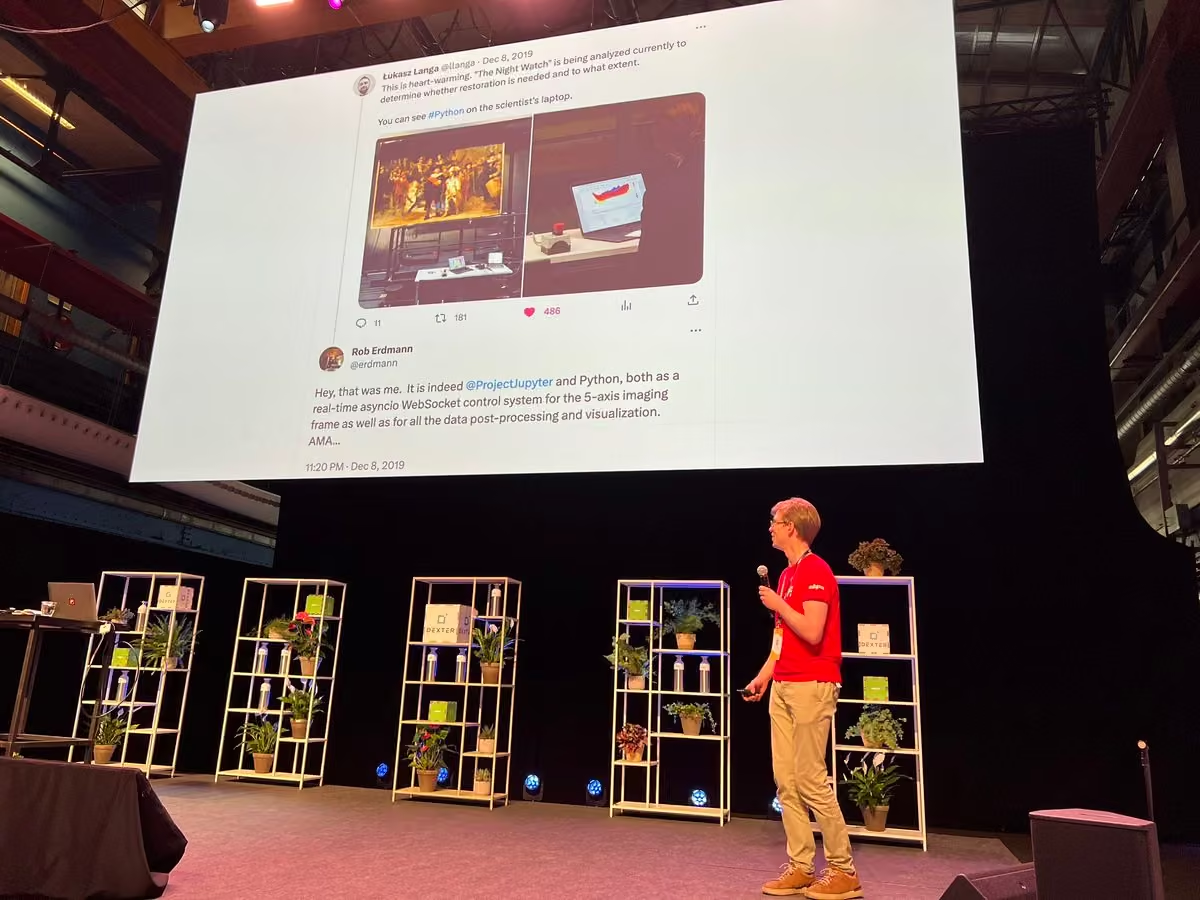
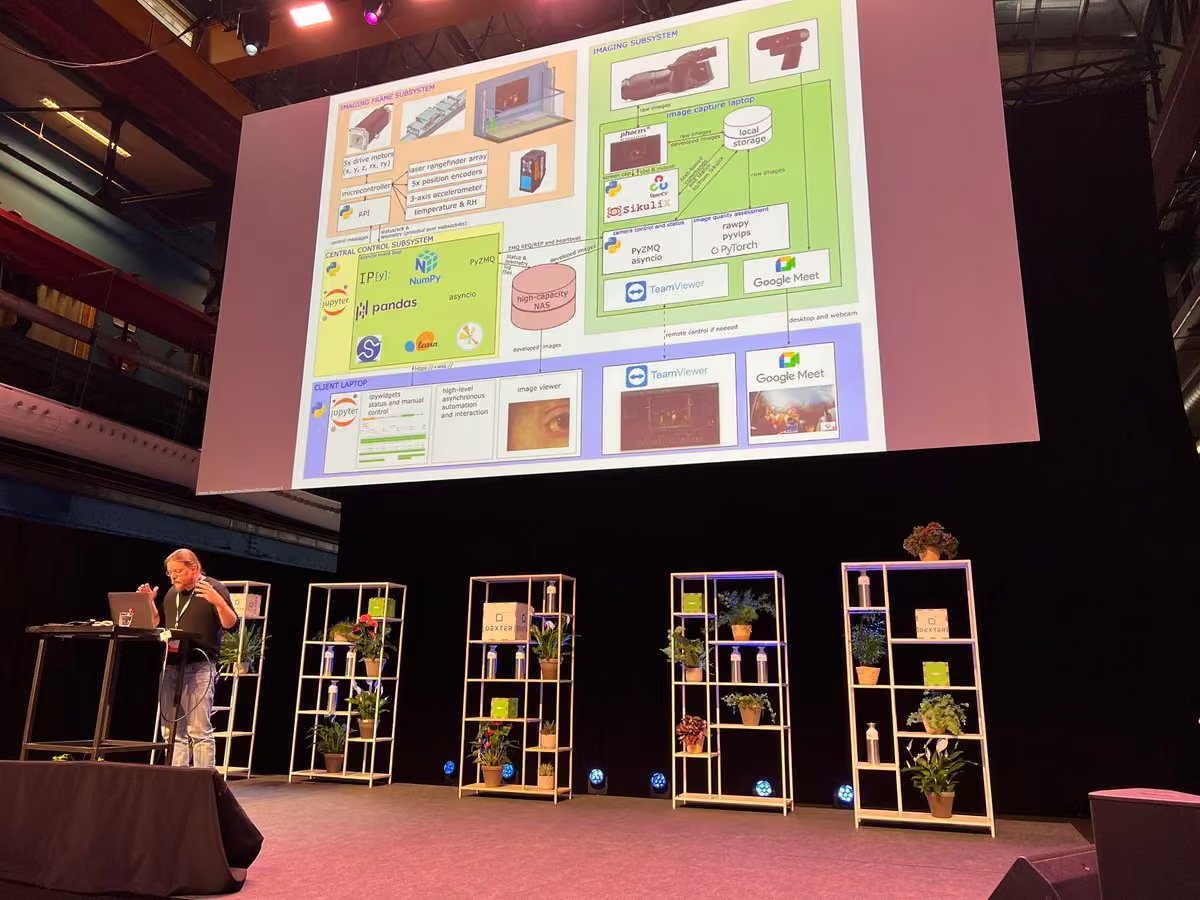
 Sarah L. Fossheim (they/them)


 🌐🧭 Juan Carlos González


 Max Noichl


 Gerson Mayer

 Dmitry


 HackMD

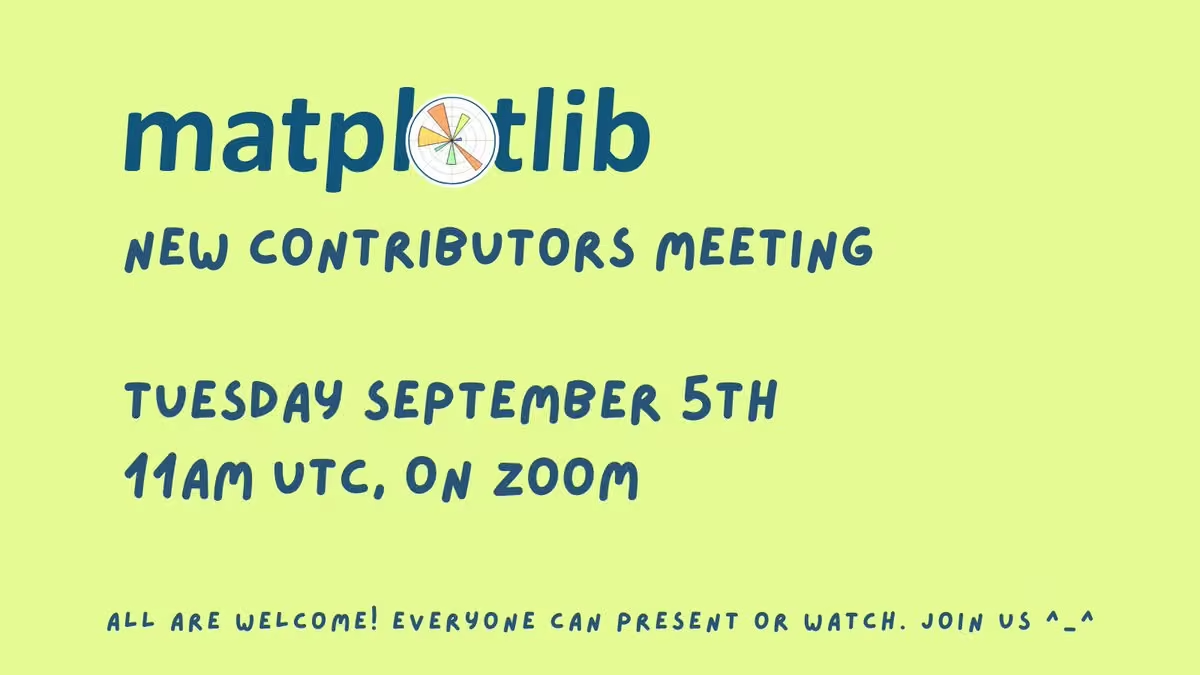
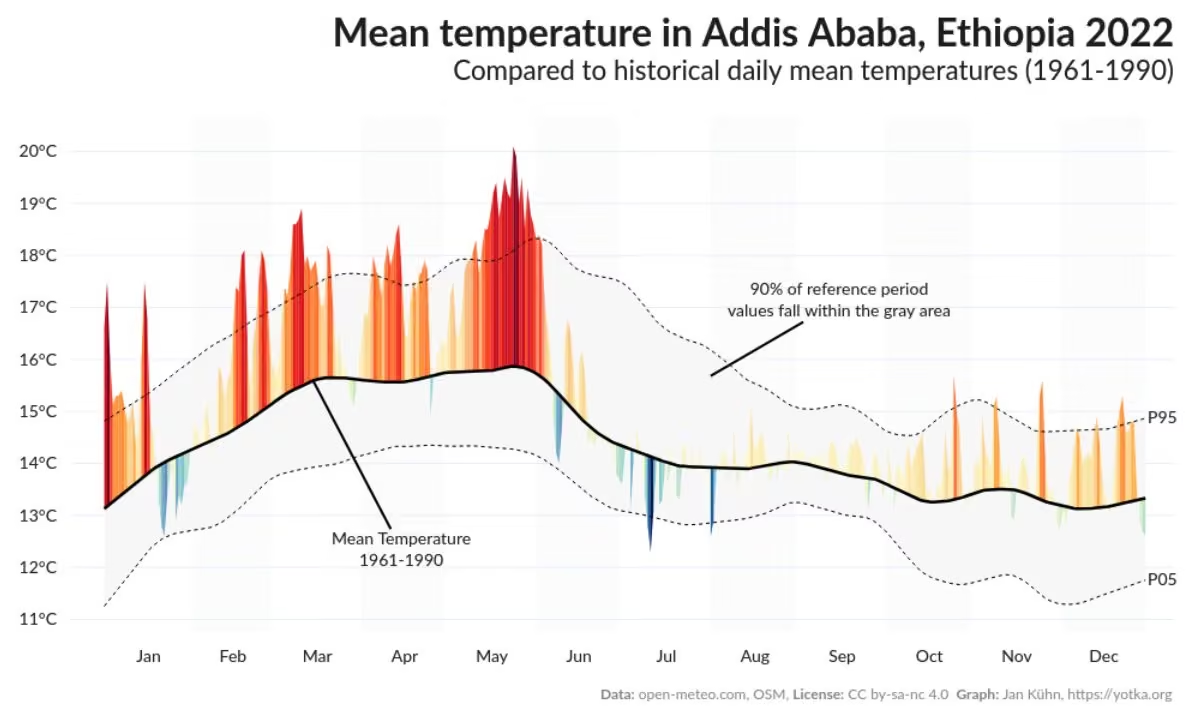

 Akshay 🚀

 Don't Use This Code—Expert Training & Consulting


 DeepLabCut 🦄
 Bokeh Visualization Library
 名古屋市上下水道局
 Mark Boss
 Jon Barron


 Elwynn Chen




 pyOpenSci ( @pyOpenSci@fosstodon.org )


 Laura A. Hayes


 Ammon Perkes

 scikit-learn
 Rodolphe Gintz


 Flip Tanedo
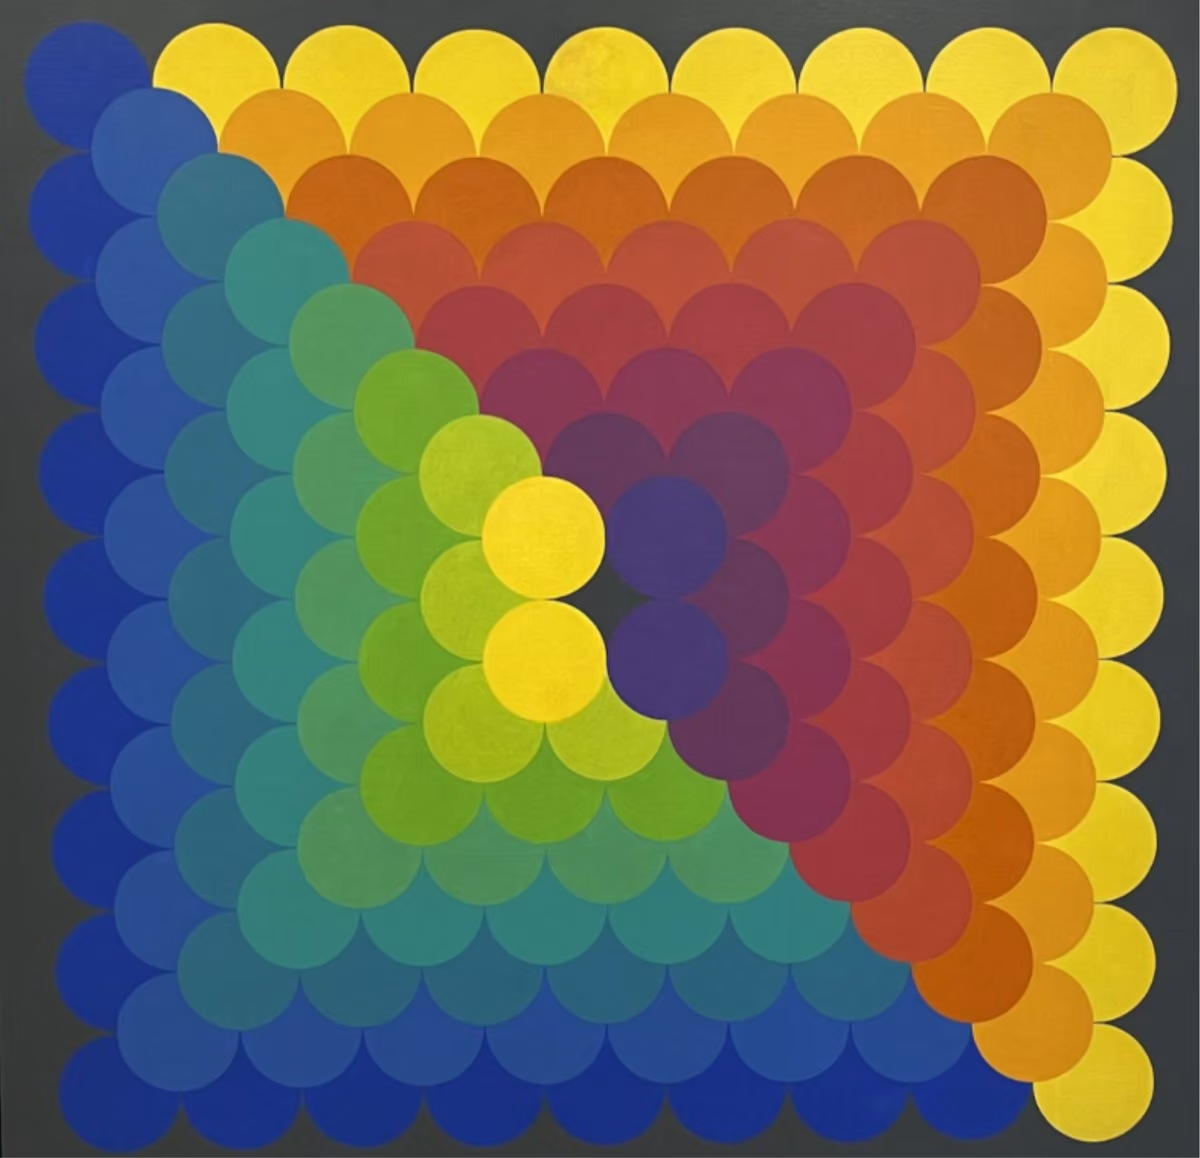


 Lucy Downes
 Ed Doddridge


 Parul Pandey


 Gareth Cooper

 Piano For Machine Learning


 Dr. Alejandro E. Rodríguez-Sánchez


 Amar Singh

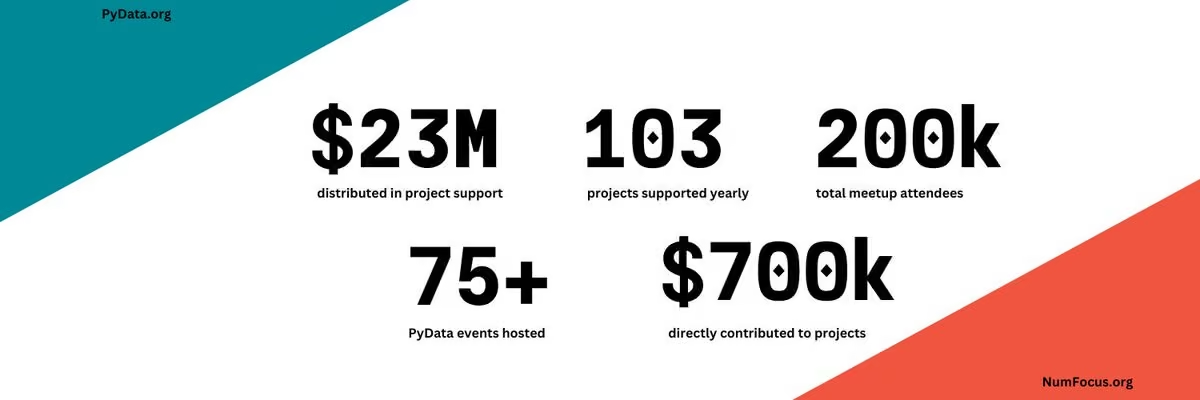
 Twill

 Vivek

 Andy Rowlinson


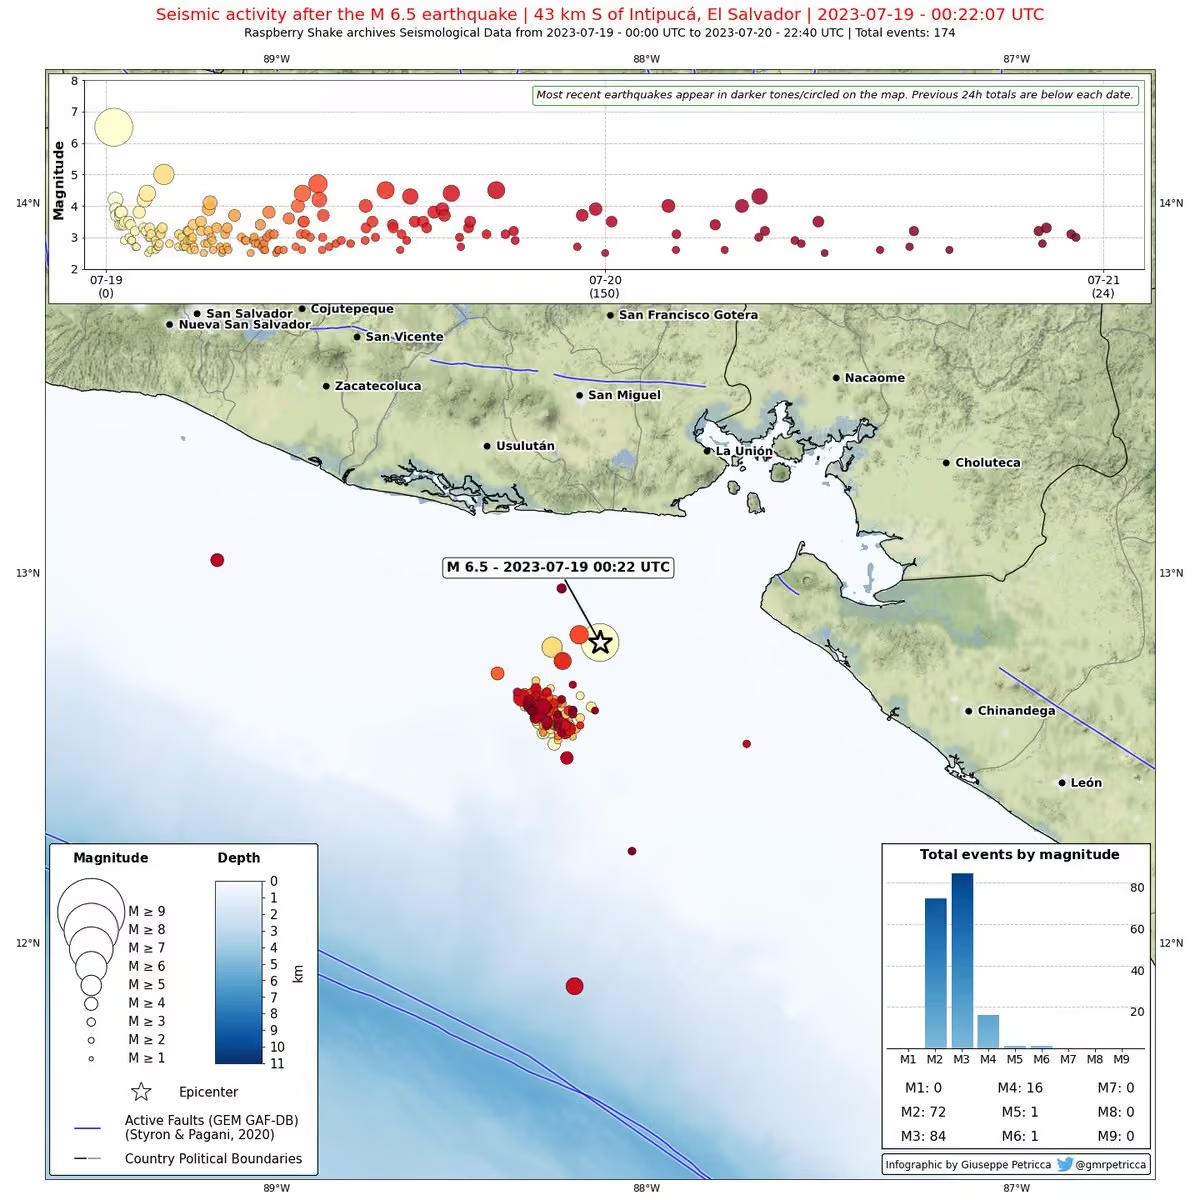


 Cheuk Ting Ho

 Dillon Niederhut PhD is at #SciPy2026

 F1TEL.com - Tracing Insights - F1 Analytics 📈


 Indra


 Paul “π” Ivanov - @ivanov@mastodon.sdf.org


 Lewis 🇺🇸


 Alonso Silva

 FracPaQ


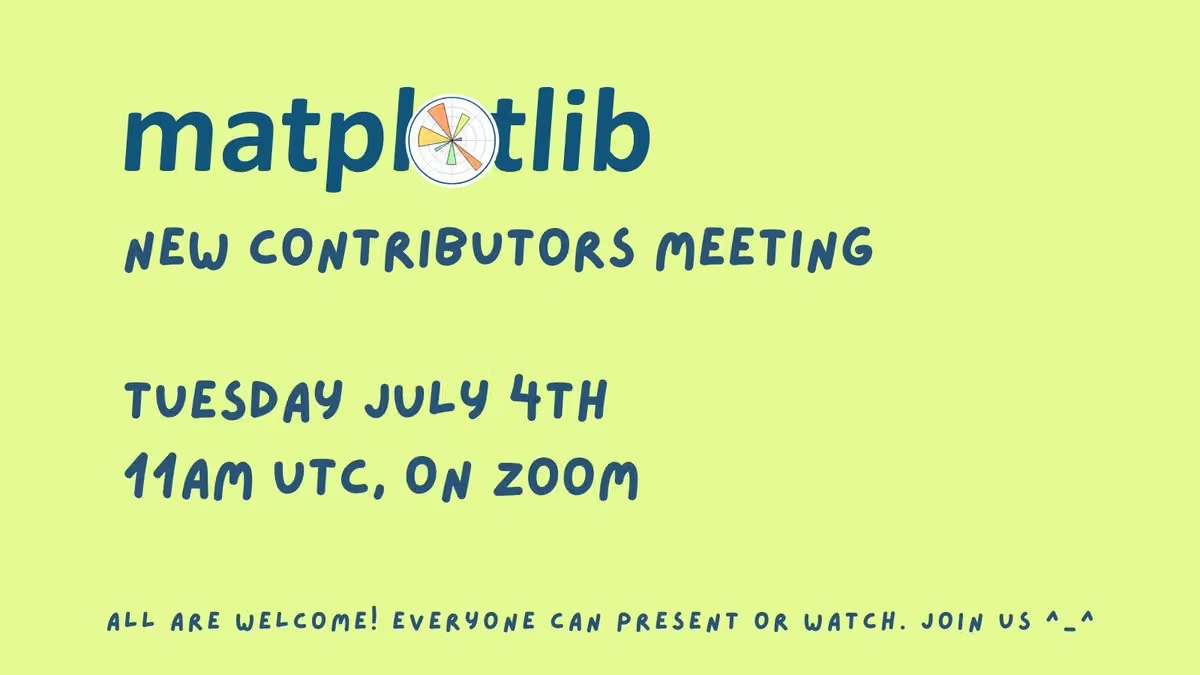


 Mridul Seth
 Aleksey Bilogur