Politicians, athletes, journalists, NGOs, companies... They all use
corporation-owned social networks to communicate with us. Citizens
shouldn't have to hand over their data to companies to read content
published by public entities. Public Feeds changes that by making posts
of popular accounts freely available.
Read more.
Adrian Raftery
Adrian Elmes Raftery (born 1955 in Dublin, Ireland) is an Irish and American statistician and sociologist. He is the Boeing International Professor of Statistics and Sociology, and founding Director of the Center for Statistics and Social Sciences at the University of Washington in Seattle, Washington, United States. More on Wikipedia
Statistician developing statistical methods for demography, atmospheric science & cluster analysis at the University of Washington. RT=interesting≠endorsement.
Our paper on forecasting net migration just published. Net migration is widely used for population forecasting, because it is often available when other metrics are not. But it has problems, notably with the age pattern of migration. Our method overcomes these problems
Proud to have been awarded the IFCS Research Medal by the International Federation of Classification Societies, for fundamental contributions to the advancement of Classification, Clustering, Data Science and related topics. ifcs2026.unimib.it/ifcs-research-medal/
Our article, "Comparing Variable Selection and Model Averaging Methods for Logistic Regression," w Nikola Sekulovski, Maarten Marsman et al was just published by PNAS: www.pnas.org/doi/10.1073/pnas.2534552123
Our paper, “Accounting for Population Age Distribution in Forecasting Migration,” w Nathan Welch & Hana Ševčíková just published in Demography. Population age structure is important for migration, but current forecasts ignore it. We propose a new method for taking it into account
There is a road not (much) travelled to address the problem raised here-model averaging.
The basic idea to ask what inference may be drawn when one specifies a model space, rather than one model. The model space is defined by different portfolios of assumptions that distinguished specifications. Models are assigned posterior probabilities based on prior beliefs and goodness of fit with complexity penalties to address overfitting. Standard Bayesian-type arguments lead to averaging across models to derive robust conclusions.
Jennifer Hoeting, David Madigan, Adrian Raftery and Chris Volinsky, "Bayesian Model Averaging: A Tutorial" Statistical Science 1999
remains an excellent introduction; Adrian Raftery @AdrianRaftery1, without exaggeration, has been the seminal thinker on averaging over the years. Note should be made of Edward Leamer, whose Specification Searches contains deep precursor ideas.
The most widely cited example of model averaging in economics is
Xavier Sala-I-Martin, Xavier, Gernot Doppelhofer, and Ronald I. Miller, "Determinants of Long-Term Growth: A Bayesian Averaging of Classical Estimates (BACE) Approach," American Economic Review 2004.
which identified robust growth determinants, a small subset of candidate growth regressors. Many other papers have addressed this question using related approaches.
Beyond averaging, one can the distribution of model-specific findings to understand what assumptions drive conclusions across different models. This was done for the deterrent effect of capital punishment in
Steven Durlauf, Chao Fu and Salvador Navarros, Capital Punishment and Deterrence: Understanding Disparate Results, Journal of Quantitative Criminology 2013
and the robustness of monetary policy rules across assumptions in
William Brock, Steven Durlauf, and Kenneth West, "Model Uncertainty and Policy Evaluation: Some Theory and Empirics," Journal of Econometrics 2007.
The state of the art in explorations of robustness across model spaces is
Cristobal Young and Erin Cumberwoth, Multiverse Analysis: Computational Methods for Robust Results, Cambridge University Press, 2025.
We are going to have to establish some ground rules for what robustness means when infinite iterations of a regression can be run and cherry picked by both authors and referees
I built a tool to imagine how AI can help us create better, more transparent research.
Instead of only seeing the tiny number of analyses the author chooses to ossify in a static pdf, imagine being able to talk to the papers you read and ask for different analyses. That's what I built.
This early prototype uses our vote-by-mail extension. You get to see the initial analyses we thought made sense, but you can ask the LLM to show you way more! e.g., "what would the results look like if we excluded Utah" or "what would the results look like if we excluded Washington and used linear trends" etc.
With research agents like Claude code, researchers are going to be able to automatically search across millions of potential analyses. Our current paradigm is not equipped to transmit this complexity effectively or make sure we don't end up with all p-hacked results.
My lab and I are thinking about how we can transform the way we do and disseminate research to adjust for this new world. This visualizer is the first of what will hopefully be a wide range of ideas. Big props to Janet Malzahn for suggesting this one.
Our explainer ``Pattern scaling: How local warming is related to global warming: An explainer,’’ with Andrew Garrett & David Stephenson just published in Significance: academic.oup.com/jrssig/article/23/1/30/8380146
Thrilled to share that our paper “Mitigation efforts to reduce carbon dioxide emissions and meet the Paris Agreement have been offset by economic growth” is officially published!
Grateful to @AdrianRaftery1 and Skylar Shi for their support and collaboration!
Our paper, "A privacy-preserved and high-utility synthesis strategy for risk-based stratified subgroups of the Canadian scleroderma patient registry data" w Bei Jiang, Russell Steele & Naisyin Wang, just published in Ann Appl Stat: projecteuclid.org/journals/annals-of-applied-statistics/v…
Our short course on Subnational Probabilistic Population Projections at @PopAssocAmerica 2025 sites.stat.washington.edu/raftery/PAAcourse2025flyer.pdf will now be hybrid. To ask to join remotely, email raftery@uw.edu from your professional email by April 7 with subject “Join PAA workshop” & say why you want to.
Our short course on Subnational Probabilistic Population Projections at @PopAssocAmerica 2025 sites.stat.washington.edu/raftery/PAAcourse2025flyer.pdf will now be hybrid. To ask to join remotely, email raftery@uw.edu from your professional email by April 7 with subject “Join PAA workshop” & say why you want to.
🎉 📷 Excited to announce our 2025 COPSS Emerging Leader Award (ELA) winners. The COPSS ELA recognizes early career statistical scientists who show evidence of and potential for leadership and who will help shape and strengthen the field.
Indeed, he not only taught me honours maths and physics in Dublin half a century ago, he introduced me to Martin Gardner's Sci Amer columns on recreational mathematics.
Over three decades later, I got to meet Martin Gardner and in time played a role in the Gathering4Gardner org.
My mathematics teacher at @Stconleths, Michael Manning, died last night. He is second from right in this photo from the 2013 Hamilton Walk in Dublin, commemorating the discovery of quaternions. A great teacher who also taught @duncantl and Maurice O’Reilly. RIP
My mathematics teacher at @Stconleths, Michael Manning, died last night. He is second from right in this photo from the 2013 Hamilton Walk in Dublin, commemorating the discovery of quaternions. A great teacher who also taught @duncantl and Maurice O’Reilly. RIP
We are thrilled to announce Mary-Claire King of @UW as this year's recipient of the prestigious NAS Public Welfare Medal! She is honored for her pioneering genetic research and its transformative application to human rights. See the announcement: www.nasonline.org/news/2025-public-welfare-medal-recipien…#nasaward
We are now accepting applications for our Annual Workshop on Formal Demography, taking place in-person at UC Berkeley on June 2-6, 2025. Deadline to apply is March 10.
Our Climate Change and Net Zero Task Force has released a guide to help you navigate the most reliable UK official statistics on climate, from everything from weather events to renewable energy usage 🌍
in lecture on tuesday, I turned on voice memo in my iphone. had it transcribe lecture to text. I also took photos of the blackboard. Then, dumped it into gpt (o1) and asked it to make latex lecture notes
single shot looks great. the students are stoked (not joking. ded serious)
via @WA_OFM Population change: natural increase and net migration | Washington state population. Population change is comprised of two major components -- natural increase and net migration. Natural increase (births minus deaths) is the more stable... ofm.wa.gov/washington-data-research/statewide-data/washin…
Bayesian methods have become increasingly popular in many Social Sciences: Anthropology, Archaeology, Demography, Economics, Geography, History, Linguistics, Political Science, Psychology, Sociology...
Our preprint, “Forecasting Net Migration By Age: The Flow-Difference Approach,” w Hana Sevcikova and @Jamesraymeranu, just issued: arxiv.org/abs/2411.09878. Overcomes the failure of the Rogers-Castro model for net migration due to age patterns of in- and out-migration differing
Just got back from the wonderful Bayesian Methods for the Social Sciences conference in Amsterdam. Many thanks to all the speakers, the participants, and the local organizing team!
It was an exciting, thought-provoking event. I'm already looking forward to BMSS3 in 2026!
Interviewer: "How would you describe statistics?" Ross Ihaka: "It's really the study of information, meaning quantitative information, and how you use it, whether it be to understand some situation or to predict ahead what's going to happen."
Adrian Raftery reposted
ASA History of Statistics Special Interest Group@HOS_ASA
#otd 1890 Louis-Dominique-Jules Gavarret d (b 28 Jan 1809) 🇫🇷An early pioneer of the 'statistical method' in medicine, his book 'Principes de Statistique Médicale' (1840) is the one of the first to outline statistical principles for rigorous clinical trial conduct. 1/11🧵
The second Workshop on Bayesian Methods for the Social Sciences (BMSS II) is coming up in Amsterdam, Oct 16-18: bayesforshs2.sciencesconf.org?lang=en A great programme of tutorials & research talks. Registration is only 50 € & will close on September 27.
Excited to share that our team received NSF funding to create a US Human Fertility Database. We'll be generating state-specific (since 1959) & county-specific (since 1982) period & cohort fertility indicators that will be easy to access.
📚🇬🇧 Very happy to see my book coming out in paperback in the UK today!
It looks at 7 of our big environmental problems (not just climate) and charts the journey of how we got here, progress that has been made (yes, there has been some) and importantly, what we need to do next.
A future is possible where humans can flourish while reducing our environmental impact at the same time. But it won’t happen on its own: we need to get to work to make it so.
World Population Prospects 2024 just issued by the @UN Population Division @UNDESA. For the first time it includes uncertainty about migration, a major breakthrough. Congratulations @Patrick_Gerland & the whole Division.
According to the World Population Prospects 2024 developed by @UN@UN_DESA, 4.7 million babies, or about 3.5% of the total worldwide, were born to mothers under 18 in 2024.
The assessment of migration uncertainty is based on www.pnas.org/doi/abs/10.1073/pnas.1606119113 It makes little difference to projections of global population, or for countries for which fertility uncertainty dominates (mostly high fertility countries).
But it does make a big difference to uncertainty about future population in countries for which migration is important, such as Germany, the US, Mexico, or small countries with a history of migration like El Salvador or Ireland.
Happy anniversary to @DemographicRes ! It was a real honor to interview @AdrianRaftery1 about the UN probabilistic projections and Bayesian demography. Link to interview below
We are celebrating our 25th anniversary today 🥳and to kick off Volume 21 Monica Alexander interviewed 🎙️Adrian Raftery!! Read the full interview here: www.demographic-research.org/articles/volume/51/1/
Process led by @Patrick_Gerland with key early steps by Thomas Buettner and credit to Hania Zlotnik, John Wilmoth, Hana Ševčíková, Mark Wheldon & many others. Developed since 2006, official since 2015. The next revision WPP 2024, will be launched on World Population Day, July 11.
Happy anniversary to @DemographicRes ! It was a real honor to interview @AdrianRaftery1 about the UN probabilistic projections and Bayesian demography. Link to interview below
We are celebrating our 25th anniversary today 🥳and to kick off Volume 21 Monica Alexander interviewed 🎙️Adrian Raftery!! Read the full interview here: www.demographic-research.org/articles/volume/51/1/
We are celebrating our 25th anniversary today 🥳and to kick off Volume 21 Monica Alexander interviewed 🎙️Adrian Raftery!! Read the full interview here: www.demographic-research.org/articles/volume/51/1/
Thank you @AdrianRaftery1. It is so awkward to hear oneself in an interview. But here is hoping that this @PNASNews research helps support COVID vaccination among pregnant people, especially in vulnerable and disadvantaged communities.
Simple yet theoretically solid method for estimating marginal likelihoods from MCMC samples. Incredibly valuable for tasks such as model selection or BMA. Congratulation to M. Metodiev for his 1st paper. Joint wk with M Perrot-Dockès, S. Ouadah, @NicholasJIrons, @AdrianRaftery1
We propose an easily computed estimator of the marginal likelihood from MCMC via reciprocal importance sampling. It involves only the unnormalized posterior densities from the sampled parameter values. It is unbiased, consistent, finite variance, & asymptotically normal.
Pretty excited about #paa2024 ! Here's some info on talks/posters related to us here at @UofTStatSci@UofT_Sociology! Topics: parental death, childlessness, online geneaologies, and (ofc) Bayesian methods. And I'll have some formal demography working group stickers! Come say hi!
Workshop on Bayesian Methods for the Social Sciences in Amsterdam, October 16-18, 2nd edition, with a terrific program. Info & registration: bayesforshs2.sciencesconf.org. The first edition was in Paris in 2022 and was a great success! Please repost.
The first day consists of 3 overview tutorials: Bayesian demographic estimation by @monjalexander, Bayesian graphical modeling by @MarsmanMaarten, and Modelling language change by @RobinJRyder. Days 2 & 3 have 21 exciting research talks. Posters invited.
Our new preprint just issued on arXiv, “Bringing Age Back In: Accounting for Population Age Distribution in Forecasting Migration,” w Nathan Welch & Hana Ševčíková: arxiv.org/abs/2403.05566. Most official migration projections don’t account for population age distribution, but ...
it should be done and makes a difference, particularly as populations are aging everywhere. This is because migration is highly age-dependent, highly concentrated before age 35. We show how to do it and what the implications are.
Cozzarelli Prize from @PNASNews won by important paper by Florentia Torche & @je_nobles "Vaccination, immunity, and the changing impact of COVID-19 on infant health" www.pnas.org/doi/full/10.1073/pnas.2311573120. COVID-19 vaccines prevented many preterm births.
The 2023 Cozzarelli Prize recipients have been announced by PNAS, recognizing six papers that have made significant contributions to the scientific disciplines represented by @theNASSciences! Read about the award-winning research: www.pnas.org/post/update/2023-cozzarelli-prize-recipients
One possible explanation is that there is a plateau from 110, but that mortality rates continue to increase between 105 and 110. Another is that there is continued mortality increase after 110, but that it's too small to detect with the existing sparse data. More research needed!
Disruptions in Educational Progress and Fertility Dynamics by Educational Level: Unraveling the Link between Education and Fertility Stalls in Sub-Saharan Africa, by Schoumaker & Sánchez-Páez: onlinelibrary.wiley.com/doi/abs/10.1111/padr.12610
Measuring short-term mobility patterns in North America using Facebook advertising data, with an application to adjusting COVID-19 mortality rates, by Katz, Chong, Alexander: www.demographic-research.org/articles/volume/50/10
A Bayesian model for the reconstruction of education- and age-specific fertility rates: An application to African and Latin American countries, by Durowaa-Boateng, Yildiz, Goujon: www.demographic-research.org/articles/volume/49/31
Bayesian implementation of Rogers–Castro model migration schedules: An alternative technique for parameter estimation, by Yeung, Alexander, Riffe. Super useful! www.demographic-research.org/articles/volume/49/42
Interpreting changes in life expectancy during temporary mortality shocks, by Patrick Heuveline. Subtle analysis of a tricky demographic topic by a leading thinker. www.demographic-research.org/articles/volume/48/1
Responses to Sexual and Gender Identity Measures in Population-Level Data by Birth Cohort: A Research Note, by Julian et al. Important information on a rapidly emerging demographic research topic. read.dukeupress.edu/demography/article-abstract/61/1/15/3…
Sexual Fluidity: Implications for Population Research, by Joel Mittleman. 1 in 11 American adults changed sexual identites. An important future research topic for both "core" and social demography. read.dukeupress.edu/demography/article/60/4/1257/381063/S…
Interesting article. Demography's Changing Intellectual Landscape: A Bibliometric Analysis..., by Merli et al. Shows a trend away from "core" towards social demography in Anglophonia. Is it different in other countries & journals, e.g. @DemographicRes?. read.dukeupress.edu/demography/article/60/3/865/355268/De…
A system of population estimates compiled from administrative data only, by John Dunne & LC Zhang, of the Irish Central Statistics Office, with Discussion: academic.oup.com/jrsssa/article/187/1/3/7142865
Special issue of JRSS A, Networks & Society, on statistical modeling of social networks. An area that is expanding fast. Several interesting papers on the latent position approach. academic.oup.com/jrsssa/issue/186/3?browseBy=volume
Model-based clustering for multidimensional social networks, by D'Angelo, Alfo, Fop. Extends Handock, Raftery, Tantum (2007) to an infinite mixture latent position network model. academic.oup.com/jrsssa/article/186/3/481/6998598
Model-based clustering of spatial social networks using a latent space network model, by Egidi et al. It goes beyond distance-based modeling to account for other dimensions that are important for connections in social science data. academic.oup.com/jrsssa/article/186/1/137/6998435
Dynamic statistical model of the global carbon budget 1959–2020, by Bennedsen et al. Multivariate model of the 4 GCB components: CO2 concentrations, CO2 emissions, land sink, ocean sink: academic.oup.com/jrsssa/article/186/1/20/7008652
Interpolating Population Distributions using Public-Use Data: An Application to Income Segregation using American Community Survey Data, by Simpson, Holan, Wikle, Bradley: www.tandfonline.com/doi/abs/10.1080/01621459.2022.2126779
Journal Update: Demography & Duke University Press are pleased to announce that authors may submit LaTeX files for their final, accepted manuscript. These will be converted to Word for editing. Note that the original submission must still be in PDF format. read.dukeupress.edu/demography/issue/61/1
With today’s news that 2023 was officially the warmest year on record, here’s a graph from the co-chair of our Climate Change Task Force, David Stephenson on global warming over time
Post: PNAS has new guidelines for the retention of new data. We are updating our policy regarding the availability of data, with an emphasis on visual data. Read more about this chance in PNAS: www.pnas.org/post/update/pnas-announces-new-guidelines-re…
Just posted on arXiv: "Multiple Imputation of Hierarchical Nonlinear Time Series Data with Application to School Enrollment Data" w @daphnehliu. We find that our proposed method improves over existing ones for estimating school enrollment and similar situations.
Weekend fun! A new title just arrived. Imagine, a whole book on one R package: mclust… excellent coverage of model-based clustering and classification. #datascience#machinelearning#rstats @CRCPress
Our new preprint "Easily Computed Marginal Likelihoods from Posterior Simulation Using the THAMES Estimator," w Martin Metodiev, Marie Perrot-Dockès, Sarah Ouadah & @NicholasJIrons just issued: arxiv.org/abs/2305.08952
We are thrilled to announce the election of 120 members and 23 international members to the National Academy of Sciences in recognition of their distinguished and continued achievements in original research. www.nasonline.org/news-and-multimedia/news/2023-nas-elect…
Our paper, "Probabilistic Estimation and Projection of the Annual Total Fertility Rate Accounting for Past Uncertainty: A Major Update of the bayesTFR R Package" w @peiran_liu & Hana Sevcikova, just published Open Access in @jstatsoft: www.jstatsoft.org/article/view/v106i08
I wrote a history of Bayesian software and the powerful ideas that made it so popular. It's one of those "Tell us about the olden days" things you get asked when you reach a certain age. But I also try and look at what comes next.
If you're seeking a gift for your 5-8yo, look no farther. "Tricking the Tallyman" is a funny children's book about the first US Census in 1790 (yes!). www.amazon.com/Tricking-Tallyman-Jacqueline-Davies/dp/038… Hidden behind the shenanigans are concepts of bias and measurement error and why they matter.
Describes extension of projections to 2300 (!) needed for assessing the Social Cost of Carbon. This combines the UN's statistical model with review by a panel of 9 leading demographers, whose comments led to changes in the model so that it better reflects fertility & migration
Results: world population likely to grow for most of this century, plateau in the 22nd century, and decline in the 23rd century. Large, but finite uncertainty about world population in 2300.
Probably worth mentioning: Chatterjee's correlation coefficient is both asymptotically normal and bootstrap INCONSISTENT. I do not recall seeing a second such example except for some artifacts (Bickel&Freedman, 1981?).
NEW paper 🚨: Super excited to share my work with @AdrianRaftery1 "Comparing effect of model space priors on statistical inference with model uncertainty" published in first (special) issue of the New England Journal of Statistics in Data Science #bma#statistics#datascience🧵
Very proud my paper "Modal clustering on PPGMMGA projection subspace" doi.org/10.1111/anzs.12360 appeared in the Australian & New Zealand Journal of Statistics special issue dedicated to Prof Geoff McLachlan.
Stunningly good podcast clearly explaining the main results, issues and controversies in modern population projections in 20 minutes, by @Droucaute@lemondefr
Great paper by @porwalanupreet & @AdrianRaftery1 in @PNASNews comparing methods for variable selection in a linear regression model. Adaptive Bayesian model averaging methods do best 🤩
Having annual estimates for Family Planning indicators is key to monitoring the progression of the FP2030 goals. Have a look at our work (so far!) on estimating the source of modern contraceptives with my supervisor @NCahill_Stat and co-supervisor @LeontineAlkema#casiposter2021
… I’d like to share my delight in making it to this point in my career, and end the note with giving thanks to individuals and institutions that helped make it happen!
We invite applications for a full-time (9-month) tenure-track Assistant Professor position, to be appointed 100% in one of the following Social Sciences departments: Communication, Philosophy, Political Science and Sociology.
Excited to see our paper with @LeontineAlkema published in @ReadDemography! We developed a cohort component projection framework that relies on limited data inputs, combined with demographic knowledge, to get projections and estimates of the components of population change
… I’d like to share my delight in making it to this point in my career, and end the note with giving thanks to individuals and institutions that helped make it happen!
Bayesian Methods for Social Sciences workshop in Paris, Oct 19-21: bayesforshs.sciencesconf.org Day 1: tutorials on Bayesian inference by @EJWagenmakers, Bayesian demography by me, social networks by @latouche_pierre. Day 2-3: research presentations. Registration free, closes Sept 23
We have a new paper from a multi-year, multi-disciplinary effort lead by @PrincetonSPIA, @UCBerkeley, and @rff out in @Nature that estimates the Social Cost of Carbon (SCC) as $185, more than 3x larger than current U.S. federal estimate.
Migration #forecasts of are essential for crafting effective policies. This excellent new paper uses a Bayesian hierarchical model to produce effective one-period-ahead probabilistic forecasts - Bravo! (but misses recent work by @iacus & @MCarammia)
Our article, "Probabilistic forecasts of international bilateral migration flows" w Nathan Welch just published in @PNASNews: www.pnas.org/doi/abs/10.1073/pnas.2203822119. Proposes a new method for probabilistic forecasting of international migration flows between pairs of countries
The model uses the stability over time of the spatial distribution patterns of migration. The forecasts were well-calibrated and more accurate than a leading gravity model.
Very interesting discussion on Andrew Gelman's blog of some simulations I did. It's all there: multiple testing, winner's curse, shrinkage and if Bayesians are really frequentists.
Geoff McLachlan has produced many influential works in the areas of computational statistics, discriminant analysis & classification, among numerous other subjects. Read the festschrift in @ANZJStat celebrating his storied career. #freetoread@StatSocAuswww.statisticsviews.com/article/3994/
Life expectancy is a tricky indicator. At the year of birth, the life expectancy was 58.9 in the US for those born in 1920. In the next century, the indicator leaped to 82.4. And the average lifespan of that specific cohort was 69.1 #us#demography#lifeexpectancy Source: HMD
Our article, "Long‑term probabilistic temperature projections for all locations," w Xin Chen, David Battisti, @peiran_liu just published online link.springer.com/content/pdf/10.1007/s00382-022-06441-8.pdf We combine probabilistic forecasts of future global average temperature with a pattern scaling method.
This gives a probability distribution for temperature in any year and place up to 2100. High latitudes warm more than low, continents more than oceans, and the Northern Hemisphere more than the Southern, except for the North Atlantic.
Very proud my paper "Modal clustering on PPGMMGA projection subspace" doi.org/10.1111/anzs.12360 appeared in the Australian & New Zealand Journal of Statistics special issue dedicated to Prof Geoff McLachlan.
Read a short bio and summary of Geoff's immense contribution to finite mixture modeling, classification, pattern recognition, and computational statistics doi.org/10.1111/anzs.12372
Very proud my paper "Modal clustering on PPGMMGA projection subspace" doi.org/10.1111/anzs.12360 appeared in the Australian & New Zealand Journal of Statistics special issue dedicated to Prof Geoff McLachlan.
Katie Wilson & Jon Wakefield describe a computationally efficient model-based approach that allows summary birth history and full birth history data to be combined into analyses of under-5 mortality in a natural way. www.demographic-research.org/volumes/vol47/11/
Powerful critique of the Census Bureau's new disclosure control strategies by a group of prominent economists, just appeared in PNAS. /1 www.pnas.org/doi/10.1073/pnas.2104906119
Our new paper, "Probabilistic Estimation and Projection of the Annual Total Fertility Rate Accounting for Past Uncertainty: A Major Update of the bayesTFR R Package" w @peiran_liu & Hana Ševčíková just released arxiv.org/abs/2207.06593 Used for #wpp2022@Patrick_Gerland
New methods: 1. Estimates and uncertainty about past TFR estimated statistically from all data sources used (VR, censuses, surveys). 2. Probabilistic projections include uncertainty about past. 3. Estimates and projections on annual basis (previous WPPs were on 5-year basis).
Bayesian Methods for the Social Sciences workshop in Paris, Oct 19-21: bayesforshs.sciencesconf.org Day 1: tutorials on Bayesian inference by @EJWagenmakers, Bayesian demography by me, social networks by @latouche_pierre. Day 2-3: research presentations. Registration free but required
"Cold calling students is a surprisingly good idea": This is also my experience. I call on them in order (of seating or last name if on Zoom), though, to reduce the surprise factor. It's not much done in Statistics, but is worth trying more.
Cold calling students is a surprisingly good idea: 👉Rather than making classes awkward, it leads to higher voluntary student participation from more students, and ultimately more learning. 🙋It increases voluntary participation by women, closing the gender gap in participation.
Congratulations to @Patrick_Gerland & UN Pop Division & outside collaborators for a huge achievement, especially in the midst of the pandemic and the problems it has caused for collecting demographic data! Also, thanks @NICHD_NIH for supporting our group's work!
#myoaarticle "Country-based rate of emissions reductions should increase by 80% beyond nationally determined contributions to meet the 2°C target" w @peiran_liu got 52,998 downloads since its publication in Communications Earth & Environment: www.nature.com/articles/s43247-021-00097-8
A new program launching in January will put a cap on fossil fuel emissions and require nearly a hundred of the state’s biggest polluters to partake in a carbon trading scheme. @nickturner217: st.news/3lDMP8h
Finally got my copy of this book on clustering. Have been interested in clustering since a long time ago (franknielsen.github.io/Clustering/index.html). Refreshing to see such a beautifully color illustrated book with many figures and codes in R. Highly recommended! @cbouveyron@AdrianRaftery1
The report discusses new data for Covid from wastewater surveillance, genome sequence testing and nowcasting, and reiterates the need for regular representative sample surveys of prevalence, as done in the UK and elsewhere
I'm really excited to announce that my paper with A. Fresse, @Marco_Corneli and @cbouveyron, on the Dynamic Latent Block Model with an application to pharmacovigilance is now published on Statistics and Computing, also available on HAL at: hal.archives-ouvertes.fr/hal-03146769.🥳
Want to perform clustering on projection subspace? Just published a paper proposing an efficient algorithm for modal clustering estimation on the PPGMMGA projection subspace. Early view of the paper is open access and available at doi.org/10.1111/anzs.12360
Adrian Raftery reposted
Journal of Survey Statistics and Methodology@JSurvStatMeth
ICYMI! "Design- and Model-Based Approaches to Small-Area Estimation in A Low- and Middle-Income Country Context: Comparisons and Recommendations" by John Paige, Geir-Arne Fuglestat, Andrea Riebler, & Jon Wakefield @UWStat@UWBiostat@NTNUnorwaydoi.org/10.1093/jssam/smaa011
Choosing a statistical model and accounting for uncertainty about this choice are important parts of the scientific process and are required for common statistical tasks such as parameter estimation, interval estimation, statistical inference, point, and interval prediction.
One example is the choice of variables in a regression model. There are many ways of doing this, including Bayesian and penalized regression methods, and it is not clear which are best. We compare 21 popular methods via an extensive simulation study based on many real datasets.
On the need for calibration of risk assessment in predictive analytics for medicine. I strongly agree. A lot has been done in other fields, especially meteorology, starting with the Brier score (1952); see. e.g. sites.stat.washington.edu/raftery/Research/PDF/Gneiting20…. Don't reinvent the wheel!
"it is imperative to evaluate calibration using appropriate measures & visualizations – this helps us to understand how the algorithm performs in a particular setting, where predictions may go wrong"
I am honored and humbled to have got the @PopAssocAmerica's Mindel C. Sheps Award for demographic methodology. So many people contributed to the work. @tfliao sent me the link to the announcement and my remarks from 35:51 to 42:50 in www.youtube.com/watch?v=t3n7wMENHiY. Thanks, Tim!
Congratulations to the winner of this year’s Mindel C. Sheps Award for outstanding contributions to mathematical demography or demographic methodology - @AdrianRaftery1 of @UW. Thank you for your contribution! #paa2022
In my contribution to the Population Studies 75th anniversary issue, I reflect on the impacts of the digital revolution on the demographic data ecosystem 1/n
2/3 - it can be extended to hierarchical models - the smoothness (mentioned by @databozo) and lack of numerical issues when the sample size is relatively small (see paper "Bayesian bootstrap prediction" by T. Fushiki)
1/3 Various versions of bootstrap asymptotically have of course similar properties. However, some advantages of Newton & @AdrianRaftery1's Weighted Likelihood Bootstrap: - it can be extended to incorporate prior information in a meaningful way
Uncertainty About the Size of the Unauthorized Foreign-Born Population in the United States: read.dukeupress.edu/demography/article/58/6/2315/210231/U… A nice synthesis of the sources of uncertainty. Perhaps these could all be pulled together using a Bayesian approach to get posterior intervals? #statdemog
"Wastewater analysis can be a powerful public health tool—if it’s done sensibly": www.pnas.org/doi/10.1073/pnas.2119600119. One conclusion: Emphasize statistical thinking, data analysis, and data management. Many opportunities for statistical research
You have a collection of time series and you want to use them all on a new to do accurate predictions? Our solution called MAGMA (Multi-Task Gaussian Processes with Common Mean) has just been published in Machine Learning @bguedj S. Gey, A. Leroy arxiv.org/abs/2007.10731
We have analyzed the Twitter sphere related to French politics with our Linkage soft, thanks to amazing data provided by @linkfluence@gfouetil The results were plotted by @jacomyma the great! appeared online + on the printed version of @lemondefr@Univ_Paris@INSMI_CNRS@Inria
NEW: for the first time in the pandemic, a Covid infection now carries less mortality risk than a flu infection in England, the result of widespread immunity and the emergence of a less virulent variant in Omicron.
A collection of 5 articles in @PNASnews on auxiliary data for tracking COVID-19, from medical testing devices, medical insurance claims, internet search trends, app-based mobility data and online surveys: www.pnas.org/cc/beyond-cases-and-deaths
Yes, @sinafala ! Representative population surveys of Covid prevalence like this should be done routinely across the nation. Such surveys are done regularly for other things, such as unemployment (e.g. ACS) - why not for Covid? Indiana and Ohio have led the way.
Great paper just out at the @ViennaYearbook#vypr_2022 issue on #covid19. "The mathematics of the reproduction number R for Covid-19: A primer for demographers" from Rosero-Bixby and Tim Miller. A beautiful piece of how #formaldemography can be extremely creative and insightful!
Beautiful book by @a_bh for the public on the many facets and applications of mathematics. Engagingly written and superbly illustrated, with many fascinating facts that were new to me. And statistics gets its proper place ...
Formal demography peak population app. Hoping to use for Wednesday talk. Any comments/questions/suggestions very welcome. shiny.demog.berkeley.edu/josh/peak_pop/
Adrian Raftery reposted
Stuart Gietel-Basten (@stuartgb.bsky.social)@stuartbasten
Gender x redefining 'old age' x Russia x regional analysis... What's not to love?
Very happy to see our paper published in @AgingPolicy today! Pls DM me if you would like full text!
There have been a number of overview threads on the emerging variant designated as @PangoNetwork lineage B.1.1.529, @nextstrain clade 21K and @WHO Variant of Concern Omicron. I'm not going to attempt to be comprehensive here, but will highlight a few aspects of the data. 1/16
Congratulations to Shane Lubold and Hanyu Zhang for being the Z.W. Birnbaum award recipients, and Michael Pearce and Anupreet Porwal for being the Dorothy M. Gilford teaching award recipients for 2020-2021! See details: stat.uw.edu/news-resources/articles/2020-2021-zw-birnbaum…
You want to test the goodness of fit or compare bipartite networks ? Our solution just accepted in EJS arxiv.org/abs/2101.11381 with S. Ouadah and S. Robin
Cutting feedback helps with misspecification in models with multiple modules, and so does Posterior Bootstrap. Why not use them both? See our new preprint arxiv.org/abs/2110.11149 with @PierreEJacob about Posterior Bootstrap for cut models!
Our paper, "Probabilistic population forecasting: Short to very long-term," w @hanasbc just published in Int J Forecasting: authors.elsevier.com/sd/article/S0169-2070(21)00139-4 . Probabilistic population projections to 2300 for assessing the social cost of carbon.
Je fais une conférence à l'Institute Henri Poincaré à Paris le 30 septembre de 16h30 à 18h sur la Projection Probabiliste des Émissions de Carbone et de la Temperature Globale. @InHenriPoincare@MathsParis
I am looking for models of directed social networks. This literature seems so wide and disparate that it is hard to track things down. Could you paste links/citations or names??
Last day of an amazing internship experience at @Merck . We developed and validated a novel Bayesian ensemble method (IntegratedLearner) for multi-omics prediction and classification. Some key features of our approach: (1/n)
Curious if anyone had a good reference (or just reference) for what some of the biggest effect sizes we see in the health and behavioral sciences? @KMKing_Psych@ashleylwatts@lakens
New NSF blog post on SEAN, the Societal Experts Action Network of the National Academies, providing fast social science support and advice for decision-makers during the pandemic: beta.nsf.gov/science-matters/camden-south-carolina-chelse… . Proud to serve on its Executive Committee!
The record for the oldest human, set in 1997, still stands at 122 years and 164 days. These @UW statisticians expect that record will be broken by 2100.
Great thread from @NCahill_Stat on the @IPCC_CH AR6 rollout. Glad to see that the linear relationship between cumulative CO2 emissions and global warming is confirmed for CMIP 6. We found R2 up to 0.99 depending on the model for CMIP 5 - see Table 2 in www.nature.com/articles/s43247-021-00097-8.pdf
Very nice paper on stationarity (and lots more) in Mixture Transition Distribution (MTD) time series models, by Xiaotian Zheng, Athanasios Kottas and Bruno Sanso: arxiv.org/abs/2010.12696
New arXiv "JAGS, NIMBLE, Stan: a detailed comparison among Bayesian MCMC software". We assess the performance of several R packages for MCMC inference, on a wide variety of problems! w/ @AlessandraGugl9 and Daniele Falco arxiv.org/abs/2107.09357
Many of my graduate students have papers in peer review. I share this with them to help them respond to the reviewers. I remember the challenge & pressure of writing my first papers. I sincerely hope that this helps. #academicchatter#academicwriting#mentorship#proflife
Great news! A national US random seroprevalence testing survey of Covid-19 infections has been carried out. This needs to be done regularly, if possible by the US government, as part of one of the regular surveys like ACS or NHANES.
Thanks for sharing our work @EricTopol! @AdrianRaftery1 and I use the results of random sample COVID testing in Indiana and Ohio to de-bias the widely available data (cases, tests, deaths) and estimate the true number of COVID infections over time in the US. 1/3
The paper extends Weighted Likelihood Bootstrap in various ways: - to appropriately incorporate prior information - to be used for hierarchical models allowing in all cases for model #misspecification.
Our article, "Estimating SARS-CoV-2 infections from deaths, confirmed cases, tests, and random surveys" w @NicholasJIrons just published in PNAS: www.pnas.org/content/118/31/e2103272118?__cf_chl_jschl_tk… A call for regular random testing surveys, & statistically combining the main available data sources.
Podcast on how social science advances our understanding of pandemics, from @CASBSStanford . It was fun to participate with @ProfPSingh1@PeejLoewen@RobbWiller & moderator @alexismadrigal. I learned a lot. The conversation (and my comments) start at 6:00.
In the new @Elgar_SocPol Handbook on the #sociology of the Family, Tomáš Sobotka & Caroline Berghammer give a bird's-eye view of European period & cohort trends across countries between 1960-2018, including #fertility🤱🏾& family composition👨👨👦
Global migration may peak within 20 years, if incomes in the Global South catch up quickly with the rest of the world – or keep rising throughout the 21st century, if slow and unequal development prevails (Albano Rikani and Jacob Schewe @PIK_Climate). demographic-research.org/volumes/vol45/4/default.htm
#isba2021 (aka Bayes World Meeting) just finished. Some thoughts & memories on the local mirror we've organized in Marseille w/ C Robert, France @_CIRM. ⬇
1/6 The papers for @Nature's special issue on computational social science are online! The link for the collection is below; links to each paper follow: www.nature.com/collections/cadaddgige
My article, "The dip in the US birthrate isn’t a crisis, but the fall in immigration may be," just published in The Conversation. Net US migration fell by 40% from 2015 to 2019. If not reversed, this could reduce future population growth by 60%. theconversation.com/the-dip-in-the-us-birthrate-isnt-a-cr…
Estimating Covid seroprevalence using random testing. These are the least biased data for this, but only two states (IN, OH) have done random testing surveys. All other data sources are massively biased. Congratulations - this should be done by all states! arxiv.org/abs/2011.09033
Just received a copy of Carey and Roach's new book from Princeton University Press, *Biodemography: An introduction to Concepts and Methods* A gorgeous volume. I look forward to reading every page. ucanr.edu/blogs/blogcore/postdetail.cfm?postnum=39133
Really interesting & useful 100 year history of immigration reforms offered by @nytimes. So cool to read the reaction to events as they happened. Would love something similar from other newspapers to compare viewpoints & reactions. www.nytimes.com/2021/05/19/learning/explore-100-years-of-…
Virtual dialog about projecting migration w @guyabelguyabel, Jakub Bijak, @vicmgg , Helena Cruz, @cmasfl : youtu.be/gEnmE_un1zo . My part starts at 27:00. Great discussion after the presentations.
The package Greed now also allows to deal with Gaussian Mixture Models ! In short : [model selection, clustering, the building of hierarchies] in GMM with greedy optimisation
Congratulations to @CSDE_UW and @uw_sociology PhD student Crystal Yu, whose paper "The Demographic Effects of Eliminating Alzheimer’s Disease" is a #paa2021 poster award winner. Nice work everyone! @UWArtSci
This morning I ran a workshop on social media data for population researchers. We extracted Twitter data, and did some geocoding, mapping, and text analysis. All the materials and code are here for people who are interested: mjalexander.github.io/social_media_workshop/
Cozzarelli Prize finalist for @PNASnews social paper: Having more similar others nearby dampens suicide risk for marginalized groups, but increases it in counties with a larger share of some groups. An outstanding sociologist-statistician collaboration! www.pnas.org/content/117/42/26170
Cozzarelli Prize for @PNASnews social science paper: Black newborns die at three times the rate of White newborns but when Black newborns received care from Black physicians, the disparity was reduced by half. A stunning result! www.pnas.org/content/117/35/21194
New R package Greed cran.r-project.org/web/packages/greed/index.html A principal discrete optimisation strategy for clustering + model selection. Already in the package : Stochastic Block Models, degree corrected Stochastic Block Models, Mixtures of Multinomial, Latent Block Models @comeetie
Just appears in arXiv a proposal for COVINDEX, a near real-time index for monitoring the COVID-19 pandemic. The index is obtained by fitting a GAM beta regression for modelling the test positive rate as a function of time. arxiv.org/abs/2104.01344
"On current trends, the probability of staying below 2°C of warming is only 5%, but if all countries meet their nationally determined contributions and continue to reduce emissions at the same rate after 2030, it rises to 26%"
Absolutely thrilled to share the product of years of work and many people's research. Thank you @jonwakeblue for the opportunity to help lead this project + the help of everyone else in our group & at UN IGME & DHS. Data viz after the jump. data.unicef.org/resources/subnational-under-five-mortalit…
Glad to announce that our paper 'Co-clustering of evolving count matrices in pharmacovigilance with the dynamic latent block model' (Marchello et al. 2021) was accepted at ICLR 2021 – Workshop AI for Public Health !! @GiuliaMarchello@cbouveyron
It looks like (almost 30 years since Lee-Carter) here we have a new gold standard mortality model proposed by Giancarlo Camarda and @ugobas (who keeps pushing the boundaries of cool #rstats#base plotting) My bet: this model will be known as CB, not 3C-sLC doi.org/10.1007/s10680-021-09582-4
The discrepancy between climate models and satellite observations of tropical atmospheric warming is likely due to natural climate variability. In PNAS: www.pnas.org/content/118/13/e2020962118
Our new paper to appear in ADAC arxiv.org/abs/2002.11577 with @comeetie@cbouveyron N. Jouvin. Works for most discrete latent variable models (GMM, SBM, LBM,..). Discrete optimisation strategy for joint clustering and mod selec. + allows to build hierarchies of clusters
Forecasting of cohort fertility under a hierarchical Bayesian approach, by Joanne Ellison, E. Dodd & J.J. Forster: rss.onlinelibrary.wiley.com/doi/abs/10.1111/rssa.12566?ca… "Our findings support the position of hierarchical Bayesian modelling at the forefront of population forecasting methods." YES!
An appreciation of David Blackwell, 1919-2010, distinguished statistician and first Black member of the National Academy of Sciences, by Peter Bickel: www.pnas.org/content/117/47/29257?etoc=
Choosing the geometry in latent space models for networks: Euclidean, spherical or hyperbolic? by Shane Lubold, A. Chandrasekhar & @tylermccormick : arxiv.org/pdf/2012.10559.pdf
A polynomial algorithm for the best-subset selection problem such that: 1) its computational complexity is polynomial; 2) it can recover the true subset; and 3) its solution is globally optimal. www.pnas.org/content/117/52/33117.abstract?etoc
A dynamic factor model approach to incorporate Big Data in state space models for official statistics: rss.onlinelibrary.wiley.com/doi/full/10.1111/rssa.12626?c… This is being used by Statistics Netherlands to estimate unemployment. Congratulations!
An argument for the use (even informal) of decision theory for policy-making during a pandemic: www.pnas.org/content/118/4/e2012704118.abstract?etoc I like the emphasis on informality: agreement on utilities or losses of incommensurate things (e.g. life, money, happiness) is hard to get
Bayesian estimation of SARS-CoV-2 prevalence in Indiana by random testing: www.pnas.org/content/118/5/e2013906118.abstract?etoc Important article that shows how the biases in prevalence estimation can be reduced by random testing. All states, and the US, should follow Indiana's lead on this.
An argument that social science is entering a golden age, marked by new data, analytic methods and interdisciplinary approaches: www.pnas.org/content/118/5/e2002923118.abstract?etoc Interesting review, but it understates the role of statistics in achieving the synthesis.
A primer on excess deaths as a measure of Covid-19 mortality: rss.onlinelibrary.wiley.com/doi/10.1111/1740-9713.01485 We found they give a reasonable indication of aggregate mortality, but are variable for shorter periods and smaller areas, e.g. excess deaths are often negative.
Use of model reparametrization to improve variational Bayes in hierarchical models, by Linda S. L. Tan. A transformation is proposed to reduce posterior correlation between random effects and hyperparameters: rss.onlinelibrary.wiley.com/doi/abs/10.1111/rssb.12399?ca…
The quantity of education has been rising globally, but so has inequality in the quality of education, by Wolfgang Lutz & others, who also propose a new measure: skills in literacy adjusted mean years of schooling (SLAMYS): www.pnas.org/content/118/7/e2015826118.abstract?etoc
An argument for addressing reproducibility and replicability in science by accumulating evidence over multiple studies, rather than just in single studies: www.pnas.org/content/118/7/e2100769118?etoc=
Adaptive MCMC for Bayesian variable selection in very high dimensions, by Mark Steel & others: "speed-ups of up to four orders of magnitude are observed". academic.oup.com/biomet/article/108/1/53/5918057
New paper on arXiv: "Estimating SARS-CoV-2 Infections from Deaths, Confirmed Cases, Tests, and Random Surveys" w Nick Irons: arxiv.org/abs/2102.10741 1/4
Results for USA to Feb 25: - Cumulative undercount factor: 2.2. - Initial undercount (to April 15, 2020): 11.1. - Cumulative incidence 18.4% of population (61M) - current reproductive rate R: 0.87 - decline of infections since peak of cases on Jan 8: 70% 4/4
Dashboard showing estimated new infections for each day, current infection rate, % of the population ever infected, reproductive number, and undercount for all states: rsc.stat.washington.edu/covid-dashboard/ 5/4
I wrote about two important studies on the Paris climate agreement:
One says >8 million lives can be saved from health-related issues by 2040 if warming is limited to 2°C; the other says emission reductions need to be at least 80% faster to get there. academictimes.com/paris-climate-accord-would-save-million…
Stacking improves model averaging. A Bayesian hierarchical model improves stacking. Thanks for this new paper and helpful idea, Yuling Yao, Gregor Pirš, Aki Vehtari, Andrew Gelman! arxiv.org/abs/2101.08954
The top 1% of the most-cited researchers have increased their cumulative citation shares from 14% to 21% between 2000 and 2015, suggesting that global citation inequality is on the rise. In PNAS: www.pnas.org/content/118/7/e2012208118
New preprint with @LeontineAlkema, proposing a Bayesian cohort component model for subnational populations in data-sparse settings: arxiv.org/abs/2102.06121
If you don't know the story of @youyanggu, the remarkable 27-year-old data scientist who did some of the best modeling and most accurate projections throughout the pandemic, and is still at it for vaccines/herd immunity, here's our conversation www.medscape.com/viewarticle/944778@Medscape
Excellent (and disheartening) graphic (with more from @DarganF where that came from). So fossil fuels have increased as a proportion of the total, and almost doubled over 1995-2018? And (zero-carbon) nuclear has almost halved. At least renewables have gone from almost zero to 7%.
#pdrjournal just published an impressive collection of complementary perspectives on the implications of Covid-19 for demographic research. In my note I argue that the epidemic has accelerated existing trends in population studies (a thread)
So sad to just learn that Rob Mare of UCLA, a giant in demography and methodology, just passed away from cancer, per his demographer wife, Judith Seltzer, who was with him.
Quadratic discriminant analysis is a supervised classification method computing a maximum likelihood for Gaussian models. Linear discriminant analysis is the special case where the covariances are equal, and corresponds to the computation of Voronoi cells. en.wikipedia.org/wiki/Linear_discriminant_analysis
Migration definitions are somewhat arbitrary. Life table methods, combined with highly granular digital trace data, hold the key to understanding the relationship between short-term mobility and long-term relocations.
Now that 2020 is over we have a clearer picture on how much covid19 has affected countries' longevity during this year. I - as usual - take data from @HMDatabase Note that for some countries (e.g. ITA, CAN) data is still incomplete, so life expectancy can drop even more (1/N)
Thx @NialFriel for reference to this classic paper on league tables: www.bristol.ac.uk/media-library/sites/cmm/migrated/docume… Resource for teaching hierarchical models. Great discussion with practitioners & statisticians. One caveat: the statisticians didn't pay enough attention to how to communicate the results
2nd level school league tables published today in @IrishTimes Why do newspapers persist with this? Numerous issues with presenting raw % of progression to 3rd level as a rank. Is this more to satisfy the appetite of the public rather than serving some useful educational purpose?
The empirical distribution of regression coefficients: one million z-values. Also contains a set of 732 z-values for variables from models without variable selection. arxiv.org/pdf/2009.09440.pdf
A friend gave our toddler an 'E is for Economics' book so I decided to make a 'D is for Demography' book. The pdf and code to make the book is here: github.com/MJAlexander/d_is_for_demography
For those interested in Bayesian Computation, my friends Gael Martin and Christian Robert and I have just revised our history of Bayesian Computation paper: arxiv.org/abs/2004.06425. The paper should be very helpful for those who are interested in Bayes but unsure where to start!
Social media and mobile phone-based data could be more effective than air travel and annual census-based estimates to assess population changes in disaster-affected areas in the wake of a natural disaster, a study finds. In PNAS: www.pnas.org/content/early/2020/12/07/2001671117
Stuart Gietel-Basten (@stuartgb.bsky.social)@stuartbasten
Our* #gbd letter to the Lancet is discussed in an article in @thenation by @TimothyWSchwab. Still no word on publication (or even evaluation) from @TheLancet.
Interested in Graduate Studies in Statistics? Our Ph.D. students will be hosting a virtual conversation and Q&A on Monday, November 9, 2020 at 4:00 PM (PST). See details here: stat.uw.edu/news-resources/articles/statistics-will-be-ho…
Our article w @daphnehliu, "How Do Education and Family Planning Accelerate Fertility Decline?" now free: www.ncbi.nlm.nih.gov/pmc/articles/PMC7590131/ Effect of education 1. is smaller than of family planning; 2. is biggest at the lower secondary level; 3. is thru mother's education, not children's
Predicting and estimating age specific mortality levels is not always an easy task. In our newly published article in #risks innovative techniques based of life expectancy are explored. It's a privilege to collaborate with @jm_aburto@ugobas and Vladimir C-R of @Demography_ANU
Yes, the Single Transferable Vote (STV) system with multiple seats, everyone's vote counts, even if they're not in the majority. Unlike with the US and UK first-past-the-post system, where many never have a representative they voted for.
Katie Wilson's paper on combining summary and full birth history data for subnational under 5 mortality estimation, using a full probabilistic model, is out: onlinelibrary.wiley.com/doi/abs/10.1111/biom.13383
Mobile phones, digital inequality, and fertility: Longitudinal evidence from Malawi, by @FCBillari et al: "Bridging the digital divide may hasten the fertility transition in sub-Saharan Africa." www.demographic-research.org/volumes/vol42/37/
On spike and slab empirical Bayes multiple testing, by I. Castillo & E. Roquain: Shows that empirical Bayes-calibrated spike and slab posterior distributions yield correct false discovery rate (FDR) under sparsity. projecteuclid.org/euclid.aos/1600480923
When is fertility too low or too high? Population policy preferences of demographers. More willing to intervene: those who are concerned about carrying capacity, living in high-fertility countries, or more conservative. www.tandfonline.com/doi/full/10.1080/00324728.2020.1784986
Quasi‐Bayes properties of a procedure for sequential learning in mixture models, by S. Fortini & S. Petrone: Bayesian methods are often optimal but slow, so faster suboptimal methods are used. To what extent do they approximate Bayesian solutions? rss.onlinelibrary.wiley.com/doi/abs/10.1111/rssb.12385?ca…
Covid mortality, by @jrgoldstein1 & Ron Lee: An epidemic claiming 1M US lives would reduce life expectancy by 3 years and cost > $6 trillion. Similar in scale to the HIV/AIDS and opioid-overdose epidemics but concentrated over months rather than decades: www.pnas.org/content/117/36/22035.abstract?etoc
Population age structure only partially explains the large number of COVID-19 deaths at the oldest ages, by Anthony Medford & S Trias-Llimós: Comparison of Covid-19 mortality in 6 European countries. www.demographic-research.org/volumes/vol43/19/
Comparison of Bayesian predictive methods for model selection: "From a predictive viewpoint, best results are obtained by accounting for model uncertainty by forming the full encompassing model, such as the Bayesian model averaging (BMA) solution over the candidate models."
Checkout our new global demographics portal: www.portal.worldpop.org/demographics/. Explore global subnational population pyramid estimates for 2000-2020 and overlay gridded population count data.
📢Latest on the #stmf series on excess #mortality 🌏 Korea & New Zealand on board 🇩🇪 Germany now avail by sex & +ages 👉input 📅 2020 weeks revised & updated
Matthew Salganik | @msalganik.bsky.social@msalganik
All the teaching materials from the Summer Institutes in Computational Social Science are freely available including slides, code, and videos of lectures. You are welcome to use them for self-study or teaching. @chris_bailsicss.io/curriculum
Covid-19 random sampling prevalence study in Ohio; see 22:40 in the video. Results for July 9-28: n=727. Active Covid 0.9%, CI [0.1,2.0]. Antibodies: 1.5%, CI [0.3,2.9]. Second state to do this, after Indiana. Congratulations! Every state should do this.
New Bayesian population model estimates with uncertainty metrics for Ghana available to view at: apps.worldpop.org/woprVision/ and download from our open population repository: wopr.worldpop.org
Good discussion of ways of estimating Covid deaths. Pros and cons of reported deaths and excess mortality. There is no one perfect method. @sinafala@AndrewNoymer
The Cohort 2020-21 of the European Doctoral School of Demography started their program today. 20 emerging demographers from all over the world are gathering online to form the EDSD Cohort 16. We wish you all the best of luck and exciting 11 months of studying!
I wrote out 3 statistical concerns about the @IHME_UW#gbdstudy fertility forecasts, focusing on the use of met need for contraceptives as a predictor. 1/
Before PCA (i.e SVD), I preprocess with three principals: 1) sqrt any features that are counts. log any feature with a heavy tail. 2) localization is noise. *regularize* when you normalize. 3) and my favorite rule, the Cheshire cat rule
Folks who do a lot more matrix factorization (e.g. SVD) than I do, are there good principles for choosing how to scale the input data? The results are so sensitive to this choice and I pretty much always feel like I'm making educated guesses. cc @karlrohe@daniela_witten
I wanted to discuss the degree to which population immunity may be contributing to curbing #covid19 in Florida, Arizona and Texas, where recent surges have resulted in substantial epidemics. 1/16
New "DemogBlog" post by Ron Lee on formal demography of Covid-19 infection-fatality rate by age: demogblog.org/covid-19-infection-fatality-rate-by-ag/ $$ c(x) = c [ m(x) / m] $$ gives estimates of 10% for age 85+, 3% for 75-84, and < 1/1000 for ages under 45.
JSM session 400: Bayesian Model Selection & Variable Selection in (non)linear models. Wed Aug 5 @ 1pm EDT (onine). Presenters @AdrianRaftery1 (high-dim BMA for gene networks), Li Ma (microbiome), Ming Wang (process optimization), Debdeep Pati (astronomy). ww2.amstat.org/meetings/jsm/2020/onlineprogram/ActivityDe…
"The best digital theory-building of the past decade stems from social and computational origins. As such, it is increasingly apparent that digital sociologists need to develop a computational as well as a sociological imagination" -@Neil_Selwyn: blogs.lse.ac.uk/lsereviewofbooks/2020/06/15/book-review-w…
For Samoa TFR, @IHME_UW got it wrong because they were fooled by one bad observation. UN Pop Division got it right because they know the data. Our new paper projecteuclid.org/euclid.aoas/1593449321 w @peiran_liu automatically adjusts for bias and measurement error and also got it right.
This shows the disadvantage of trying to do population projections when one doesn't know about the underlying data. The UN Population Division knows the data inside out, which is one reason why their projections have performed so well for decades.
Not always the best idea to use Gaussian process regression without thinking about the outcome you're modeling: the fertility in Samoa story
Adrian Raftery reposted
Stuart Gietel-Basten (@stuartgb.bsky.social)@stuartbasten
I admit I don't know as much as I should about 🇼🇸, but I think I know enough about demography and fertility transition to get a feeling for which one of these trajectories of total fertility rate I would feel more comfortable with.
Our new article, "How Do Education and Family Planning Accelerate Fertility Decline?", w Daphne Liu, just out (Open Access) in Population and Development Review: onlinelibrary.wiley.com/doi/full/10.1111/padr.12347
Three takeaways: 1. Women's attainment of lower secondary education is key to accelerating fertility decline, and the prevalence of modern contraceptive methods has an accelerating effect.
So yesterday I asked you all what you wanted to hear about from me this week, and one answer stood out from all the others: the SINGULAR VALUE DECOMPOSITION (SVD).
The UN's global population projections since 1950 have performed extremely well. Since 2015, the UN has also been issuing probabilistic forecasts, which are similarly well calibrated so far. A great track record!
Our paper “Reconstruction of full transmission dynamics of COVID-19 in Wuhan” is online in Nature. We showed two key features of COVID: High transmissibility (R0=3.5) & high covertness(up to 87% undetected cases), estimated the chance of resurgence(1/n) www.nature.com/articles/s41586-020-2554-8
A fascinating paper on the history, the present, and the future of statistical software #rstats by John Chambers "S, R, and data science" | Proceedings of the ACM on Programming Languages dl.acm.org/doi/10.1145/3386334
Adrian Raftery reposted
Stuart Gietel-Basten (@stuartgb.bsky.social)@stuartbasten
Yesterday, I shared a few thoughts on the *coverage* of the new #gbd future #population estimates.
Now, I want to spend some time thinking more about their numbers and how GBD present them. SPOILER: I think they are being a bit disingenuous.
Credit and deep gratitude go to @monjalexander, long-term collaborator and lead author of the scientific article, @kpolimis, and the Communication Team @MPIDR.
The English version of Max Planck Society's Yearbook is published. A study of our Director @ezagheni on the use of Facebook data to analyze migration is featured in the highlights section. Enjoy reading! www.mpg.de/14925216/yearbook-highlights-2019.pdf
Short-term social distancing might not substantially reduce the total number of #covid19 infections if it is relaxed before a vaccine or effective antiviral therapies are introduced, a study finds. In PNAS: www.pnas.org/content/early/2020/07/01/2006520117
"A Matter of Taste," a book Stanley Lieberson wrote partially as a 1995-96 CASBS fellow, is "a gift to social science," writes 1999-00 CASBS fellow Harvey Molotch.
Unmitigated climate change will increase mortality but what will it do to life expectancy? @AppDemography and I looked at 31 European countries and found climate change could reduce life expectancy at birth by up to 0.24 years in Europe!
At the #covid19 Forecast Hub, we continue to monitor and aggregate forecasts from over 30 teams who are working hard trying to create accurate forecasts of the coming weeks and months in the US.
THINK LIKE AN EPIDEMIOLOGIST: There are more new confirmed cases each day in the US than at any time during the earlier April peak. But is it really meaningful to compare those numbers? How do epidemiologists decide when to sound the alarm? A thread. 1/11
Nice interview (in French) of Xian Robert by @GillesCeleux A few things I've learned - he gained his "P" in Christian P Robert in the US - Gouriéroux advocating Bayes as inapplicable in the 80s - Berger in "Casella & Berger" stat book isn't Jim statistique-et-societe.fr/article/view/772/819
Our new article just published: "Accounting for uncertainty about past values in probabilistic projections of the total fertility rate for most countries" w @peiran_liuprojecteuclid.org/euclid.aoas/1593449321
New published paper: "Clustering of count data through a mixture of multinomial PCA", to appear in Computational Statistics (hal.archives-ouvertes.fr/hal-02278224). Congrats N. Jouvin for this first published article!🍾
A big group effort led by Katie Gostic, Lauren McGough, and @sarahcobey - hope useful to the many of us trying to do this well. Practical considerations for measuring the effective reproductive number, Rt www.medrxiv.org/content/10.1101/2020.06.18.20134858v1
Every week, I along with other researchers/modelers gather in a conference call to discuss the current state of forecasting, give presentations, and share ideas.
One group always absent? IHME.
They are not representative of the scientific community.
Congratulations to @HannahDirector, who passed her PhD final exam with a great talk on “Space-Time Contour Models for Sea Ice Forecasting”! Co-advised by @drseaice, with committee members Don Percival & @ProfessorLuAnne
Since January, I've striven to provide as complete an accounting of the #covid19 pandemic as I can. And so I feel it is my job as a scientist to provide my best estimate of the amount of viral transmission the protests are likely to cause. 2/21
Remarkable special issue of the journal Survey Research Methods on Covid-19, w 23 articles & discussion. Relevant to estimating prevalence and incidence for decision-making. Representative sampling is vital and many current methods suffer from selection bias. How to move forward?
New special issue of Survey Research Methods talking about need for high quality data collection and analyses. Surveys, app-based data collection, diff in diff, and more! ojs.ub.uni-konstanz.de/srm/issue/view/221
Monte Carlo Bayesian inference for Big Data: "Quasi-stationary Monte Carlo and theScaLE Algorithm", by Murray Pollock, Paul Fearnhead, Adam Johansen & Gareth Roberts: arxiv.org/pdf/1609.03436.pdf. To be read at the Royal Statistical Society on June 24.
NIH is starting a national antibody study to estimate Covid-19 cumulative incidence: www.nih.gov/news-events/news-releases/nih-begins-study-qu… . However, it seems that it will be a convenience sample of volunteers, which is not guaranteed to be representative, unlike the Indiana study.
Different samples and different tests - but remarkably consistent with what we know about the size of the outbreaks and the success of the lockdowns. The World Is Still Far From Herd Immunity for Coronavirus www.nytimes.com/interactive/2020/05/28/upshot/coronavirus…
If you're seeing these models for the first time, check out the useful and readable breakdown of some of the individual models from @FiveThirtyEight by @jayboice and @ryanabest.
For folks who haven't had enough of my bad takes, here's an essay on "rejection" in academia. It's personal, though I hope someone will find it helpful. Good luck out there.
High Tide for Digital and Computational Demography: so much sharing in the last few days. Here are some pointers to a few papers and pre-prints. Please add what I missed…
While no model is perfect, it does three things a bit differently: (1) goes to extensive lengths to fit a sensible parametric model to observed data (both medical and mobility);
CDC tracks 12 different forecasting models of possible #covid19 deaths in the US. As of May 11, all forecast an increase in deaths in the coming weeks and a cumulative total exceeding 100,000 by June 1. See national & state forecasts: www.cdc.gov/coronavirus/2019-ncov/covid-data/forecasting-…
"There isn't a scenario where global concentrations of CO2 do not increase this year." Even if we stop all emissions today, "it would take decades for the atmospheric concentrations to return to normal."
Here is the weekly update from COVID Forecast Hub, where we are storing forecasts of #covid19 deaths in the US from 20 research groups. Our national ensemble combines 7 models and predicts that we will see ~113K deaths by June 6 (80% PI: 104K-123K). reichlab.io/covid19-forecast-hub/
We now have enough #sarscov2 genomic data from different states to make some broad conclusions about how the #covid19 epidemic has unfolded in the US. 1/14
Today, April 24, US will surpass 50,000 deaths, as we projected 4 days ago. A 4-day prediction is not difficult, yet IHME got it wrong. Here is our updated projection:
60,000: April 28 | IHME: May 2 70,000: May 3 | IHME: Never 80,000: May 9 | IHME: Never
This article is better than its headline (can we just stop the antiquated tradition of letting late-night copyeditors write the titles that may be all anyone reads of our long articles that we labor over?), "Models vs. Evidence". bostonreview.net/science-nature/jonathan-fuller-models-v-…
Just posted an article summarizing our effort to evaluate transparency, reproducibility and validity of COVID-19 models. Tremendous efforts led by grad students and post-docs @KunduPro@YiWang83714172@RuzhangZhao Jin Jin and Neha Agarwala.
I know all the discussion is about a possible "2nd wave", but I've found this odd given that we haven't finished the first one. I would think quite possible that, nationally, we're in for a scenario of a long plateau. 1/10
We are continuing to curate forecasts of #covid19 deaths in the US from multiple teams. Our current national-level ensemble combines three models and forecasts ~90K cumulative deaths by May 23 (80% PI: 82K-104K). reichlab.io/covid19-forecast-hub/ 1/6
Bayesian model averaging mitigates double descent! We have just posted this new result in section 7 of our paper on Bayesian deep learning with @Pavel_Izmailov: arxiv.org/abs/2002.08791. The result highlights the importance of *multi-modal* marginalization with Multi-SWAG. 1/3
Congratulations to @DrJessPearson, Christopher B. Ruff, Evan M. Garofalo, Emmy Bocaege, Barbara J. Betz, Irene Dori, and Bonnie Glencross, the recipients of the 2019 PNAS Cozzarelli Prize in Behavioral and Social Sciences. Learn more at www.pnas.org/page/about/cozzarelli-prize
Given my statement that the US has 300k - 600k new infections per day, I've had a bunch of responses telling me that #testtraceisolate is futile and we should give up on it. This thread demonstrates the benefits of reducing transmission even if suppression is not attainable. 1/9
Question for those in the know re recent serosurveys in NYS and elsewhere: are folks trying to estimate the % of asymptomatic infections at all from these surveys? If so, are they using questionnaires to try and get a history of symptoms? #covid19
A thread on the measurement of excess mortality and uncounted COVID19 deaths. Key point: be careful inferring number of uncounted COVID19 deaths from a look at all-cause mortality data 1/n
There are some good critiques of the IHME model in here IMO but this line bothered me. Model outputs *should* change in response to new data and when you're dealing with nonlinear systems, small changes can have a reasonably large effect. www.statnews.com/2020/04/17/influential-covid-19-model-us…
A brief thread on the constellation of #covid19 models out there. Early on in the epidemic, I started a spreadsheet on various estimates of R0, mostly using branching processes, as the epidemic was undergoing exponential growth docs.google.com/spreadsheets/d/1QP5vM62ctnMRYdkQ4J5IqaOmB…
Our paper "Estimating and forecasting the smoking-attributable mortality fraction for both genders jointly in over 60 countries" w Yicheng Li, just published in Annals of Applied Statistics: projecteuclid.org/euclid.aoas/1587002679
I've done some spot-checking of forecast accuracy of a few of the US models, and am planning a more thorough analysis of models that have been put out by @IHME_UW@Columbia@LosAlamosNatLab@alexvespi@MRC_Outbreak and others. 2/
The latest #covid19 forecasts from @IHME_UW continue to mystify me. Models should have more certainty about things that will happen in the short term and less in the long term. The latest forecasts defy this basic logic.
For those new to @IHME_UW's work, it may be helpful to explain why IHME's #covid19 model is highly reminiscent of Global Burden of Disease frustrations.
This #epitwitter dissection of the IHME COVID19 model is a) extremely useful, and b) highly reminiscent of many many many frustrated viewpoints and letters about estimates from the Global Burden of Disease study.
This blog post by @SamuelJenness is excellent. It describes mathematical modeling for infectious diseases epidemiology clearly & concisely. Trying to understand what all these models are? Read this:
Interview with Noel Cressie: "I was a mathematical statistician who learnedto start worrying about uncertainty and love Bayes’theorem, and they all played a role in my becominga statistical scientist." projecteuclid.org/euclid.ss/1563501646
Guidance on P-values, etc., from the Editor of Demographic Research, Jakub Bijak: www.demographic-research.org/volumes/vol41/32/ A lot of good advice. I wouldn't discourage the display of P-values as strongly, as people have learned to interpret them, but this is wise and balanced advice overall.
Bayesian choice of the number of components in a mixture model using non-local priors: rss.onlinelibrary.wiley.com/doi/abs/10.1111/rssb.12333?ca… I like the idea of non-local priors. It has a lot of potential. Glad to see this paper that moves towards addressing the practical issues in a specific context.
Using an Online Sample to Estimate the Size of an Offline Population, by @dennisfeehan & Curtis Cobb. They show that by sampling people who are online, researchers can learn about both people who are online and people who are offline too. Clever idea! link.springer.com/article/10.1007/s13524-019-00840-z
The PNAS editor-in-chief on words and language in scientific writing: www.pnas.org/content/117/1/4?etoc= Well worth reading on a much-ignored topic, by someone who cares - and writes well!
Combining likelihood and significance functions, by Donald Fraser & Nancy Reid: pdfs.semanticscholar.org/7940/7be9a41b2507a586133988aa990… A non-Bayesian approach to combining sources of information about a parameter using asymptotic analysis of the score variables.
"Strong model dependence in statistical analysis: goodness of fit is not enough for model choice," by John Copas & Shinto Eguchi. Discusses model averaging as one solution. link.springer.com/article/10.1007/s10463-018-0691-8
A survey of some of the statistical challenges in climate science, by one of the leaders in the field, MIchael Stein: projecteuclid.org/euclid.ss/1583226027
Thought about adding something on the dynamics of epidemics to my annual formal demography/ pop dynamics / stable pop theory course. Any suggestions for a good intro/textbook? (Do you have any ideas @AndrewNoymer ?) #rstats examples welcome. Thx in advance!
Great point, @AndrewNoymer. The case fatality ratio (CFR) isn't comparable between countries with different age structures. Age-specific ratios can be the same at every age, but the CFRs different if age structure different. Age-adjusted CFR discussed by www.medrxiv.org/content/10.1101/2020.03.04.20031104v1
An update about what we're able to infer about the Washington State #covid19 outbreak from screening and viral sequencing by @UWVirology and @seattleflustudy. 1/12
I will give a 2-week summer course on Statistical Demography in Beijing at @PKU1898, July 6-17, with Junni Zhang & Ting Li, in the @PKU1898 - @UMich Summer Program, co-organized by @YuXie3. Registration will open in March.
The planned Statistical Demography course in Beijing in July 2020 has been postponed due to the Covid-19 situation. It is tentatively planned to give it in July 2021 instead. Stay tuned!
wppExplorer for the UN's World Population Prospects 2019 revision has been enhanced and moved. New: previous WPP revisions (from the left panel) 2012, 2015 and 2017. bayespop.shinyapps.io/wpp2019explorer/
Model-based clustering with measurement error with known covariances, e.g. when objects to be clustered are summary statistics, such as regression estimates. Open access, by Wanli Zhang & @diydatascience
Bayesian methods are *especially* compelling for deep neural networks. The key distinguishing property of a Bayesian approach is marginalization instead of optimization, not the prior, or Bayes rule. This difference will be greatest for underspecified models like DNNs. 1/18
"The inadequacy and lack of comparability of migration statistics have been realized for a long time" (United Nations, Problems of migration statistics, 1949). Well... Yet to be solved...


 Adrian Raftery
@AdrianRaftery1

 Demography Journal
@ReadDemography


 Steven N. Durlauf

 Andy Hall


 Jitong Jiang
 PAA
 COPSS

 Probability and Statistics
 Kareem Carr, Ph.D.


 Colm Mulcahy

 Dean Blundell🇨🇦


 Berkeley Population Sciences

 Royal Statistical Society

 Karl Rohe


 Claudia Masferrer


 Census State Data Centers
 Robin Ryder
 Nick Irons

 Guy Abel 鄭蓋堡


 UW Statistics


 Rohan Alexander
 ASA History of Statistics Special Interest Group


 Ined

 Alison Gemmill

 Leverhulme Centre for Demographic Science
 Hannah Ritchie

 Monica Alexander

 CASBS


 Psychometric Society




 Population Council

 Damian Carrington

 Demographic Research
 Jessica Godwin
 Rebecca Sear
 Michele Guindani 🇺🇦 (@mguindani.bsky.social)
 Yu Xie
 Florencia Torche
 Latouche Pierre


 The Mary Raftery Prize






 Simon Kuestenmacher


 Dylan Connor


 Daniel D. Gutierrez


 Luca Scrucca
 Rob Calver

 Dilek Yildiz

 Centre Inria d'Université Côte d'Azur

 Martyn Plummer

 Ugofilippo Basellini
 Jon Wakefield
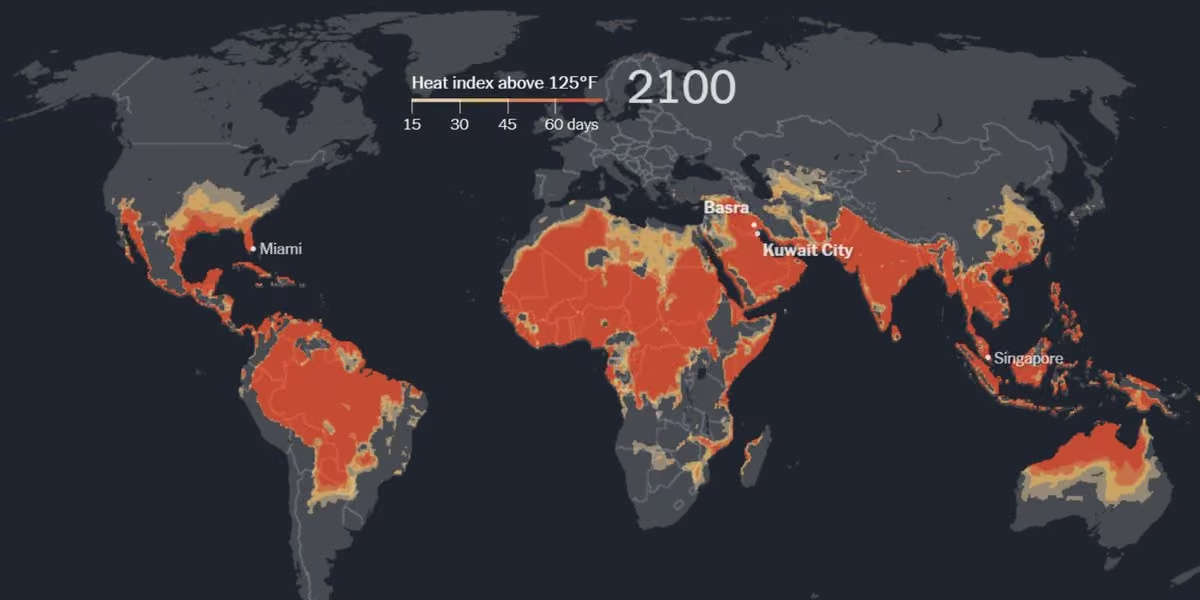
 Fang Han

 Anupreet Porwal
 Judea Pearl

 Olivier Gimenez 🖖🦦


 hannah_comiskey


 Leontine Alkema
 UW CSSS

 Frank Errickson

 EU_asylum_aware


 Tim Liao
 Erik van Zwet
 Stats & Data Science Views
 Csaba G. Tóth


 UW Biostatistics


 Emilio Zagheni
 CSDE UW

 Miguel González-Leonardo
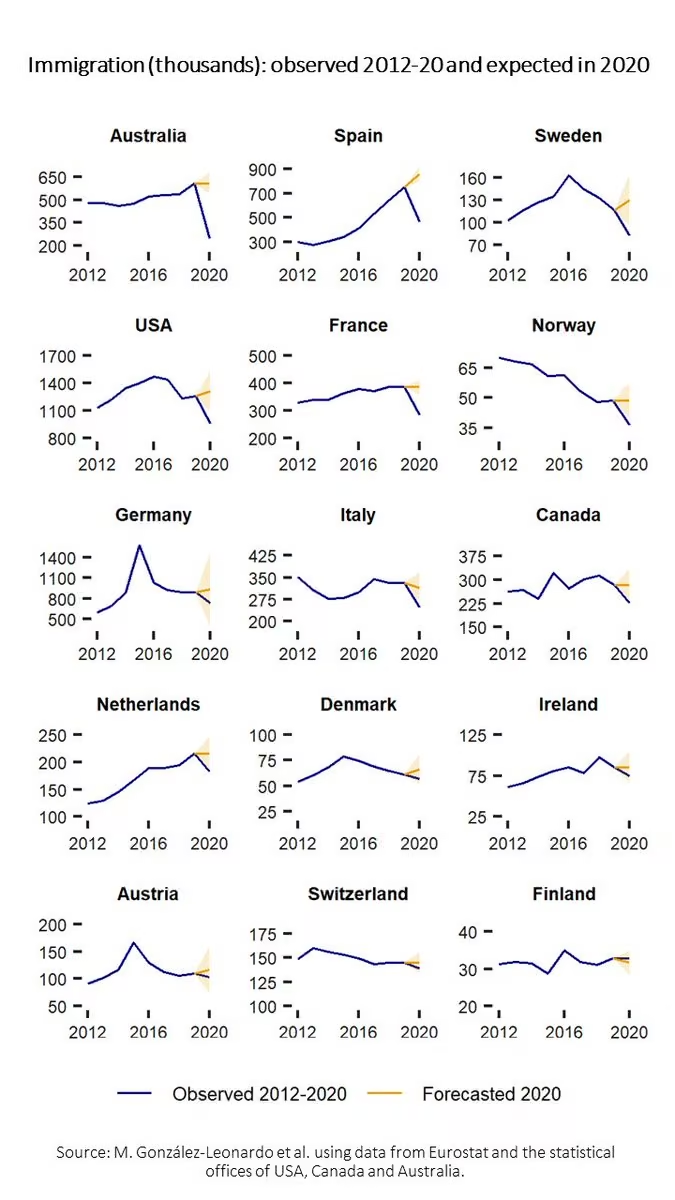
 @Steven Ruggles


 Sahil Bloom
 Patrick Heuveline
 Edouard Mathieu


 Zain Kahn
 Prof. Noel O'Connor (he/him)
 Insight Research Ireland Centre

 Hannah Hickey
 The Seattle Times
 Vegard Skirbekk
 Frank Nielsen

 Giulia Marchello


 Journal of Survey Statistics and Methodology

 Gary Collins

 Zack Almquist


 Ridhi Kashyap
 Emilia Pompe
 Simon Frost

 John Burn-Murdoch

 Dr. Arielle Kuperberg

 Statistics at Chalmers and Gothenburg University

 Brendan Murphy


 Stéphane Helleringer
 vdilego
 Michael Pearce
 Joshua R. Goldstein
 Stuart Gietel-Basten (@stuartgb.bsky.social)

 Trevor Bedford
 Nice_Matin Eco


 Charles Bouveyron


 UW College of Arts & Sciences


 Doug Steinley

 UW News
 Mario Beraha
 Michael Pyrcz🌻

 Atomsk's Sanakan
 Eric Topol


 Julyan Arbel

 Mary Elizabeth
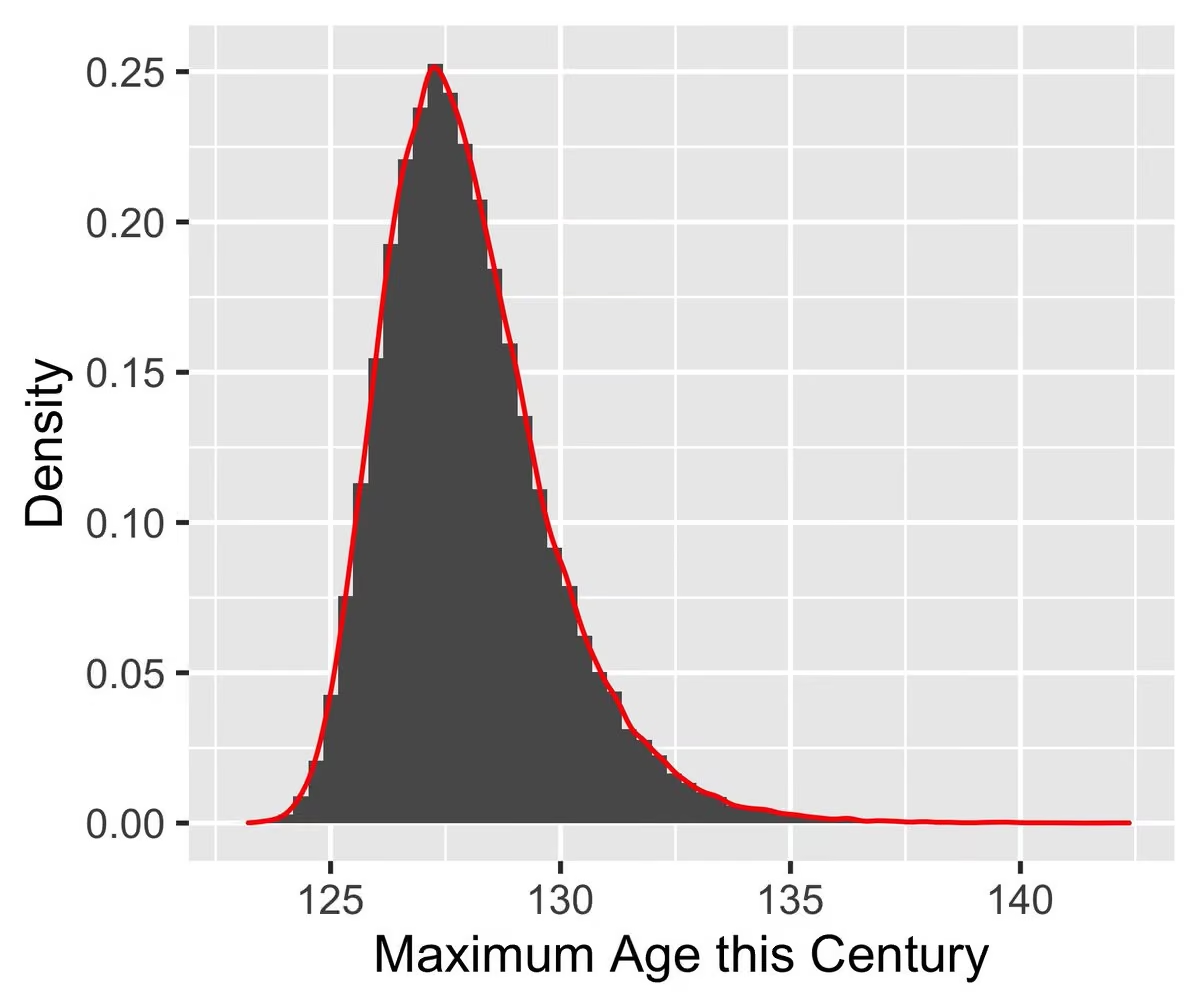
 WorldPopProject

 Levi Pulkkinen


 Zeke Hernandez

 University of Washington Sociology
 Scarlet Fu


 Orla Feely


 Marco Corneli
 Ilya Kashnitsky — bsky @ikashnitsky.phd


 Philip N Cohen


 D.H Mekni
 Ronald Richman
 The COVID Tracking Project
 Zack Fishman

 asa_methodology


 Francesco Bartolucci
 Maarten van Smeden
 Paula England

 Caitlin Rivers

 Gabriel Peyré
 Kirill Andreev
 Christopher Yau
 Stefano Mazzuco
 Nial Friel


 QuantMig H2020 Project


 David T. Frazier


 Youyang Gu


 Marius D. Pascariu

 Marcia Castro
 Aubrey Clayton


 Andrew Noymer 🇺🇦

 Human Mortality Database

 Matthew Salganik | @msalganik.bsky.social


 ISBA

 Sean J. Taylor


 Women in Statistics and Data Science
 Suzana Cavenaghi

 AleCarioli
 JAMA


 Isabella Gollini


 Matt Hauer

 Nicholas G. Reich

 Natalie E. Dean, PhD


 Marc Lipsitch


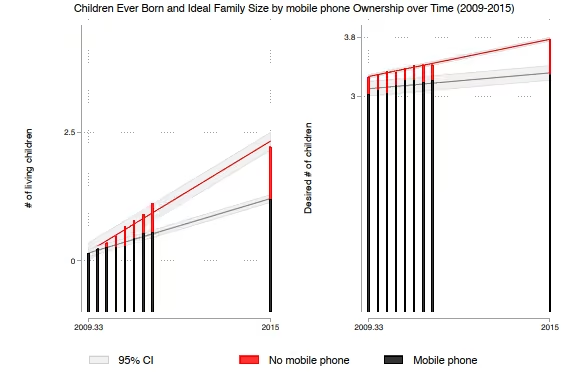
 Peter Lynch
 Alessandro Vespignani

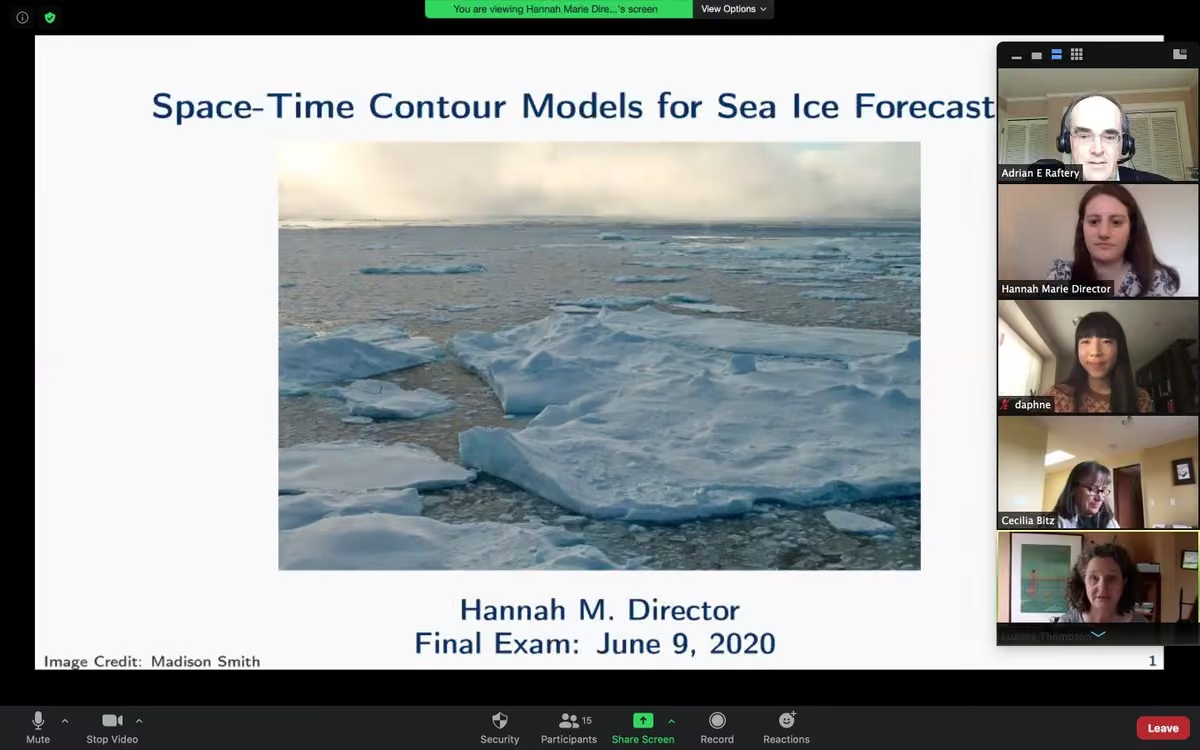
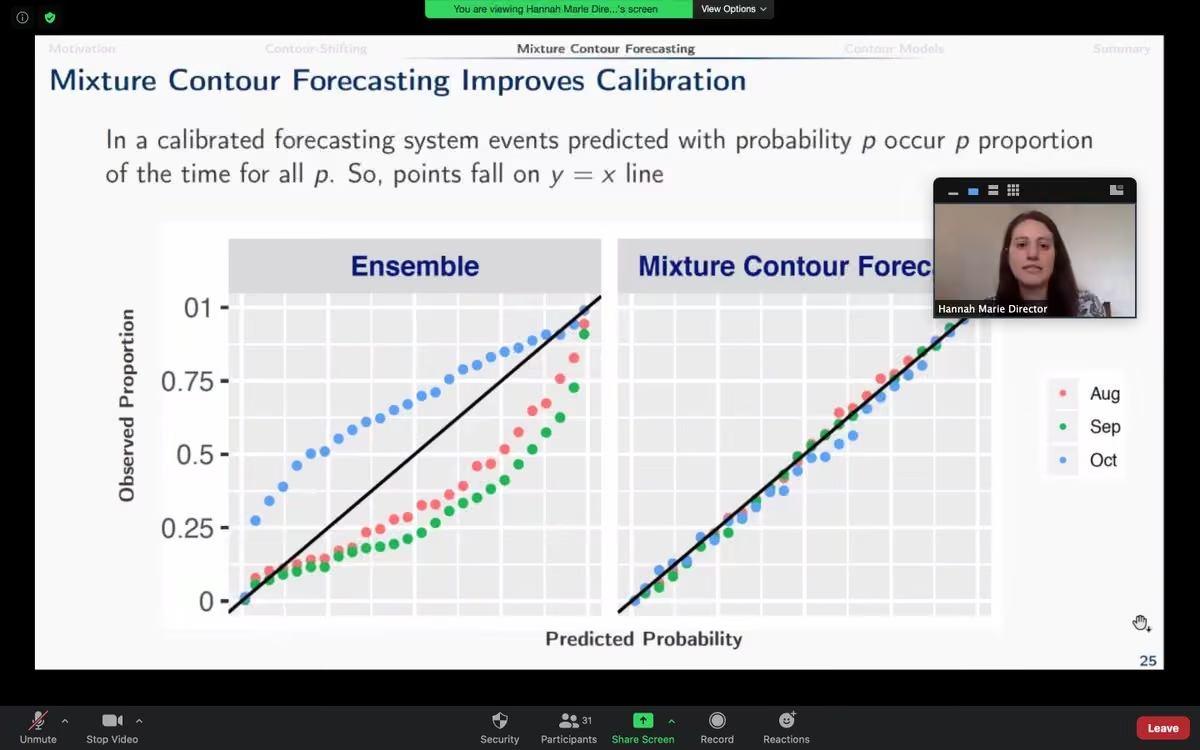
 Elizabeth Stuart
 Prof. Maryam Shahmanesh
 Cliff Mass
 Arthur Spirling
 Harvard Data Science Review
 Donald Williams


 CDC Director

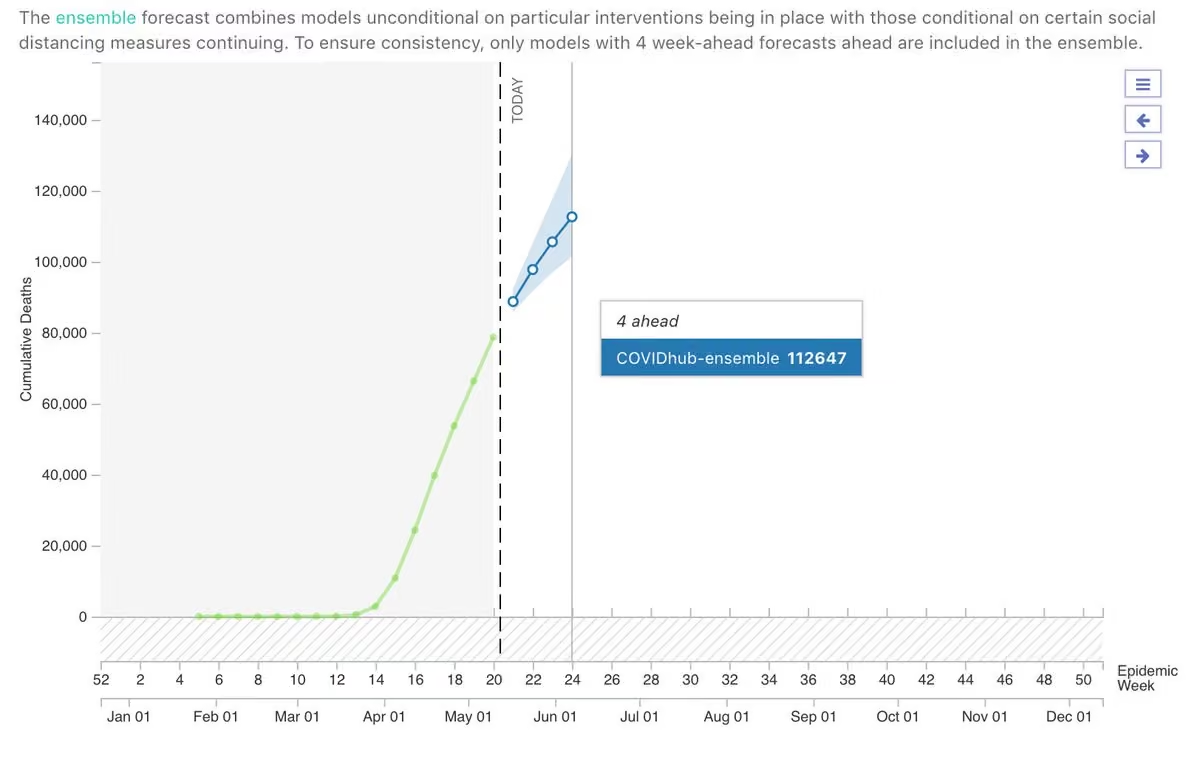
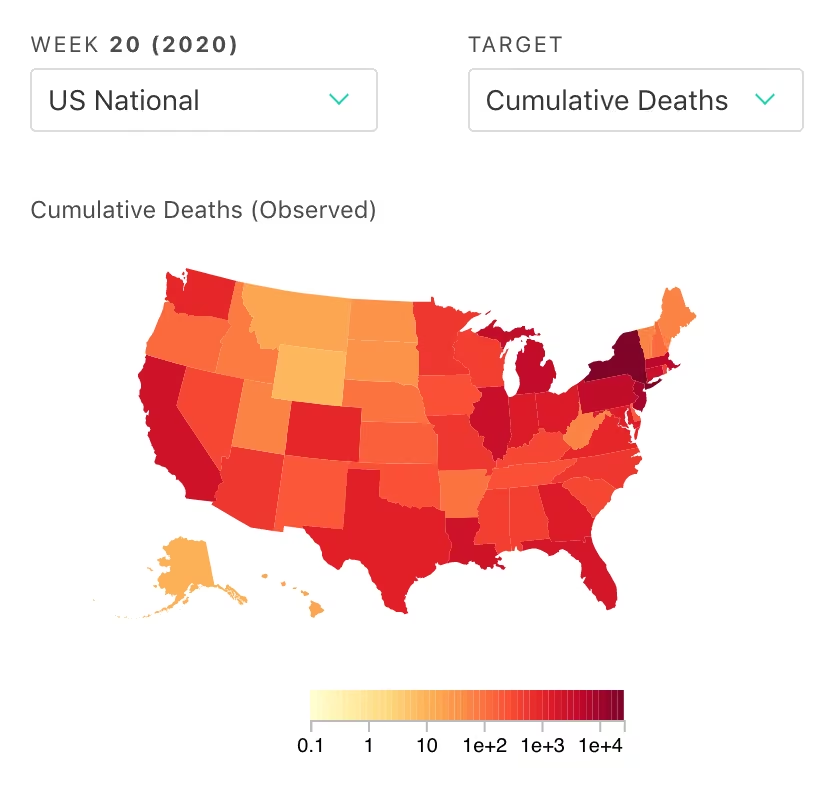


 Nilanjan Chatterjee

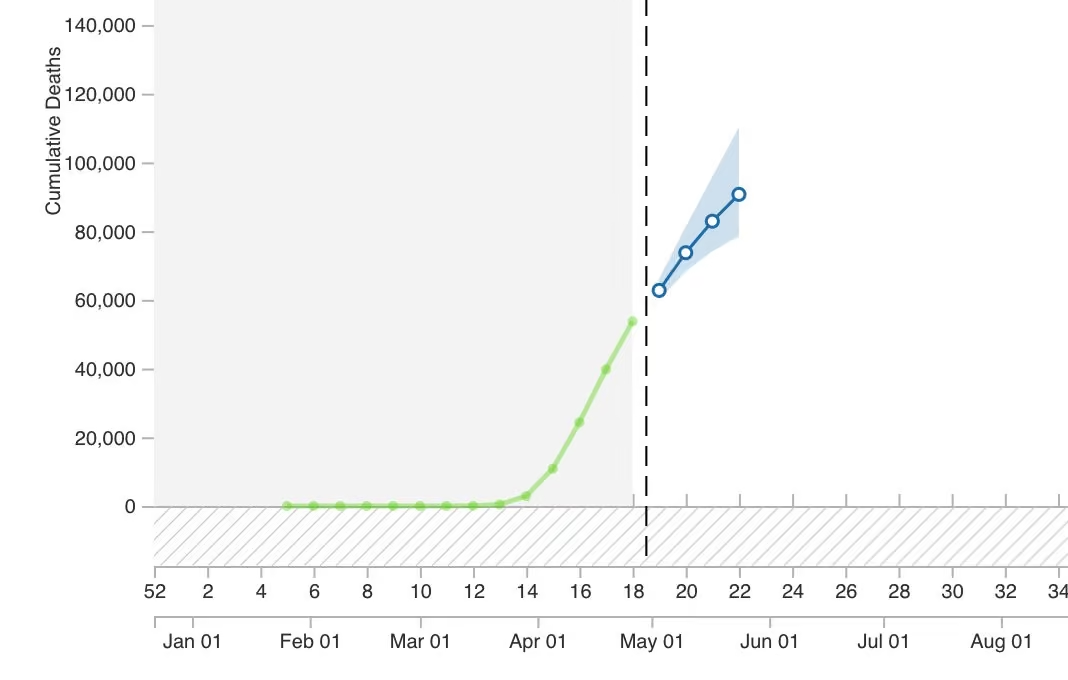
 Andrew Gordon Wilson


 Archive: Governor Andrew Cuomo
 CPC (@cpc-cg.bsky.social 🦋)

 Kevin Systrom
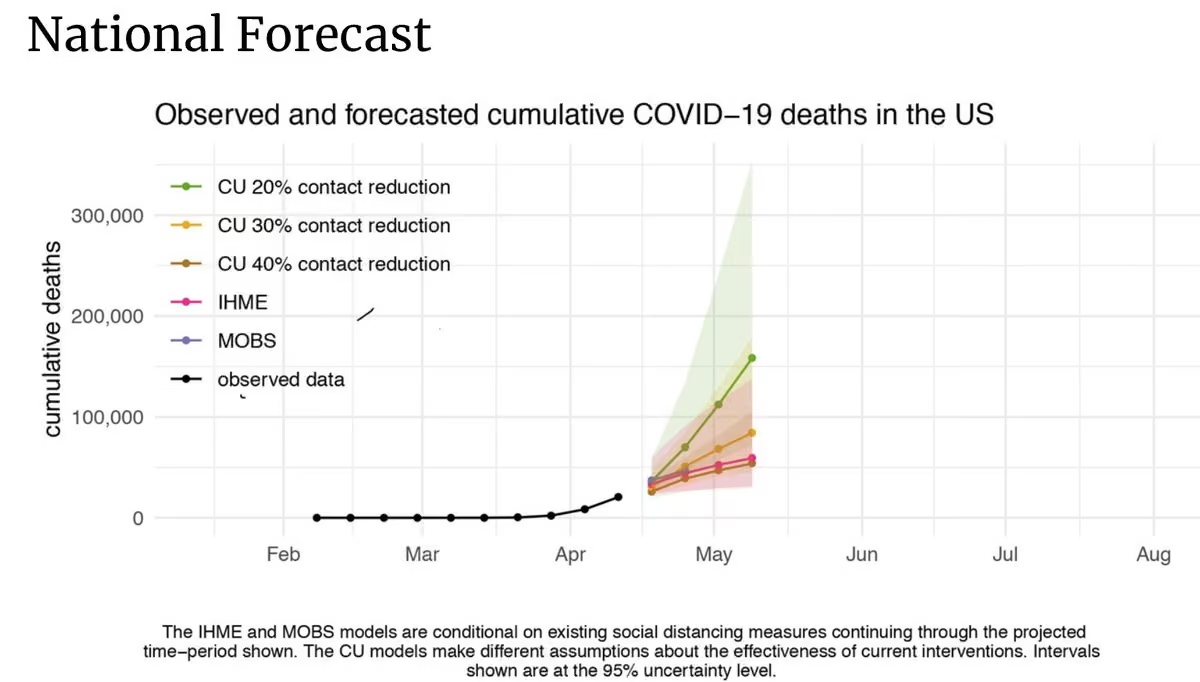



 Melinda Mills

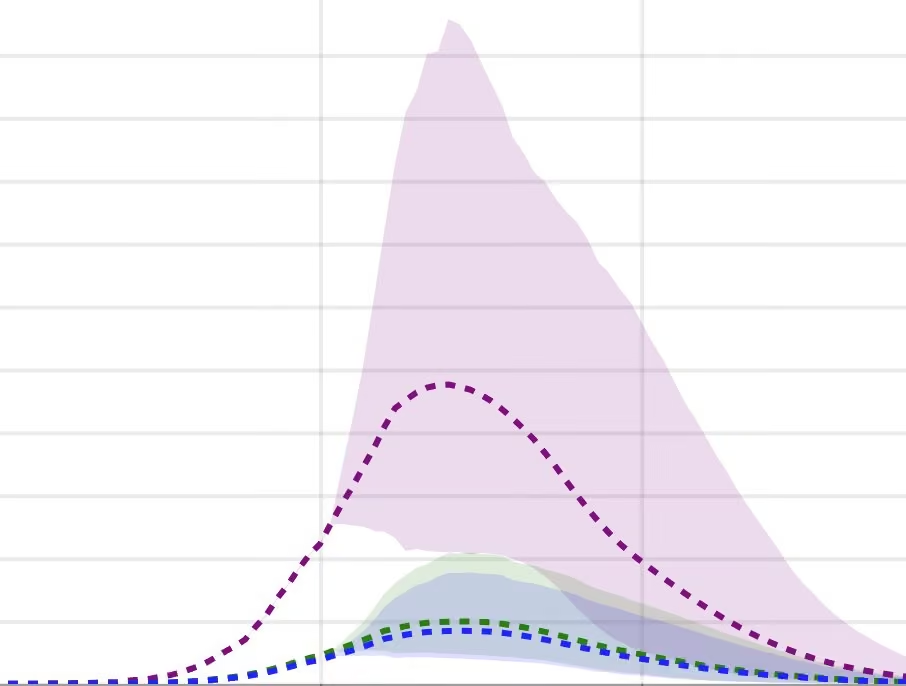
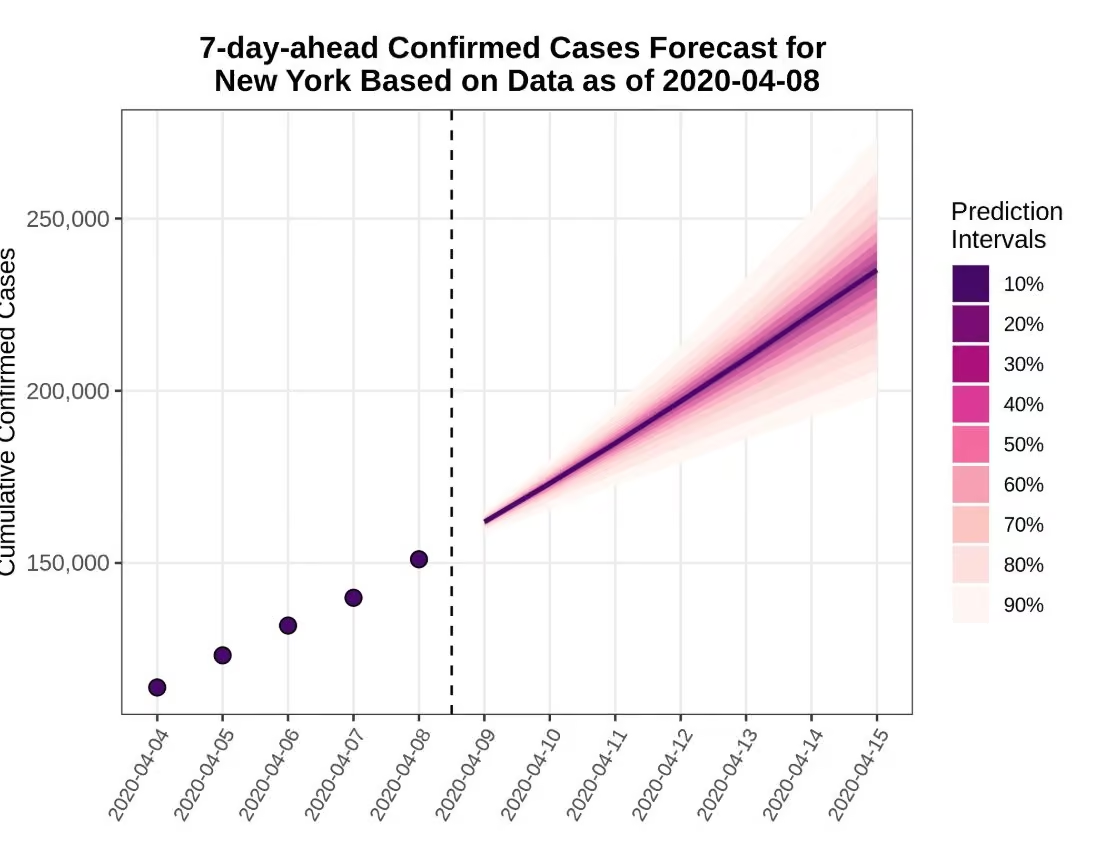
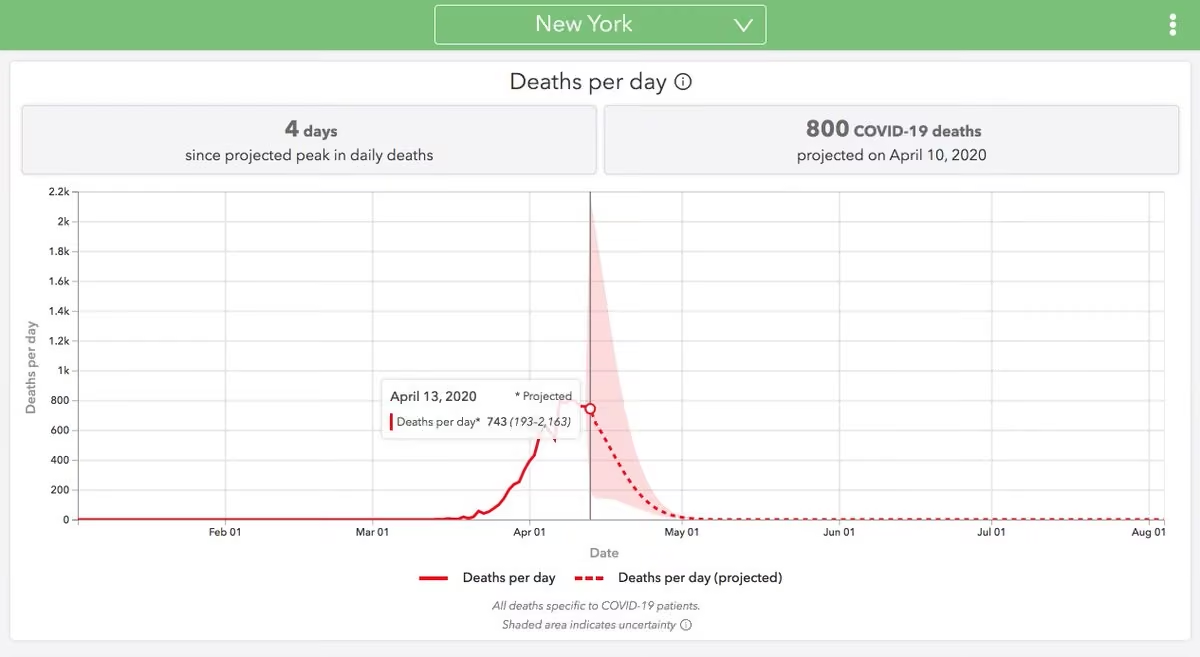

 Chris Uggen
 Bill Miller
 Roland Rau
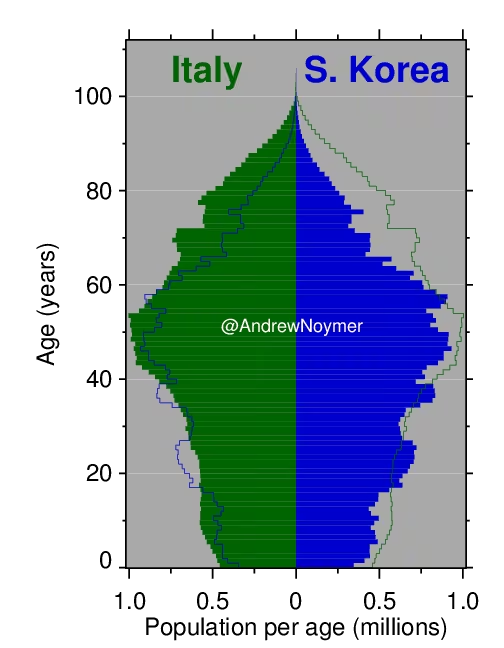
 Yanming Di
