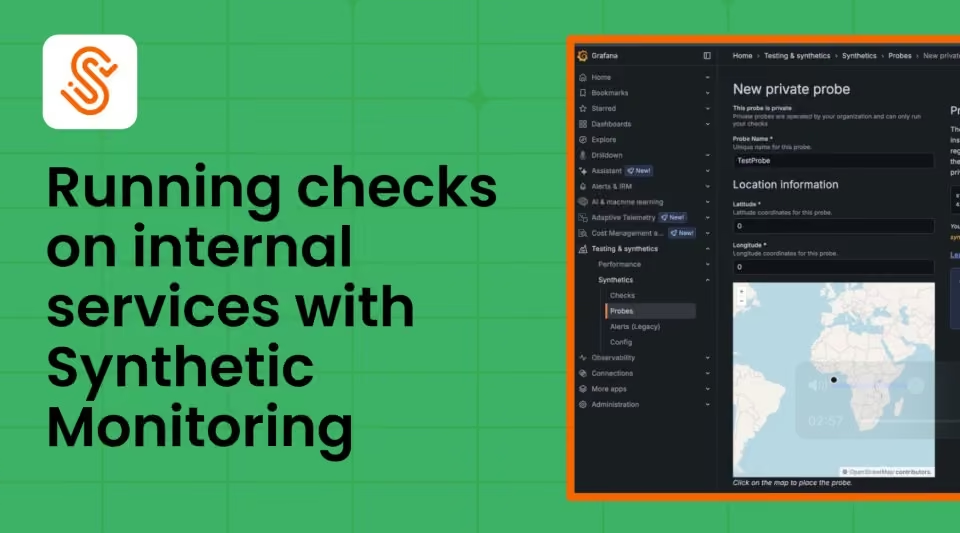

📁 Synthetic Monitoring folders are now GA in Grafana Cloud.
Organize checks by team, service, or environment, bulk enable/disable during maintenance windows, and control access with folder permissions.
grafana.com/blog/manage-synthetic-checks-at-scale-introdu…
Grafana
Grafana is an open-source analytics and visualization web application. It connects to time series databases and other data sources, allowing users to build dashboards that display metrics, logs, and traces. Grafana supports data sources including Prometheus, AWS CloudWatch, Graphite, InfluxDB, Elasticsearch, PostgreSQL, and MySQL. More on Wikipedia
-
Grafana
@grafana
-
Grafana
@grafana
Grafana Assistant's dashboarding mode hit 27% of all conversations, so we built a tiger team to fix the rough edges.
10 weeks later: error rate down 73%, p95 latency cut in half, costs down 18%. Here's what we instrumented, measured, and changed.
medium.com/grafana-labs/our-journey-to-improve-grafana-as… -
Grafana
@grafana
🎉 Grafana Labs is #61 on the inaugural #ai100 from @NewcomerMedia and @BessemerVP.
Thanks to our community and Grafanistas for building with us, and to our customers for your continued support.
ai100.newcomer.co -
Grafana
@grafana
🆕 Two new ways to tame #grafana dashboard variables:
1. Section-level variables (GA) scope controls to specific rows/tabs
2. Cross-dashboard variables (public preview) let you define a variable once and reuse it across every dashboard in a folder or org
grafana.com/blog/whats-new-with-grafana-variables-less-cl… -
Grafana
@grafana
#observabilitycon 2026 sessions are now available on demand!
Catch up on announcements from the keynote, technical talks, customer case studies from Deutsche Telekom, Uber, LexisNexis Risk solutions, a fireside chat with Anthropic, and more.
grafana.com/events/observabilitycon/?mdm=social&src=tw -
Grafana
@grafana
ICYMI: Fleet Management in Grafana Cloud now supports upstream #opentelemetry Collector distributions via OpAMP, centralized config management without migrating to Alloy first.
grafana.com/blog/manage-your-opentelemetry-collectors-wit… -
Grafana
@grafana
🇪🇸 #devopsdays, we'll see you there!
And don't miss the #opentelemetry talk from our Grafanistas Mario and Miguel. -
Grafana
@grafana
Our 5th annual Observability Survey is open, and we want to hear about your observability practice. 🫵
It takes about 5-10 minutes, and you can enter for a chance to win a Grafana hoodie.
grafana.com/observability-survey/?mdm=social&src=tw -
Grafana
@grafana
You get paged on a frontend incident, open a tool, DM a teammate, switch to another tool, etc.
But Grafana Cloud IRM provides on-call support, incident management, chatops, investigations, the Grafana mobile app, all connected through the incident record.
grafana.com/blog/go-from-alert-to-post-incident-review-wi… -
Grafana
@grafana
"Every agent in production right now without eyes on it is reliability debt already accruing, just waiting for the invoice." - @matryer
opsmatters.com/posts/weve-never-shipped-code-fast-underst… -
Grafana
@grafana
Grafana Champion YiliaLin penned a blog post on how to route Apache APISIX gateway logs → Loki → Grafana so on-call engineers can actually answer "which routes are failing?" during an incident.
medium.com/grafana-labs/from-gateway-logs-to-actionable-i… -
Grafana
@grafana
Writing AI-assisted docs at Grafana Labs taught us something uncomfortable: AI sycophancy + cognitive offloading can turn you into a meat proxy for your own tools.
Our Docs team shared their reflection and learnings.
medium.com/grafana-labs/ai-meets-psychology-sycophancy-co… -
Grafana
@grafana
Trace linkage is now GA in Database Observability 🎉
Jump from a database span in your trace straight to the query's execution data, historical performance, and explain plan. No more matching timestamps by hand!
grafana.com/blog/trace-linkage-connect-the-dots-between-y… -
Grafana
@grafana
Grafana Assistant dashboarding error rate dropped from 2.47% to 0.65% over ~10 weeks. P95 latency fell from 63s to 28.8s. And cost per request went down by 18%.
This was a result of six months of evaluation loops, CLI redesign, and agent tooling work.
grafana.com/blog/six-improvements-that-make-grafana-assis… -
Grafana reposted
Beto Muniz
@obetomuniz
Today I gave a talk on how autonomous operations are the next step for agentic observability with Grafana Assistant, Grafana Automations, Assistant Watchers (the project I’ve been actively working on recently), and Managed Sandboxes.
cc @grafana -
Grafana
@grafana
👀 When a multi-agent chain fails, you need to see which tool call or handoff introduced the error.
@matryer shares why decision-trail observability is what makes AI orchestration trustworthy.
www.infoworld.com/article/4240704/six-elements-of-resilie… -
Grafana
@grafana
Proud to be a launch partner in the @FireworksAI_HQ Frontier Ecosystem, announced today at #forge!
Let's do this 💪💪💪
Fireworks
@FireworksAI_HQ
The future of AI is specialized intelligence with models tuned to your data, your domain and your customers.
Today, we're proud to launch live from Forge the Fireworks Frontier Ecosystem with 60+ partners across the AI stack, helping you build and ship faster.
Check it out: -
Grafana
@grafana
What happens when third-party risk stops being a line item in a vendor review and becomes an active operational incident?
Our CISO Joe McManus wrote about what the TanStack npm compromise taught us at Grafana Labs.
securitytoday.com/articles/2026/10/12/what-the-tanstack-a… -
Grafana
@grafana
Instrumentation Hub is now GA in Grafana Cloud 📣
One Helm command to install Alloy, then point-and-click to roll out eBPF + OpenTelemetry auto-instrumentation across your Kubernetes clusters.
grafana.com/blog/instrumentation-hub-start-your-observabi… -
Grafana reposted
Miggo Security
@MiggoSecurity
We’re back from #observabilitycon 2026 with one clear message: Security is an observability problem.
In a lightning talk, Ben Stav of Miggo and Jonathan Price of @grafana challenged the way we think about security visibility.
Insights from the session:
➡️ Your org has the data your security org needs - you're just not using it yet
➡️ This is more important than ever - we gave this talk on the day of php2shell and other headline-making vulns. The observability people and SREs understood the importance at a visceral level
➡️ Security is everyone's concern - just like cost, architecture, and performance. Engineering and operations have an opportunity to empower the security org
Huge thank you to the Grafana Labs team for the partnership and to everyone who joined the conversation!
The future of application security isn't about collecting more alerts. It's about turning the visibility you already have into protection that matters.
#observabilitycon #observability #security -
Grafana
@grafana
🆕 Grafana Workflows (now in public preview) automates the coordination and the operational busywork that comes with incidents:
Incident channel, on-call commander, runbook links, support pages, and an AI briefing.
grafana.com/blog/spend-less-time-on-operational-busywork-… -
Grafana
@grafana
🙏 Thanks to our sponsors, we're taking #observabilitycon on the road to cities around the world.
These are one-day events with all of the highlights from our flagship event.
Nov 4: São Paolo
Nov 5: London
Nov 24: Madrid
Dec 8: Bengaluru
Register: grafana.com/events/observabilitycon-on-the-road -
Grafana
@grafana
🎃 #json by day. Jason by night.
And occasionally a dinosaur 😉
#happyhalloween from all of us at #grafana Labs!
See our GIPHY for more Halloween Grot GIFs and stickers, or search for it via GIPHY on Slack: giphy.com/grafana -
Grafana
@grafana
Grafana 13.3 has arrived 🎉
Define a variable once and reuse it across all your dashboards, capture and share findings in Notebooks, and the first phase of the biggest UI refresh since Grafana 7.
grafana.com/blog/grafana-13-3-release-all-the-latest-feat… -
Grafana
@grafana
🌌 Grafana Pages at #observabilitycon: a Northern Lights graph, live from the keynote demo. Now in public preview: grafana.com/blog/grafana-ai-next-gen-visualization?camp=b…
-
Grafana
@grafana
🎆🎇🎆🎇🎆
Fireworks
@FireworksAI_HQ
We’re working to build the largest collection of private and public practitioner evals.
Today, 31 new partners join the Specialized Intelligence Index, building on the expertise of our founding partners.
Compare leading models on real work and see where training could pay off. -
Grafana
@grafana
👀 Assistant Watchers are GA. Describe what matters in plain language, and a Watcher learns what's normal in your telemetry and surfaces findings when things change. #observabilitycon
-
Grafana
@grafana
Now GA: Grafana Marketplace 🎉
This platform gives independent software vendors, system integrators, and developers a new way to sell & distribute plugins built for Grafana.
If you're a Grafana Cloud user, trial Marketplace plugins free for 14 days. grafana.com/blog/grafana-marketplace/ -
Grafana reposted
DriveWealth
@DriveWealth
Last week, DriveWealth’s VP, Head of SRE and IT Operations, Serge Sheynkman spoke at @grafana's #observabilitycon, to share how our team is building agentic operations capability to triage alerts before they reach engineers.
-
Grafana
@grafana
🎆🎇🎆🎇🎆
Fireworks
@FireworksAI_HQ
We’re working to build the largest collection of private and public practitioner evals.
Today, 31 new partners join the Specialized Intelligence Index. Compare open, closed, and specialized models on real work, weigh quality against cost, and see where training could pay off. -
Grafana
@grafana
🆕 A 2-for-1 special: our open benchmark, o11y-bench, is joining @FireworksAI_HQ's Specialized Intelligence Index!
And today we're releasing o11y-bench 1.1. Check out the blog post to learn what's new: grafana.com/blog/evaluate-ai-models-for-observability-o11… -
Grafana
@grafana
Agentic ops isn't about removing humans... it's about giving them evidence and control at every step.
At #observabilitycon, we showed how Watchers, Investigations, and Managed Sandboxes bring detection, diagnosis, and proposed action into one workflow.
www.computerweekly.com/blog/CW-Developer-Network/Grafana-… -
Grafana
@grafana
🎉 Mobile Observability is in private preview. It sits on top of Frontend Observability, covers iOS, Android, React Native, and Flutter, and uses native OpenTelemetry SDKs.
mobile-preview.grafana.com?mdm=social&src=tw #observabilitycon -
Grafana
@grafana
📣 The Knowledge Graph is now in every Grafana Cloud stack, and it covers more of your environment, from frontend apps to AI agents.
grafana.com/blog/full-stack-observability-with-knowledge-… #observabilitycon -
Grafana
@grafana
We want your anonymous input! 🫵
Take 5-10 minutes to complete the anonymous survey and your input will help shape the upcoming report.
Every month for the rest of 2026, 2 participants will have a chance to win a Grafana hoodie: grafana.com/observability-survey/?src=x -
Grafana
@grafana
We asked Grafana Pages for a live map of traffic around the world. This is what we got. #observabilitycon
-
Grafana
@grafana
Faster full-text search is GA in Grafana Cloud Logs at no additional cost.
Built on Logline, queries are 5x faster on average and scan 75% less data.
grafana.com/blog/observabilitycon-2026-announcements?camp… #observabilitycon -
Grafana
@grafana
👋 Missed #observabilitycon? Find us at GitHub Universe this week!
Visit our booth and chat with the team about our new announcements in agentic operations, full-stack observability, and reimagining cloud economics. -
Grafana reposted
Adrían Bridgwater✍⌨️
@ABridgwater
Grafana Labs ‘traces’ path to agentic Ops with Watchers, Pages & Agent Observability www.computerweekly.com/blog/CW-Developer-Network/Grafana-… via @computerweekly
-
Grafana reposted
Stefan Zweifel
@_stefanzweifel
how about a Grafana dashboard with live and historic numbers of gym visitors? 😂
-
Grafana reposted
hans 👀
@hanspagel
strava is great
but did you try to run a local Grafana dashboard for your running data -
Grafana reposted
TechDay US
@techday
Grafana has added a knowledge graph to link telemetry and users, helping engineers trace faults from infrastructure issues to affected services and customers, and reduce time to resolution. #grafana #observability #telemetry #engineering techday.com/story/grafana-adds-knowledge-graph-to-link-te…
-
Grafana reposted
TechDay US
@techday
Grafana has expanded its cloud tools so teams can monitor AI agents and let them flag anomalies, diagnose issues and draft fixes. #grafana #ai #observability #cloud #devops techday.com/story/grafana-adds-ai-agent-tools-observabili…
-
Grafana reposted
Sahil Verma
@sahilvermaai
Grafana's going full agentic.
Agent Observability (OpenTelemetry-native) and Assistant Watchers just went GA at ObservabilityCON. Plus previews of Grafana Pages and Managed Sandboxes.
Their survey: 80% of orgs now build or operate LLM features — only 25% have purpose-built AI observability.
The agents need babysitters now. -
Grafana reposted
Lukasz Gut
@blinku_dev
-
Grafana reposted
Ward Bekker
@wardbekker
🎉 gcx v1.7.1 is live!
gcx brings Grafana to your terminal and AI coding agents. This release adds Assistant Watchers, more query output options, and improvements for automation.
github.com/grafana/gcx/releases/tag/v1.7.1
🙌 Thank you to everyone who contributed!
#grafana #opensource -
Grafana reposted
Ryan Daws 🤓
@Gadget_Ry
Observability bills keep climbing as AI adds systems to watch. Grafana Labs and ETR found 52% of IT leaders are comfortable letting AI remediate on its own, and 73% expect spend to rise again next year. Would you let AI change production, or only flag problems?
-
Grafana reposted
SAIM SAFDAR
@cloudnativeboy
1/14 🧵 ObservabilityCON 2026: Grafana Labs is rethinking observability.
It’s no longer just about dashboards, metrics, logs, traces
The focus is shifting toward AI agents, connected system context, lower telemetry costs, and more autonomous operations
Biggest announcements 👇 -
Grafana
@grafana
The #observabilitycon 2026 keynote is now on demand!
Learn about our announcements, including Loki queries, Adaptive Telemetry updates, Knowledge Graph in every Grafana Cloud stack, Assistant Watchers, Managed Sandboxes, and Grafana Pages.
Watch: www.youtube.com/watch?v=_ASFsH_LIKE -
Grafana
@grafana
San Francisco, thanks for bringing the energy to #observabilitycon 2026.
Glad to see so many of you in person. 🧡
Here’s a little of what it felt like to be there. -
Grafana
@grafana
🙏 A big thanks to @DevInterrupted for joining us at #observabilitycon 2026 and creating this clip.
Stay tuned for future episodes! -
Grafana reposted
NetBox Labs
@NetBoxLabs
A lot is happening in the world of observability, and @Grafana's ObservabilityCON was the place to be this week!
Great conversations around AI for observability and plenty of insights to take away.
Thanks to the Grafana community and our team on the ground for a great event! -
Grafana reposted
Fatjon Nebiu
@fatjon_nebiu
Never been more excited about a Grafana feature. The AI Pages in Grafana Cloud is a real game changer. 🧡
Grafana
@grafana
🎉 Introducing Grafana Pages! Turn your data into interactive experiences with the next evolution of Grafana.
Available in public preview: grafana.com/blog/grafana-ai-next-gen-visualization?camp=b…
#observabilityconThis media couldn't be displayed. See it on the original post. -
Grafana
@grafana
🤖 New in autonomous operations:
- Assistant Watchers keeps watch (GA)
- Assistant Investigations gathers evidence on what changed (GA)
- Grafana Managed Sandboxes prepares changes for your team to review (public preview)
grafana.com/blog/grafana-ai-autonomous-operations?camp=bl… -
Grafana
@grafana
🧡 San Francisco. Wow.
To the users, customers, speakers, sponsors, and Grafanistas who came together at #observabilitycon 2026: thank you.
We're heading home with new connections, ideas to build on, and conversations we can't wait to continue.
See you at the next one! -
Grafana
@grafana
🎉 Introducing Grafana Pages! Turn your data into interactive experiences with the next evolution of Grafana.
Available in public preview: grafana.com/blog/grafana-ai-next-gen-visualization?camp=b…
#observabilityconThis media couldn't be displayed. See it on the original post. -
Grafana
@grafana
Brb.
#observabilitycon. -
Grafana
@grafana
💅 💅 💅
𝗠𝗔𝗟𝗜𝗡 𝗗𝗛𝗔𝗠𝗦𝗔𝗥𝗔
@MalinDhamsara
Observability with aesthetics 😂
Grafana
@grafana
And one more thing… 🥁🥁🥁
Introducing #grafana Pages, a new feature in Grafana Cloud that gives you a canvas to describe what you need and build a live app in minutes, based on your real data, context, and interactions.
🔗: grafana.com/blog/grafana-ai-next-gen-visualization
#observabilitycon -
Grafana
@grafana
‼️ Oops. We shipped a ton at #observabilitycon this year!
Explore every announcement in the blog post: grafana.com/blog/observabilitycon-2026-announcements/ -
Grafana
@grafana
🎁 That's a wrap on the #observabilitycon 2026 keynote.
We announced Assistant Watchers, Cloud Agents, Agent Observability, Knowledge Graph in every stack and more.
Thanks for joining us.
See *everything* we announced: grafana.com/blog/observabilitycon-2026-announcements -
Grafana
@grafana
And one more thing… 🥁🥁🥁
Introducing #grafana Pages, a new feature in Grafana Cloud that gives you a canvas to describe what you need and build a live app in minutes, based on your real data, context, and interactions.
🔗: grafana.com/blog/grafana-ai-next-gen-visualization
#observabilitycon -
Grafana
@grafana
Open is better.
Agent Observability with #opentelemetry support is now GA. See what your agents are doing and what they cost your teams, on the same open standards as the rest of your stack.
🔗: grafana.com/blog/observabilitycon-2026-announcements/
#observabilitycon -
Grafana
@grafana
🎉Now GA: Assistant Watchers!
Describe what matters in plain language, and a Watcher learns normal patterns from your telemetry and surfaces findings when they change. Findings route through Grafana Alerting.
🔗: grafana.com/blog/observabilitycon-2026-announcements/
#observabilitycon -
Grafana
@grafana
We love to see it: fewer manual steps during an incident 🤖
Grafana Workflows (public preview) connects actions across Grafana Cloud and your other tools, with Grafana Assistant for steps that need analysis or writing.
#observabilitycon
grafana.com/blog/observabilitycon-2026-announcements -
Grafana
@grafana
Grafana Managed Sandboxes are in public preview!
Grafana Assistant gets a controlled cloud environment to develop proposed fixes, with a pull request for human review.
🔗: grafana.com/blog/grafana-ai-autonomous-operations
#observabilitycon -
Grafana
@grafana
Session Replay: now in public preview in Grafana Cloud Digital Experience Monitoring!
Watch a video-player-like recording of what your users did in your app & correlate failures with the underlying telemetry. See other DEM updates 👇
grafana.com/blog/observabilitycon-2026-announcements/?pg=…
#observabilitycon -
Grafana
@grafana
📣 Knowledge Graph, now in every Grafana Cloud stack, links databases, #kubernetes & cloud services to the user's browser, so people and agents can trace a symptom to its cause.
We’re bringing more of your environment into it.
🔗: grafana.com/blog/full-stack-observability-with-knowledge-…
#observabilitycon -
Grafana
@grafana
📦 New in Adaptive Telemetry:
- Fleet-managed Adaptive Logs (public preview)
- Logs Archive (public preview) keeps logs in a bucket you own
- Metrics Auto-Apply (GA) applies recommendations automatically
See more: grafana.com/blog/cut-costs-keep-what-you-need-adaptive-te…
#observabilitycon -
Grafana
@grafana
🎉 #observabilitycon 2026 is live from San Francisco!
Today's keynote covers new releases for agentic operations and AI, cloud economics, and full-stack #observability in Grafana Cloud.
Tune in or follow here for each announcement.
youtube.com/live/fAnah-FkYfA -
Grafana
@grafana
🙏 A big thank you to our Pioneer sponsor Amazon Web Services (AWS) for making #observabilitycon possible.
See you in SF soon, or check out the keynote livestream today: grafana.com/events/observabilitycon/2026/ -
Grafana
@grafana
📢 The #observabilitycon 2026 keynote is happening today!
Tune in at 10 am PT to watch it live. Be among the first to learn about our latest announcements and see demos of what’s new.
www.youtube.com/live/fAnah-FkYfA -
Grafana
@grafana
📣 Introducing the 2026 State of Observability Report 📣
We asked 300 IT leaders to share how they’re using #ai, what they’re spending on #observability, and what’s working for their teams.
See all of the findings: grafana.com/analyst-reports/executive-survey/?mdm=social&… -
Grafana
@grafana
🙏 An event like #observabilitycon takes a village. Shout out to our sponsors for making this possible.
Guru sponsors:
@Ahead
@googlecloud
@Microsoft
Champion sponsors:
@crestdata_ai
@GremlinInc
Tune in to the keynote livestream on Oct 20: grafana.com/events/observabilitycon/2026 -
Grafana
@grafana
Loading: #observabilitycon 2026…
See you soon, SF! 👋
Can’t join in person? Sign up to watch the keynote livestream and catch the announcements: grafana.com/events/observabilitycon/2026/agenda/opening-k… -
Grafana
@grafana
‼️ Last chance to register for #observabilitycon 2026!
#ai for observability. #observability for AI. A platform for both.
Join us for hands-on learnings, announcements, new ideas, and conversations with the people building what's next.
See y'all there:
grafana.com/events/observabilitycon/ -
Grafana
@grafana
Our Knowledge Graph builds a contextual layer on your telemetry data, automatically extracting entities & relationships so you can see services connect.
See how it powers root-cause investigation in Grafana & via agentic workflows w/ gcx & Claude Code: www.youtube.com/watch?v=dj0NUYSsPJg -
Grafana
@grafana
✌️ Adaptive Metrics auto-apply now has two modes:
Coverage-first: applies every recommendation immediately
Cost-first: applies increases that won't push your total series count above where it started.
grafana.com/blog/coverage-first-or-cost-first-two-ways-to… -
Grafana
@grafana
Introducing Grafana Learn: free learning journeys and hands-on paths to help you understand the concepts and put them to work.
No login. No paywall. No forms.
Less “Where do I start?”
More “Let’s try it.” 👍
Start exploring: grafana.com/docs/learning-hub -
Grafana
@grafana
👀
ClaudeDevs
@ClaudeDevs
Now in public beta, Claude Platform can send OpenTelemetry traces from the Messages API, Claude Managed Agents, and the Claude SDKs to your observability stack.
This media couldn't be displayed. See it on the original post. -
Grafana
@grafana
Claude agent traces — now in Grafana Cloud's Agent Observability!
The Claude Platform now exports OpenTelemetry traces natively from Claude Managed Agents, the Messages API & the Claude SDKs. Connect Grafana & follow every model call, tool call & token.
grafana.com/docs/grafana-cloud/observe-and-act/agent-obse… -
Grafana
@grafana
The countdown to #observabilitycon is on!
Join us in SF, Oct 19-21 for hands-on learning, announcements, and conversations with the people building what's next.
#ai for observability. #observability for AI. A platform for both.
See what's in store: grafana.com/events/observabilitycon?mdm=social&src=tw -
Grafana reposted
Crest Data
@crestdata_ai
See you at #observabilitycon 2026!
We’re excited to join the @grafana community in San Francisco as a Champion Sponsor. Let’s talk Grafana plugins, integrations, and observability at scale.
Attending? Let's Connect: www.crestdata.ai/events/crest-data-at-observabilitycon-2026/
#grafana #crestdata -
Grafana reposted
Miggo Security
@MiggoSecurity
Security is an observability problem. So what can your telemetry tell you about security?
Join us at #observabilitycon where Ben Stav from Miggo and Jonathan Price from @grafana explore how observability telemetry can help teams uncover security risks.
🗓️Wednesday, October 21 | 3:45 PM
📍Lightning Talk Theater, Pier 27
Use MIGGOINVITE50 to save 50% on your ticket.
grafana.com/events/observabilitycon/?src=sponsors&mdm=soc…
#observabilitycon #observability #security -
Grafana
@grafana
📣 Meet the guest speakers taking the stage at #observabilitycon! 🧵
From @AnthropicAI & @Uber to @CoreWeave & @SailPoint — join us as we discuss what's next for AI and observability.
💡Practical insights. Big ideas. Lots to geek out about!
Register: grafana.com/events/observabilitycon/Post not available here, view on X
Grafana
@grafana
.@LexisNexisRisk will share how various solutions within Grafana Cloud power their autonomous operations.
More into the intersection of observability and sports?
@deutschetelekom will share how Grafana Assistant ensured reliability during the World Cup.
Grafana
@grafana
It wouldn't be an observability conference without a success story featuring #opentelemetry. Don't miss UKG's use case with Grafanfa Cloud.
And if you're keen to learn about Agentic SRE, @DriveWealth's session is for you. -
Grafana
@grafana
🛣️ #observabilitycon is almost here.
Join us in SF, Oct 19-21 to see what's next.
Explore new ways to investigate issues faster, understand what your AI agents are *actually* doing, and scale observability while keeping costs in check.
Register: grafana.com/events/observabilitycon/ -
Grafana
@grafana
🤖 Grafana Assistant went from hackathon to GA in six months — and observing it was tough to say the least. So we built Agent Observability.
Here's how to build a real trust + monitoring setup for your own agents, based on what we learned building ours.
grafana.com/blog/how-to-build-a-trust-platform-for-your-a… -
Grafana
@grafana
Start with a question in Claude. Keep exploring in #grafana. 📊
We’re excited to be a launch partner for #claude Dashboards, now in beta!
Check it out: claude.com/resources/articles/dashboards-and-motion -
Grafana
@grafana
`loki.secretfilter` in Alloy got a deep rework! 🛠️
Gitleaks integration + go-re2 brought clean log lines from ~2 seconds per op to tens of milliseconds (≈60x faster, ≈10x fewer allocations).
medium.com/grafana-labs/making-loki-secretfilter-in-alloy… -
Grafana
@grafana
Our 5th Annual Observability Survey is now open, and we want your anonymous input! 🫵
It only takes 5-10 minutes and your input will help shape the upcoming report.
Participants who complete the survey will have a chance to win a Grafana hoodie: grafana.com/observability-survey/ -
Grafana
@grafana
😶🌫️ Hallucinations don't have to be unknowns. Treat them like error budgets.
Check out this blog from @ivanahuckova on applying SLOs to #ai agent behavior — groundedness, fulfillment, toxicity, each as its own metric with its own budget.
grafana.com/blog/what-if-your-agent-s-hallucinations-had-… -
Grafana
@grafana
Grafana Play is a fun and interactive resource for the community.
Here's how the team uses Git Sync + Terraform to version-control hundreds of dashboards — PR reviews, a dedicated dev environment, and no more "live edit = instant production" surprises.
medium.com/grafana-labs/how-we-provision-grafana-play-das… -
Grafana
@grafana
🎙️ 🎙️ 🎙️ If you've ever wondered how Grafana thinks about AI for observability and observability for AI, this oldie-but-goodie podcast episode covers your questions.
ICYMI, check out the conversation on Ship It Weekly featuring @matryer.
substack.tellerstech.com/p/ship-it-conversations-mat-ryer… -
Grafana
@grafana
Proud to sponsor #promcon EU! Don't miss our booth + talks from our team:
Using Delta Temporarily in #prometheus
Metrics deserve contracts
6 #promql Functions to Escape from Analytical Workarounds
Kubernetes: Engineering PromQL Queries for Prometheus & #otel Convergence -
Grafana reposted
mtanda
@mtanda
Grafana Live事例を最近よく見かけるので、興味がある人もいるかなと思い、解説記事を書いてみました。
試してみてわかったのですが、想定よりもいろいろなパネルでGrafana Liveが使えます。面白い使い方ができそうなので、興味がある方は試してみてください。
zenn.dev/mtanda/articles/20261005-grafana-live-playground -
Grafana reposted
Marvin
@sp4rtan300
I’m falling in love with creating Grafana Dashboard
-
Grafana
@grafana
⚽️ When your platform is your product, observability isn't a just a back-office concern.
Spoiler alert: it's also commercial.
@DabbleFantasy moved from self-hosted Grafana to Grafana Cloud to unify metrics, logs & traces as they scale across 3 countries.
itbrief.com.au/story/dabble-moves-observability-to-grafan… -
Grafana
@grafana
🆕 Tempo 3.1 is out — Kafka client improvements, new TraceQL metrics capabilities, trace redaction, and easier operations across the board.
grafana.com/blog/tempo-3-1-release-all-the-latest-feature… -
Grafana
@grafana
🌌 #grafanaeverywhere. Even when chasing the northern lights.
With the aurora particularly strong this weekend, hear how Mohamed Adem built this Golden Grot Award-winning project with Grafana Assistant to explore whether an aurora will be visible. -
Grafana
@grafana
🆕 New Grafana Cloud IRM demo: declare an incident from Slack and Grafana Assistant goes to work automatically.
Full walk-through with step-by-step explanations: youtu.be/Eb2XYqkgb44 -
Grafana
@grafana
Hey Tempo community! 👋
We have a community call coming up on October 8, 9:30a PT/6:30p CEST.
Two new ways to use a #traceql query in Tempo 3.1: redact the traces it matches, or filter a trace-by-ID v2 response down to matching spans.
www.youtube.com/watch?v=L1JPn8X7DlM -
Grafana
@grafana
‼️ Last day: Save 30% on your #observabilitycon 2026 tickets.
Don’t miss hands-on workshops, the keynote, technical deep-dive sessions, and talks from @AnthropicAI, @deutschetelekom, @Uber, @LexisNexisRisk, @UKGInc & more.
Register: grafana.com/events/observabilitycon/2026/?src=x&camp=obsc… -
Grafana reposted
Crest Data
@crestdata_ai
San Francisco, we’re coming your way!
Crest Data is a Champion Sponsor at #observabilitycon 2026. Meet us & the @grafana community Oct 19–21 at Pier 27!
Let’s connect: www.crestdata.ai/events/crest-data-at-observabilitycon-2026/
#grafana #crestdata -
Grafana
@grafana
👋 Who’s headed to Observability Summit EU?
We are!
Come find our booth to get some swag and answers to your observability questions. And don’t miss @eyeveebee’s talk! -
Grafana
@grafana
🤔 Just *how* powerful is the Grafana Knowledge Graph? See for yourself.
Jia Xu demos how it powers root-cause investigations both in the #grafana UI and through agentic workflows using gcx and Claude Code.
Give it a watch and let us know what you think! youtu.be/dj0NUYSsPJg -
Grafana
@grafana
Last day!
Grafana
@grafana
‼️ Last chance: Save 30% on your #observabilitycon 2026 tickets. Register by Oct 1!
Don’t miss hands-on workshops, the keynote, technical deep-dive sessions, and talks from @AnthropicAI, @deutschetelekom, @Uber, @LexisNexisRisk, @UKGInc & more!
Register: grafana.com/events/observabilitycon/2026/?src=x&camp=obsc… -
Grafana
@grafana
According to our 2026 Observability Survey, nearly 50% of orgs use managed observability. Up from 43% a year ago.
ICYMI: AI companies like 7AI, TeamSystem, and Zama have standardized on Grafana Cloud as AI workloads generate more telemetry. Here's why 👇
itbrief.com.au/story/grafana-wins-ai-customers-as-observa… -
Grafana
@grafana
Reposting for others who might be curious about alerting: support for Git Sync.
⬇️⬇️⬇️
Grafana
@grafana
Hello, Zhoro and the 15 ppl who have liked your tweet so far.
You’re in luck, we’ve got a GH ticket where you can follow along for the updates!
github.com/grafana/grafana/issues/120686
Yours truly,
The social media person at Grafana Labs + the Git Sync team -
Post not available here, view on X
Grafana
@grafana
Hello, Zhoro and the 15 ppl who have liked your tweet so far.
You’re in luck, we’ve got a GH ticket where you can follow along for the updates!
github.com/grafana/grafana/issues/120686
Yours truly,
The social media person at Grafana Labs + the Git Sync team -
Grafana
@grafana
‼️ Last chance: Save 30% on your #observabilitycon 2026 tickets. Register by Oct 1!
Don’t miss hands-on workshops, the keynote, technical deep-dive sessions, and talks from @AnthropicAI, @deutschetelekom, @Uber, @LexisNexisRisk, @UKGInc & more!
Register: grafana.com/events/observabilitycon/2026/?src=x&camp=obsc… -
Grafana
@grafana
gcx + Grafana MCP gives you telemetry on your agents' behavior, so you can ship with confidence, not just positive vibes with fingers crossed 🤞
grafana.com/blog/telemetry-driven-development-how-to-gain… -
Grafana
@grafana
Bolting on observability at the end?
Grafana Assistant makes it realistic for any team to bake it in from the start. Here's how 👇
grafana.com/blog/smarter-onboarding-and-planning-with-gra… -
Grafana
@grafana
Ever wonder how we think about and build our AI solutions? 🤔
A big philosophy of ours: start with the problem, not the model. No AI for the sake of it.
Just small iterations, real customer feedback, and shipping things that help people get work done.
medium.com/grafana-labs/how-we-build-ai-at-grafana-labs-s… -
Grafana
@grafana
Grafana engineer Gregor Zeitlinger built a 34-key keyboard where keys change based on what you just typed, and single presses expand into full words.
This is the rabbit hole that taught him how, and how you can start building your own.
medium.com/grafana-labs/the-secret-world-of-keyboard-wiza… -
Grafana
@grafana
Show me the... money? 💰
ICYMI: cost attribution in Grafana Cloud now covers Synthetic Monitoring and k6!
Trace testing costs back to the team or service responsible, the same way you already can for metrics, logs, and traces.
grafana.com/blog/cost-attribution-in-grafana-cloud-manage… -
Grafana
@grafana
😌😌😌😌😌😌😌
Chris ➔ abacatepay.com
@ChristoPy_
estou viciado em grafana
-
Grafana reposted
Chukwuduzie Blaise
@vector_ware
I've Grafana K6 before, the load testing is really good
-
Grafana reposted
Krishna
@Shri_Krishna_Y
metrics, logs & traces from multiple sources —> a single real-time dashboard
#grafana -
Grafana
@grafana
#observabilitycon 2026 discount tickets are going away after Oct 1.
Don't wait to save 30% on your registration. Sign up to join us in SF and take your observability to new heights: grafana.com/events/observabilitycon/?camp=obscon2026&mdm=…
Grafana
@grafana
📆 We're clearing up the system fog. AI for observability. Observability for AI. Solutions for all. Save the date for #observabilitycon 2026.
Sign up to receive an exclusive discount and early access to registration: grafana.com/events/observabilitycon/?camp=obscon2026&mdm=… -
Grafana
@grafana
A shared #kubernetes platform might serve interactive API requests, long-running reasoning ops, and batch jobs behind the same ingress... and one p99 panel hides all of it.
Here's how to build workload-aware SLO dashboards that actually tell the truth!
medium.com/grafana-labs/how-to-build-workload-aware-slo-d… -
Grafana reposted
Ivana Huckova
@ivanahuckova
Had a great time at @AgentConf with @svennergr talking about how @grafana’s Agent Observability can help us, and everyone else building agents 🫵, build agents they can trust.
The video is out now! 🎥👇
youtu.be/XvgprsJDo3o -
Grafana
@grafana
Your voice helps the Grafana community! 🗣️
Speak at one of our meetups — whether it's a lightning talk or a deep dive — and score an exclusive free t-shirt!
Submit your talk, take the stage, and receive your tee. Limit one per speaker: grafana.qualtrics.com/jfe/form/SV_4OQ9dzUAbSHfrAG -
Grafana
@grafana
🔭 Who isn't in awe of our celestial neighbor? The Moon gives us plenty to marvel at — and observe.
It’s still surreal knowing Grafana helped teams at @JAXA_jp , @fireflyspace , and NASA (with @Int_Machines) make Moon landing history.
Happy International Observe the Moon Night. -
Grafana
@grafana
This post shows how to monitor your HCP Terraform or Terraform Enterprise runs by pointing a self-hosted agent at Alloy and shipping traces, metrics, and logs into Grafana Cloud so you can be sure your deployment operates properly going forward.
grafana.com/blog/how-to-monitor-hcp-terraform-and-terrafo… -
Grafana reposted
Simon Prickett 🇪🇺| simonprickett.dev
@simon_prickett
A couple of pics from my plane tracking with @grafana and @Redisinc talk / demo at our London meetup last night. The SDR’s radio aerial was stuck in a plant near a window and we still managed to see planes as far as the Isle of Wight whilst in the Kings Cross area.
-
Grafana
@grafana
🎨 Our recently introduced Graphviz panel lets you *describe* payment flows, network weathermaps, and process diagrams in DOT — then wire them straight to live data.
No manual box-nudging.
Private preview now in all editions!
grafana.com/blog/how-to-visualize-workflows-and-business-… -
Grafana
@grafana
Who's running Cypress tests? ✋
If you mentally raised your hand, learn how to monitor your Cypress tests with #grafana Cloud.
Convert results into Prometheus metrics inside a Cypress hook, push to a Pushgateway, let Alloy scrape and forward.
grafana.com/blog/how-to-monitor-cypress-tests-with-grafan… -
Grafana
@grafana
🦺 AI safety has been top of mind as agents are becoming part of the production toolchain.
That's why we're bringing Grafana Agent Observability's safety protections to OSS users through the agento11y CLI.
Install, configure your agent & stay protected: github.com/grafana/agento11y/ -
Grafana
@grafana
👋 Synthetic Monitoring users!
We're rolling out an update that lets your custom labels attach directly to every check metric, not just sm_check_info, & removes the label_ prefix.
If you use custom labels, migrate to the new labels by Mar 1, 2027.
grafana.com/blog/synthetic-monitoring-labels-update/?camp… -
Grafana
@grafana
🎉 New in Grafana Cloud Digital Experience Monitoring:
Session Replay lets you visually replay exactly what a user saw — mouse movements, DOM actions, and all — correlated with Core Web Vitals and traces.
Privacy-first by default, powered by Faro.
grafana.com/blog/digital-experience-monitoring-with-grafa… -
Grafana
@grafana
.@simon_prickett’s #eurovision dashboard is quite the mic drop! 🎤
Built with Grafana Cloud: tabs, variables, Google Sheets, and SQL expressions to show 25 finalists + every jury and public vote.
medium.com/grafana-labs/douze-points-for-grafana-cloud-bu…
Grafana
@grafana
🤩
-
Grafana
@grafana
.@MIT Open Learning has a big goal of reaching 1 billion learners.
Their 5-person platform team unified observability into one Grafana Cloud stack — cost savings hit immediately after turning on Adaptive Telemetry 🎓
Learn more: grafana.com/success/mit/?mdm=social&src=tw -
Grafana
@grafana
CTW automated full-stack observability for every new game in seconds using Grafana Cloud — turning monitoring into a self-service platform for internal teams and game studios, and making observability a competitive advantage.
grafana.com/success/ctw/ -
Grafana
@grafana
Have you tried the k6 x docs command? 💪
It gives your AI coding agent direct CLI access to k6 documentation: version-matched, offline-capable, with a built-in agent skill so it looks up docs instead of hallucinating function signatures.
grafana.com/blog/better-context-smarter-testing-how-to-gi… -
Grafana
@grafana
Our professional services team walked through sizing and load testing a production Alloy central gateway.
17M active series, 1 TB/day logs, 1 TB/day traces — with real, anonymized numbers from an enterprise engagement.
Here's how.
grafana.com/blog/how-to-scale-alloy-as-a-central-telemetr… -
Grafana
@grafana
🤷♂️ Synthetic checks are green. Support ticket says users can't load the page.
Which one do you trust?
That's the blind spot of a synthetic-only strategy. Pair Grafana Cloud Synthetic Monitoring with Frontend Observability and you close that gap.
grafana.com/blog/from-failed-check-to-real-user-impact-pa… -
Grafana
@grafana
Our teams kept rebuilding the same LLM integration stack from scratch.
So we built the AI SDK for Go: shared interfaces for streaming, tools, structured output, and multi-step agents that speak Vercel AI SDK protocol.
Last month, we made it open source!
grafana.com/blog/the-grafana-ai-sdk-for-go-a-shared-found… -
Grafana
@grafana
🧠 Knowledge Graph context changed the outcome dramatically in one incident replayed 32 times.
With it: 15/16 correct root causes.
Without it: 1/16.
It's not about more context — it's about the *right* context.
grafana.com/blog/knowledge-graph-as-context-for-llms-demo… -
Grafana
@grafana
Instrumentation quality is now scored in Grafana Cloud's Knowledge Graph — so you can see exactly which services have gaps in metrics, logs, traces, or k8s labels, and what to fix before the next incident.
grafana.com/blog/how-to-measure-and-improve-instrumentati… -
Grafana
@grafana
Grafana Assistant had 51 tool definitions eating ~54,500 tokens per agent turn. Two facade tools replaced them, dropping that to ~504 tokens — a 99.1% reduction with zero capabilities removed.
@kuqd explains how progressive tool discovery works.
medium.com/grafana-labs/progressive-tool-discovery-battli… -
Grafana
@grafana
🫡 Your teams deserve #observability that helps you work smarter (not harder), solve faster, and spend better.
See why Grafana Cloud consistently receives 5 stars on @Gartner_Peer review: gtnr.io/UkFNarxz8 -
Grafana
@grafana
🏔️ New milestone for Grafana Labs: $600M+ ARR and 10,000 customers worldwide.
And we're a 3x Leader in the Gartner® Magic Quadrant™ for Observability Platforms.
Thanks to our community for making the climb with us. Onward!
More from @businessinsider: www.businessinsider.com/grafana-labs-arr-600-million-ai-d… -
Grafana
@grafana
.@FloQast builds AI that accountants can trust — every layer of its platform is observable and auditable with Grafana Cloud, from SLOs and frontend signals to traces, incident investigations, and Agent telemetry.
grafana.com/success/floqast -
Grafana
@grafana
When should you use gcx? 💪
If Grafana Assistant is the brain & Grafana MCP is the easy hand, gcx is the power hand.
gcx gives AI agents working in the terminal access across Grafana Cloud, so they can pull telemetry, verify code, automate workflows & access places MCP doesn't.This media couldn't be displayed. See it on the original post. -
Grafana
@grafana
Your voice helps the Grafana community! 🗣️
Speak at one of our meetups — whether it's a lightning talk or a deep dive — and score an exclusive free t-shirt!
Submit your talk, take the stage, and receive your tee. Limit one per speaker: grafana.qualtrics.com/jfe/form/SV_4OQ9dzUAbSHfrAG -
Grafana
@grafana
When should you reach for Grafana MCP? ✋
It’s one of the two “hands” in Grafana’s AI toolkit — and the easy one at that.
MCP lets you bring Grafana into the tools you already use, like ChatGPT, Claude, or Cursor, without changing your workflow.This media couldn't be displayed. See it on the original post. -
Grafana
@grafana
🆕 Grafana 13.2 is out — saved queries are now GA in Grafana Cloud and Enterprise.
Build a shared query library your whole org can search, reuse, and provision via Terraform. New teammates, stop reverse-engineering dashboards and start shipping.
grafana.com/blog/grafana-13-2-release-all-the-latest-feat… -
Grafana
@grafana
“Should I use Grafana Assistant, Grafana MCP, or GCX?”
Yes.
They're not competitors — they play different roles.
🧠 Assistant = the brain
🙌 MCP + GCX = the hands
Let's start with the brain: what Grafana Assistant does, where it shines, and when you should reach for it.This media couldn't be displayed. See it on the original post. -
Grafana
@grafana
💸 Your AI is impressive. Your token bill might be too. Oops!
See how Grafana keep AI usage and spend visible, catch costly patterns early, and get more control over what’s hitting your budget. Plus, see Grafana Assistant in action.
events.grafana.com/cost-management-gnet-webinar?mdm=socia… -
Grafana
@grafana
"Collectively, these tools and capabilities are part of a larger effort to embed agentic AI capabilities more deeply across the Grafana Labs portfolio of data visualization and analytics tools and platforms." - @matryer
techstrong.ai/features/grafana-labs-embeds-agentic-ai-dee… -
Grafana reposted
Arnau García Gallego
@arnaugarcia97
@grafana is ❤️
-
Grafana
@grafana
Nowadays, you might not know the code diff the same way you would if you'd typed it all out yourself. 🧐
How do you maintain confidence in your code when coding agents have increased the speed of delivery, but the speed of understanding is falling behind? grafana.com/blog/telemetry-driven-development-how-to-gain… -
Grafana
@grafana
Troubleshoot faster. Reduce telemetry costs. Manage your incident response. What *can’t* Grafana do?
Read the five-star @Gartner_Peer review for this user’s POV.
gtnr.io/8GkwHER6i -
Grafana
@grafana
🚀 Public preview: Session Replay adds visual playback capabilities to Frontend Observability in Grafana Cloud.
It reconstructs how a web application appeared & changed as a user interacted with it, so you can observe the journey as it unfolded: grafana.com/blog/visual-playback-of-the-user-journey-intr… -
Grafana
@grafana
You: “Find that API latency thing.”
Grafana Assistant: *Surfaces the dashboard, alert, incident, and investigation*
You: "...yes."
Sometimes, “that API latency thing” is all you’ve got. -
Grafana
@grafana
😮💨 When something breaks, you want the dashboards, context, and the necessary workflows already there.
Bake observability in from day one using Grafana Assistant. Here's how from @svennergr.
grafana.com/blog/smarter-onboarding-and-planning-with-gra… -
Grafana
@grafana
Bookmark this.
🔖 This tweet contains prompts for you to use in Grafana Assistant. Check out the images or copy and paste from the thread.Post not available here, view on X
Grafana
@grafana
*Bulk dashboard updates and maintenance automation*
Update all panels in this dashboard to use [new_metric_name] instead of [old_metric_name].
Create a weekly automation that flags dashboards with panels returning no data.
Grafana
@grafana
In all dashboards in this folder, parameterize the data sources so I can switch between them easily.
-
Grafana
@grafana
#grafanaeverywhere, from space to healthcare, to the devices we wear.
@NeoSapienHQ co-founder & CEO Dhananjay Yadav shares how they use Grafana Assistant to ensure their privacy-first AI wearable delivers a reliable experience without compromising its mission.This media couldn't be displayed. See it on the original post. -
Grafana reposted
Ivana Huckova
@ivanahuckova
I put together a demo showing how to use @grafana Assistant ✨ with Amazon CloudWatch to explore metrics, generate queries, and build dashboards using natural language. The same workflow works across 30+ data sources, ...CloudWatch is just the example. www.youtube.com/watch?v=t4Gv0XFaOSI
-
Grafana reposted
Tom Rush
@tr4777
looking forward to: How to monitor AI agents in production with @grafana Agent Observability 08/12 1700 UTC grafana.com/go/webinar/how-to-monitor-ai-agents-in-produc… thanks G
-
Grafana
@grafana
We're building a better search experience in Grafana Assistant. See how we're designing Assistant Search to pull in the right context for your specific needs. medium.com/grafana-labs/search-but-deeper-how-grafana-ass…
-
Grafana
@grafana
AI agents use CLIs differently than people do. Learn how we built gcx, a CLI designed for AI agents to work with Grafana, and the engineering decisions that make agentic workflows more reliable and efficient. medium.com/grafana-labs/clis-in-the-age-of-agents-how-we-…
-
Grafana
@grafana
gcx brings Grafana Cloud and Grafana Assistant directly into your terminal — and to the agentic coding environment running inside it.
Spot and resolve incidents in minutes instead of hours. Learn more.
grafana.com/blog/get-observability-in-the-terminal-for-yo… -
Grafana
@grafana
CTW leveled up their observability with Grafana Cloud.
Their gaming platform now provides observability as a service for their customer studios.
They reduced metrics by 40% with Adaptive Telemetry and can now reinvest into other areas of the platform.
grafana.com/success/ctw/?mdm=social&src=tw -
Grafana
@grafana
#observability isn’t just for infrastructure anymore. With Grafana Cloud, teams can:
📈 Track campaigns in real time ️
🗺️ Understand geo performance
💪 Validate deployments with real user signals
Read the full 5-star review on @Gartner_Peer: gtnr.io/g3HyxbWWC -
Grafana
@grafana
We close AI Week with a focus on collaboration and accessing Assistant from anywhere.
Join the conversation on Reddit: www.reddit.com/r/grafana/comments/1vbv1lq/triage_incident…
Read about all this week's announcements: grafana.com/blog/ai-week-recap/?camp=blog&mdm=social&src=…
Learn more about AI in Grafana Cloud: grafana.ai -
Grafana
@grafana
Building agents is easy; trusting them is hard. Look back at Day 4 of AI Week, where we focused on trust and implementation, and the GA release of Agent Observability.
Go to grafana.ai to learn more.This media couldn't be displayed. See it on the original post. -
Grafana
@grafana
Gain confidence in the performance of your agents with Agent Observability, and see what we're doing to earn your trust with our AI tools.
Read more: grafana.com/blog/how-to-build-a-trust-platform-for-your-a…
Watch a demo: www.youtube.com/watch?v=YPfqchw8LCo
Learn more about AI in Grafana Cloud: grafana.ai -
Grafana
@grafana
Day 3 for AI Week focused on taking the operational load off your plate, with new features to help you investigate incidents faster and automate routine maintenance tasks. Check out the recap below, and go to grafana.ai for all of today's updates.
This media couldn't be displayed. See it on the original post. -
Grafana
@grafana
Add AI and still stay in control with Assistant Investigations (GA), Assistant Automations (GA), and Assistant Watchers (public preview).
Read more: grafana.com/blog/telemetry-driven-development-how-to-gain…
Watch a demo: www.youtube.com/watch?v=v0MBsmP7bbU
Learn more about AI in Grafana Cloud: grafana.ai
Grafana
@grafana
Once more with feeling … here’s the correct blog link: grafana.com/blog/automate-all-the-things-how-to-use-grafa…
-
Grafana
@grafana
Day 2 of AI Week at Grafana Labs was all about building and instrumentation. Check out our recap of all the news, and go to grafana.ai to learn more.
This media couldn't be displayed. See it on the original post. -
Grafana
@grafana
Gain confidence in your code and agents by using the gcx CLI tool and the Grafana MCP server, both of which are now generally available!
Read more: grafana.com/blog/telemetry-driven-development-how-to-gain…
Watch a demo: www.youtube.com/watch?v=1HzraMndn_E
Learn more about AI in Grafana Cloud: grafana.ai -
Grafana
@grafana
Bring AI conversations, visualizations, and investigation artifacts together with Assistant Workspace, now GA in Grafana Cloud.
Read more: grafana.com/blog/smarter-onboarding-and-planning-with-gra…
Watch a demo: www.youtube.com/watch?v=3eh2DPeO1nw
Learn more about AI in Grafana Cloud: grafana.ai?new -
Grafana
@grafana
“Meeting SLAs is achievable & enjoyable by running on Grafana.”
Faster recovery means having effective alerts that are paging the right teams.
⭐️⭐️⭐️⭐️⭐️. Read the full review on @Gartner_Peer: gtnr.io/U0SYhAVxR -
Grafana
@grafana
Grafana Cloud's source IP allowlists are moving to a single, structured JSON API. Here's everything you need to know about the change and next steps.
grafana.com/blog/a-new-allowlists-design-for-grafana-clou… -
Grafana
@grafana
With the new Grafana Cloud integration for Supabase, you can bring production-grade observability to your Supabase projects in a single click.
grafana.com/blog/grafana-cloud-supabase-one-click-integra… -
Grafana
@grafana
Synthetic Monitoring + Frontend Observability + k6 — three layers that catch what each other misses, from silent 2 AM regressions to real-user impact to load-induced failure.
grafana.com/blog/building-an-end-to-end-reliability-testi… -
Grafana
@grafana
🇯🇵 See you at #kubecon Japan soon! If you're headed there too, find us at booth S7.
Come and pick up swag, get your Kubernetes monitoring and agentic observability questions answered.
We've also got a few sessions on the schedule. See you in Yokohama. grafana.com/events/kubecon/?mdm=social&src=tw -
Grafana
@grafana
🚗 #observabilitycon on the Road is heading to cities around the world. Early bird registration is open! Save 30% for a limited time.
Preview AI-powered solutions, deepen your observability expertise, and drive bigger business impact.
Secure your spot: grafana.com/events/observabilitycon-on-the-road/?mdm=soci… -
Grafana
@grafana
This is what we mean by Big Tent. ⛺️
🤖 Grafana Assistant now queries across 30+ data sources — AppDynamics, Dynatrace, New Relic, Snowflake, MongoDB, and more — so you stop switching tabs and start getting answers fast.
grafana.com/blog/stop-switching-tools-to-find-answers-gra… -
Grafana
@grafana
Major reveals are coming. July 27–31.
-
Grafana
@grafana
🏆 The SD Times 100 for 2026 maps how autonomous ops is reshaping #observability — and we're proud @grafana is recognized as a foundational open platform the industry depends on!
Open standards, portability. That's the future. sdtimes.com/observability/autonomous-ops-observability-wa… -
Grafana
@grafana
🔑 Scaling Grafana Cloud access control for hundreds of users?
SSO for auth, SCIM for provisioning, RBAC for permissions — and no manual reconciliation.
Here's how.
grafana.com/blog/how-to-scale-access-control-in-grafana-c… -
Grafana
@grafana
⚽️ Real-time betting platforms are some of the hardest systems to operate.
Every signal matters when something goes wrong.
PointsBet chose Grafana Cloud to unify observability across its entire betting engine, from odds calculation to player accounts.
itbrief.com.au/story/pointsbet-picks-grafana-cloud-for-be… -
Grafana
@grafana
#observabilitycon 2026 registration is open! 🐦 Early birds, save 50% on your ticket.
Highlights:
🤖 Live demos of Grafana Cloud's latest agentic tools & workflows
💬 1:1 time with our engineers
🏆 Success stories
Space is limited. Reserve your spot: grafana.com/events/observabilitycon/2026/?mdm=social&src=tw -
Grafana
@grafana
📣 Grafana Labs is a 3x Leader in the Gartner® Magic Quadrant™ for Observability Platforms!
This is our 2nd year in a row placing furthest in Completeness of Vision.
See why 35M+ users & 7,000+ customers use Grafana Labs for observability in the AI era: grafana.com/analyst-reports/gartner-magic-quadrant-observ… -
Grafana
@grafana
Reflecting on that time we made a feature to help customers save money.
The story of building Grafana Labs is one of open source conviction and a focus on making observability accessible through innovations like Adaptive Telemetry & Grafana Assistant.
podcasts.apple.com/us/podcast/building-grafana-labs-and-t… -
Grafana
@grafana
🍿 Co-founder Anthony Woods recently spoke about building @grafana from the ground up and shaping the future of #observability.
This podcast episode with Kubernetes Bytes dives into the story behind Grafana Labs and where we're headed next. podcasts.apple.com/us/podcast/building-grafana-labs-and-t… -
Grafana
@grafana
📺 #grafanaeverywhere... even your favorite reality TV show.
@simon_prickett tracked every vote, murder, and banishment from The Traitors UK S4 — using SQL expressions in Grafana to join data across sources, with a Google Sheet.
medium.com/grafana-labs/tracking-the-traitors-tv-show-wit… -
Grafana
@grafana
🍿 Grab the popcorn & join Eric Burns from @AnthropicAI on the Big Tent podcast!
What he, @matryer & @tom_wilkie covered:
- Why Anthropic bet on running across every major cloud
- How agentic coding tools changed how software is built at Grafana Labs
🔗: youtu.be/-bxMP9lbHG4This media couldn't be displayed. See it on the original post. -
Grafana
@grafana
In January, we announced that Grafana Labs had assumed maintenance of the business intelligence plugins created by Volkov Labs, and committed to a six-month maintenance period.
Now, we're extending our maintenance commitment through the end of 2026.
grafana.com/blog/business-intelligence-plugins-for-grafan… -
Grafana
@grafana
In a world where AI agents are writing and deploying code, observability isn't optional — it's existential.
Our co-founder Anthony Woods joined @software_daily to talk about how @grafana's open source roots became our AI advantage.
Listen: softwareengineeringdaily.com/2026/07/02/grafanas-approach… -
Grafana
@grafana
Our CRO Dave Kranowitz shares what rowing taught him about building sales teams:
The best orgs aren't built on individual heroics, but on teams that move together!
At Grafana Labs, that means an ego-less selling motion where anyone can jump into a deal.
open.spotify.com/episode/2QBZIwRrl7Rf98ZiVtevXO?nd=1&dlsi… -
Grafana reposted
Chris Fidao
@fideloper
The Grafana assistant AI is the unsung hero of the AI era
-
Grafana
@grafana
☁️ Rapidly expanding your AI footprint? For a firm with $3.9T in assets? Grafana Cloud's AI Observability is the answer.
Philip Pencal, Head of SRE at @AlterDomus, shares why he recommends it to anyone using agents on a daily basis in their products.This media couldn't be displayed. See it on the original post. -
Grafana
@grafana
2x Golden Grot winner Ruben Fernandez shows how to trigger remote CLI commands — restarts, deployments, config changes — directly from a Grafana Cloud dashboard using canvas panel actions and a simple API endpoint.
medium.com/grafana-labs/how-to-run-remote-commands-from-g… -
Grafana reposted
Adrían Bridgwater✍⌨️
@ABridgwater
COMPUTER WEEKLY
What to expect from Grafana ObservabilityCON www.computerweekly.com/blog/CW-Developer-Network/What-to-… via @computerweekly @grafana -
Grafana
@grafana
Your voice helps the Grafana community! 🗣️
Speak at one of our meetups — whether it's a lightning talk or a deep dive — and score an exclusive free t-shirt!
Submit your talk, take the stage, and receive your tee. Limit one per speaker: grafana.qualtrics.com/jfe/form/SV_4OQ9dzUAbSHfrAG -
Grafana
@grafana
Grafana Labs engineer Colin Wood bridged compliance scanning and observability: cinc-auditor + Alloy + Grafana Cloud Logs = a live, auditor-ready Linux security dashboard for $0.
Treat your security posture like any other metric.
medium.com/grafana-labs/compliance-as-telemetry-building-… -
Grafana reposted
Syed Usman Ahmad
@usahmad87
💡𝗧𝗼𝗽𝗶𝗰: Your First OSS Contribution
🗓️𝗗𝗮𝘁𝗲: Friday 10th July
⏳𝗧𝗶𝗺𝗲: 2:30 PM CEST (12:30 PM UTC)
🔔Join us to understand the Importance of Open Source Software & how you can easily contribute as a new user!!
#opensource #grafana #community
www.meetup.com/grafana-friends-virtual-meetup-group/event… -
Grafana
@grafana
🤖 Grafana Assistant helps teams spend more time on the parts of observability that need them most & less on toil.
By democratizing observability, Grafana Assistant makes it easier to ask questions, understand systems, & get to answers faster. -
Grafana
@grafana
😁 Proud to see this five-star review for Grafana from a Healthcare IT leader.
Read the full review on @Gartner_Peer: gtnr.io/ZNA0d6opB -
Grafana
@grafana
NVH engineers at a major OEM were spending up to an hour finding the cause of a single noise anomaly. This #grafana dashboard — a 2026 Golden Grot Awards finalist — cut that to a single click.
medium.com/grafana-labs/digging-deep-into-sound-how-a-gra… -
Grafana
@grafana
A Grafanista built a #grafana-powered golf launch monitor with Raspberry Pi & Doppler radar because commercial options cost $30k or nickel-&-dime you on subscriptions.
OpenFlight is open source, measures ball speed, spin, carry — & has 450+ GitHub stars!
medium.com/grafana-labs/openflight-building-an-open-sourc… -
Grafana
@grafana
In case you missed it, last month we made some alerting changes to #kubernetes Monitoring.
This post explains what changed, why it happened, and steps to take.
grafana.com/blog/the-inside-scoop-on-alerting-changes-in-… -
Grafana
@grafana
Grafana Assistant has entered the chat 💬
Manychat helps businesses scale conversations across Instagram, TikTok, and Facebook — and with that kind of engagement volume, you need #observability that can keep up.
That's where Grafana Cloud comes in.
#grafanaeverywhereThis media couldn't be displayed. See it on the original post. -
Grafana
@grafana
#grafanaeverywhere means observability for the small & big moments — even the World Cup! 🤩
FOX Sports’ World Cup broadcast workflows include #grafana bringing observability to the complex systems behind the biggest football/soccer matches of the season.
www.sportsvideo.org/2026/06/14/fox-sports-ibc-presence-cr… -
Grafana
@grafana
📆 We're clearing up the system fog. AI for observability. Observability for AI. Solutions for all. Save the date for #observabilitycon 2026.
Sign up to receive an exclusive discount and early access to registration: grafana.com/events/observabilitycon/?camp=obscon2026&mdm=… -
Grafana
@grafana
💤 Grafana Cloud enabled Favor Delivery's SRE team to scale SLOs across 12 teams... and get more rest!
2 of every 3 incidents now detected internally, 30% fewer interrupts to the on-call SRE, and more here: grafana.com/events/obsessions/austin/how-favor-scaled-slo… -
Grafana
@grafana
📣 The #observabilitycon 2026 CFP closes July 1!
Talks will be 30 minutes in length and given in-person at the event. Speakers will receive free entry to the full event, plus access to a speaker gathering.
Apply: pretalx.com/observabilitycon-2026/cfp -
Grafana
@grafana
Cyvl maps potholes & road cracks for 500+ cities using LiDAR & #ai.
When their pipeline bursts overnight, Grafana IRM + Slack AI agents triage alerts autonomously via Grafana MCP. Adaptive Metrics cuts cloud costs 73%. That's the power of Grafana Cloud: grafana.com/success/cyvl/?mdm=social&src=tw -
Grafana reposted
Microsoft Azure
@Azure
.@Members1stFCU moved to Azure and needed enterprise-grade observability, fast. @Grafana via Microsoft Marketplace was up in half a day, accelerating time to value.
See how Grafana is putting this into action and explore more solutions on: marketplace.microsoft.com/en-us/This media couldn't be displayed. See it on the original post. -
Grafana
@grafana
GOOOOAAALLLL! ⚽️
A #worldcup dashboard with live match analysis, team tactical breakdowns, and player scouting profiles — and zero backend infrastructure.
Just the Infinity data source, a lot of jq, and some clever templating.
medium.com/grafana-labs/how-to-build-the-ultimate-fifa-wo… -
Grafana
@grafana
🗣️ When IT speaks in CPU utilization and response times, business leaders can't always act on it.
Grafana Champion Ting Lik Ming built an exec dashboard that bridged the IT and business gap — and got a sprint target approved in under a week. Here's how. medium.com/grafana-labs/when-it-speaks-business-leaders-f… -
Grafana
@grafana
🚀 Just shipped: Grafana 13.1!
This release expands observability as code, brings Grafana Assistant to more data sources, and streamlines the everyday workflows teams rely on to visualize, analyze, and act on their data.
grafana.com/blog/grafana-13-1-release-all-the-latest-feat… -
Grafana
@grafana
625,000+ members. 76 years of service. 0 tolerance for surprises.
Members 1st moved from on-premises to Microsoft Azure and made Grafana Cloud the heart of their observability all in one place.
Now they solve problems before members ever feel them.
www.youtube.com/watch?v=GH1sj_9v9XQ -
Grafana
@grafana
⚠️ On May 16, 2026, we confirmed a targeted attack by a cybercrime group that gained unauthorized access to our GitHub repositories and downloaded our codebase.
Here is the latest update about our investigations. grafana.com/blog/grafana-labs-security-update-latest-on-t…
Grafana
@grafana
Grafana
@grafana
Our review of the TanStack supply chain ransom incident confirmed it was limited to Grafana Labs’ GitHub environment.
No customer production systems were accessed, Grafana Cloud was not affected, and @Mandiant found no evidence of code tampering.
grafana.com/blog/post-incident-review-for-tanstack-npm-su… -
Grafana
@grafana
🚨 We recently discovered that an unauthorized party obtained a token with access to the Grafana Labs GitHub environment, enabling the threat actor to download our codebase. (1/6)
Post not available here, view on X
Grafana
@grafana
… we’ve determined the appropriate path forward is to not pay the ransom.
As part of Grafana Labs’ standard security practices, we will share additional information from our post-incident review when our investigations are complete. (6/6)
Grafana
@grafana
Grafana
@grafana
⚠️ On May 16, 2026, we confirmed a targeted attack by a cybercrime group that gained unauthorized access to our GitHub repositories and downloaded our codebase.
Here is the latest update about our investigations. grafana.com/blog/grafana-labs-security-update-latest-on-t…
Grafana
@grafana
Grafana
@grafana
Our review of the TanStack supply chain ransom incident confirmed it was limited to Grafana Labs’ GitHub environment.
No customer production systems were accessed, Grafana Cloud was not affected, and @Mandiant found no evidence of code tampering.
grafana.com/blog/post-incident-review-for-tanstack-npm-su… -
Grafana
@grafana
Our review of the TanStack supply chain ransom incident confirmed it was limited to Grafana Labs’ GitHub environment.
No customer production systems were accessed, Grafana Cloud was not affected, and @Mandiant found no evidence of code tampering.
grafana.com/blog/post-incident-review-for-tanstack-npm-su… -
Grafana
@grafana
.@AlterDomus runs observability for $3.9T in assets & uses Grafana Assistant to investigate.
Recently: latency in their internal AI chatbot (agents, MCP servers, RAG).
They used Grafana Assistant and within minutes: full report, root cause identified: grafana.com/success/alter-domus/?mdm=social&src=tw -
Grafana
@grafana
Creating performance tests just got faster.
With k6 Script Authoring in Grafana Assistant, describe what you want to test in natural language and get a production-ready k6 script in return.
Less setup. More time to improve reliability. grafana.com/blog/generate-test-scripts-from-natural-langu… -
Grafana
@grafana
Powerful observability stacks are:
✔ Cost-effective
✔ Interoperable
✔ Fast to value
This review captures why engineers in the manufacturing industry choose Grafana Cloud to scale their observability without lock-in. More from @Gartner_Peer: gtnr.io/3RNODxq2R -
Grafana
@grafana
How do you know your AI agent actually works — not just looks like it works?
Our approach: evaluation loops that test real tasks, measure tradeoffs, and use AI agents to improve both the Assistant and the evals themselves.
medium.com/grafana-labs/building-an-evaluation-loop-for-g… -
Grafana
@grafana
Claude and Codex can nail your Go and Rust, then mangle your Markdown.
Flint is a linter setup built to fix that — near-instant startup, lints only what changed, runs inside a container without Docker.
medium.com/grafana-labs/flint-a-linter-setup-that-doesnt-… -
Grafana
@grafana
🤝 Trust is everything especially when AI gets personal.
See how Golden Grot Award winner Dhananjay Yadav uses Grafana Assistant to help keep @neosapienHQ — a privacy-first AI wearable — seamless, reliable, and true to its mission.
#grafanaeverywhereThis media couldn't be displayed. See it on the original post. -
Grafana
@grafana
📣 We're accepting applications to speak at #observabilitycon 2026 until July 1!
Talks will be 30 minutes in length and given in-person at the event. Speakers will receive free entry to the full event, plus access to a speaker gathering.
Apply: pretalx.com/observabilitycon-2026/cfp -
Grafana reposted
Ivana Huckova
@ivanahuckova
Building AI agents? 🤖
At #grafanacon, Yas and I shared what we learned building @grafana AI Assistant. From context engineering to self-improvement loops with coding agents to AI observability in production.
Practical tips from our journey 👉 www.youtube.com/watch?v=Ec5xlCIggh4&list=PLDGkOdUX1UjoSfz… -
Grafana reposted
Rishi
@rishitwts_
Currently at GrafanaCON 2k26 Meetup!
Amazing energy in the room as we dive into new data sources, observability, and cloud-native talks
Who else is here? 👀
@grafanamumbai @grafana
#grafanacon #grafanacon2026 #mumbai -
Grafana
@grafana
"The new Assistant allows AI to spawn investigations when alerts fire. These agents do not just report errors. They analyse logs and traces to find root causes before humans step in."
Read more about Grafana Assistant in @enterprise_time.
www.enterprisetimes.co.uk/2026/05/12/grafanas-ai-shift-fr… -
Grafana
@grafana
gcx is a CLI that allows you and your AI coding agent structured access to both Grafana (dashboards, alert rules, data sources) & Grafana Cloud products.
Learn more from Grafana Champion Bhoopesh Sharma. www.youtube.com/watch?v=aWSsxdr8Dwo -
Grafana reposted
Ishan Jain
@ishan_jainn
My first conference talk was at DevOpsDays Cairo 2025. Back then, my goal was simple: speak at KubeCon.
Excited to share that I'll be speaking at #kubeconindia 2026 on Observability & Accountability for AI Agents.
See you on June 18!
Stop by the @Grafana booth (S13) and say hi -
Grafana reposted
Microsoft Partner
@msPartner
@grafana Cloud + Microsoft Marketplace = real growth
📈 +30% larger deals
⚡ 20% faster procurement
🚀 Live in half a day
This is what scalable, customer-ready solutions look like.
Watch 👇
www.youtube.com/watch?v=GH1sj_9v9XQ&list=PLLasX02E8BPCv2N…
#mspartner #msmarketplace -
Grafana
@grafana
Grafana Labs will be at #kubecon India 🇮🇳 — swing by booth #s13 to meet the team and grab swag.
Also catch Ishan Jain's session on AI agent observability with #opentelemetry on June 18.
grafana.com/events/kubecon/?mdm=social&src=tw -
Grafana
@grafana
🤖 AI for Observability. Observability for AI. Solutions for all at #observabilitycon 2026.
Sign up to be notified when early bird discount tickets go on sale: grafana.com/events/observabilitycon/?mdm=social&src=tw
Can't make it? Join us at a 1-day ObservabilityCON on the Road event at a city near you. -
Grafana
@grafana
💡 Learn how to visualize the #cheerlights IoT project in Grafana Cloud using the Infinity data source and JQ parser — current color, previous states, and data freshness, all without a database.
medium.com/grafana-labs/lighting-up-your-dashboards-an-up… -
Grafana
@grafana
A Grafanista built a Disney wait time dashboard in Grafana Cloud using only free APIs, the Infinity plugin, and Grafana Assistant — no code required.
SRE principles meet the Magic Kingdom.
medium.com/grafana-labs/mastering-a-day-at-disney-how-to-… -
Grafana
@grafana
Save the date.
#observabilitycon 2026. Oct 19-21.
AI for Observability.
Observability for AI.
Solutions for all.
Join us in San Francisco!
Register to get early access to 50% discount tickets: grafana.com/events/observabilitycon/?src=sdr&mdm=social&c… -
Grafana
@grafana
"In a software system, observability helps you understand why something broke. In a business system, it can help you understand why something worked."
Co-founder Anthony Woods Forbes discusses observability's shift from engineering to business in Forbes.
www.forbes.com/councils/forbestechcouncil/2026/05/06/obse… -
Grafana
@grafana
🔍 Grafana Assistant Investigations (public preview in Grafana Cloud) lets you run "human on the loop" auto-remediation workflows at scale.
Find root causes, raise PRs, correlate business metrics with telemetry, and loop in teammates mid-incident.
grafana.com/blog/automatically-discover-and-remediate-roo… -
Grafana
@grafana
LLMs can confidently name an incident's root cause — then spend every subsequent turn defending the wrong answer.
Grafanista Alexander Sniffin talks about the "smoking-gun" problem and how #grafana Assistant Investigations is built to fight it.
medium.com/grafana-labs/inside-the-harness-how-grafana-as… -
Grafana
@grafana
Building AI Agents?
The context window can easily get bloated with unnecessary context.
This video demos "Context Offloading," a solution that stores the JSON result and sends only the summary of the JSON blob to keep your context window small: www.youtube.com/watch?v=iUHnys9oTmM -
Grafana
@grafana
"Telemetry gets expensive at scale — but the value plateaus."
Co-founder Anthony Woods explains why 74% of observability buyers rank cost as a top vendor criterion — and how Adaptive Telemetry helps teams cut their telemetry bills by up to 50%.
itbrief.com.au/story/grafana-turning-data-chaos-into-deve… -
Grafana
@grafana
⚽️ How does actually useful AI help you achieve your observability goooaaalllsss?
Join us at a World Cup watch party for food & drink, a look on how Grafana Cloud's agentic AI systems are transforming observability, and the excitement of watching a match: events.grafana.com/grafana-worldcup?mdm=social&src=tw -
Grafana
@grafana
🆕 Grafana AI Observability is our new solution for observing AI agents!
Over the past year at Grafana Labs, we built agents & needed a way to understand their performance, the costs, error rate, etc.
Watch this demo to see AI observability in action: youtu.be/MFai008Ze84 -
Grafana
@grafana
🤖 Grafana Assistant is going places you might not expect — including healthcare.
Golden Grot winner Oren Lion from @TeleTracking shares how they use Grafana Cloud to support systems that keep patient care moving.
From the moon to patient care, it's #grafanaeverywhere.This media couldn't be displayed. See it on the original post. -
Grafana
@grafana
Real user experience problems — slow loads, layout shifts, unresponsive interactions — are easy to miss until they're bad 😱
Grafana Cloud Frontend Observability's Core Web Vitals dashboard helps you catch them early.
grafana.com/blog/how-to-analyze-core-web-vitals-in-grafan… -
Grafana
@grafana
😱 Your load test passes. Production falls over at 6 p.m. Tuesday anyway.
Pull real request rates & latency distributions from Grafana Cloud and feed them directly into your k6 scenarios — test against patterns your system actually sees, not assumptions.
grafana.com/blog/how-to-generate-real-world-load-tests-us… -
Grafana
@grafana
👀 Simulate real user flows (login, checkout, nav) across devices and locations before issues hit your users.
We recently GAed browser checks in #grafana Cloud Synthetic Monitoring.
grafana.com/blog/optimizing-the-end-user-experience-how-t… -
Grafana
@grafana
$12M ARR. 3 new business lines. 1 observability stack. Developer-led.
That's what @circleslifesg built on Grafana Cloud after their legacy observability tool started requiring more headcount for every new market launch.
Learn more: grafana.com/success/circles-life/?mdm=social&src=tw -
Grafana
@grafana
Grafana dashboards used to mean maintaining near-duplicate copies for every role and use case.
Dynamic dashboards — tabs, conditional visibility, a rebuilt editing UI — shipped in Grafana 13 to fix that. Here's how we got there.
medium.com/grafana-labs/rethinking-grafana-for-growing-te… -
Grafana
@grafana
#java + #ebpf + #tls is genuinely hard.
The OBI project had to rethink what "eBPF-only" even means to instrument Java clients making encrypted connections — no JVM flags, no code changes, no agent injection.
medium.com/grafana-labs/instrumenting-java-over-tls-with-… -
Grafana
@grafana
😱 @JustEatTakeaway rebuilt their load testing practice after an outage from an untested EC2-to-EKS migration.
Now they run #k6 in production — 1,100+ platform changes validated weekly across 16 countries.
grafana.com/events/observabilitycon-on-the-road/toronto/h… -
Grafana
@grafana
Update: Our internal investigation is complete & confirms our initial findings — there was no unauthorized access to customer production systems or Grafana Cloud. We’ve engaged @Mandiant to conduct an additional audit, and we’ll share information from our PIR in the coming weeks.
Grafana
@grafana
⚠️ On May 16, 2026, we confirmed a targeted attack by a cybercrime group that gained unauthorized access to our GitHub repositories and downloaded our codebase.
Here is the latest update about our investigations. grafana.com/blog/grafana-labs-security-update-latest-on-t…
Grafana
@grafana
Should we ever determine that our customers' systems or operations have been impacted, we will notify them directly.
-
Grafana
@grafana
🚀 Tempo 3.0 is out — new Kafka-compatible architecture splits read and write paths, drops RF3 replication to a single copy, and ships TraceQL metrics as GA.
One copy of your trace data instead of three. Lower TCO. Independent scaling.
grafana.com/blog/tempo-3-0-release-all-the-latest-feature… -
Grafana
@grafana
🏡 MarshallZehr CTO Nicholas Armstrong built a proactive observability practice from scratch using Grafana Cloud.
The result? Detecting anomalies before they become user-facing failures and a clear competitive advantage in mortgage finance: grafana.com/success/marshallzehr/?mdm=social&src=tw -
Grafana
@grafana
Managing #grafana Cloud Synthetic Monitoring checks as code with #terraform:
Version control, consistent configs across environments, and no more UI drift!
grafana.com/blog/how-to-manage-synthetic-monitoring-check… -
Grafana
@grafana
⏰ Automations in Grafana Assistant (public preview) let you schedule a working prompt or skill and get the answer waiting for you — before standup, before handoff, before the review.
Say no more to running the same AI prompts by hand every morning.
grafana.com/blog/spend-less-time-on-repetitive-tasks-with… -
Grafana
@grafana
“Bottom line: this is the dream come true. If you live in Grafana, the Assistant is already there in the UI.
If you’ve moved to a coding agent like Claude Code, OpenCode, or Cursor, the Grafana MCP is exactly what you need, including the Assistant on tap... Strongly recommend."
Viktor Farcic
@vfarcic
The gap between 'something broke' and 'I know what's wrong' just got much smaller. AI agents reading your metrics, logs & traces directly = faster incidents, less tab-switching. ⚡
youtu.be/HI6KleJAZPY
#grafana #aiobservability #claudecode -
Grafana
@grafana
📣 Grafana Labs has been named to @Redpoint's 2026 #infrared100!
That's 4 years in a row on Redpoint's list of private companies shaping the future of AI and infrastructure.
And 4 years of open observability featured in Times Square.
See the full list: www.redpoint.com/infrared/report/ -
Grafana
@grafana
Your AI agent can now query real-time production telemetry from #grafana — without bloating your context window.
GCX gives agents like Claude Code, Codex, and Gemini the context they need, only when they need it.This media couldn't be displayed. See it on the original post. -
Grafana
@grafana
Cloud Provider Observability in Grafana Cloud now lets you swap in your own dashboards, generate new ones with AI, and customize per-instance drill-down panels for AWS, Azure, and Google Cloud — all without leaving the app.
grafana.com/blog/customize-preconfigured-views-for-aws-az… -
Grafana
@grafana
In case you missed it:
Pyroscope 2.0 is a ground-up rearchitecture of the open source continuous profiling database — cheaper at scale, simpler to operate, with native OTLP profiling support.
grafana.com/blog/pyroscope-2-0-release/?camp=blog&mdm=soc… -
Grafana
@grafana
Grafana Assistant in Database Observability doesn't just show you what's slow — it tells you why, using your actual schemas, execution plans, and live Prometheus + Loki data.
No copy-pasting queries into a separate AI tool.
grafana.com/blog/troubleshoot-performance-issues-faster-w… -
Grafana
@grafana
🫳 #grafanacon 2026 talks are available on demand! Just in time for some weekend viewing.
Don't miss talks like:
• GrafanaCON 2026 Keynote
• New #opentelemetry engine
• k6 2.0
• Planet-scale dashboards at Google
And more that won't fit in this tweet: grafana.com/events/grafanacon/ -
Grafana
@grafana
We're headed to #o11ysummit North America next week!
Stop by our booth, grab swag, and see talks from Grafanistas:
☕️ eBPF application instrumentation for Java: Stephen Lang & Endre Sara (our partner from Causely)
🤖 Exploring Observability with MCP Servers: Tiffany Jernigan -
Grafana
@grafana
Adaptive Logs drop rules are now in public preview — drop health checks, sample chatty DEBUG logs, or silence a noisy service before it hits Grafana Cloud Logs. No infra change management required.
grafana.com/blog/eliminate-noisy-log-lines-with-adaptive-… -
Grafana
@grafana
🎓 Applications are open for the Emerging Champion Mentorship Program 2026 cohort. And this year, we're opening it up to students!
This program is designed to help individuals grow into impactful thought leaders in the Grafana community.
Apply by May 25: docs.google.com/forms/d/e/1FAIpQLSck9kEPrqber04mxqcX9OU1Z… -
Grafana
@grafana
Self-managed Grafana? Meet Grafana Assistant 👋
It's quick to access, easy to set up, and built to help teams accelerate every stage of #observability. Shawn Pitts shares how to get started.
Learn more: grafana.com/blog/grafana-assistant-everywhere/?camp=blog&…This media couldn't be displayed. See it on the original post. -
Grafana
@grafana
Along with #grafana 13, we announced a rebuilt #loki engine with queries up to 10x faster on aggregated data, and Git-based dashboard workflows.
Learn about the new Loki architecture.
www.enterprisetimes.co.uk/2026/04/21/grafana-13-loki-reva… -
Grafana reposted
Torkel Ödegaard
@torkelo
Grafana feature POC, dashboard "View panel" view with controls to split panel into multiple by series or by label. Toggle some viz options like legend or stacking. Toggle queries on/off.
Would any @grafana users find this useful? please comment on github.com/grafana/grafana/pull/124789 -
Grafana
@grafana
✨ #observability is about turning operational data into action and resolution.
That’s where Grafana Cloud shines.
Read the full review from @Gartner_Peer: gtnr.io/2DYNt1G95 -
Grafana
@grafana
We're targeting the AI blindspot in observability — monitoring agent inputs, outputs, and execution flows in real time, with policy violation detection before it hits users.
Read about our AI announcements from @Enterprise_Time.
www.enterprisetimes.co.uk/2026/04/21/grafana-labs-targets… -
Grafana
@grafana
🧠 Did you know? AI Observability is now in public preview on Grafana Cloud!
Monitor your agentic workloads the same way you monitor everything else: traces, tool calls, token usage, costs, and live evaluations in one place.
grafana.com/blog/ai-observability-for-agents-in-grafana-c… -
Grafana
@grafana
The Grafana Labs AI AMA is starting in 1 hour.
Ask your questions about Grafana Assistant, Investigations, AI Observability, the new Grafana Cloud CLI, and even our engineering philosophy around AI: www.reddit.com/r/grafana/s/3TNrxZFcbs -
Grafana
@grafana
.@OptroHQ used Grafana Assistant to turn #observability into self-service — engineers and support teams now investigate issues independently, reducing escalations and speeding up resolution.
Learn more: grafana.com/success/optro-grafana-assistant/ -
Grafana
@grafana
We open sourced o11y-bench: a benchmark for evaluating #ai agents on real observability workflows —
querying metrics, logs, traces, incident investigations, and dashboard edits against a live Grafana stack.
grafana.com/blog/o11y-bench-open-benchmark-for-observabil… -
Grafana
@grafana
ICYMI: Grafana 13 is here — unveiled at #grafanacon 2026 in Barcelona.
Suggested dashboards, smarter viz recommendations, saved queries, and tools to operate at scale.
grafana.com/blog/grafana-13-release-all-the-latest-featur… -
Grafana
@grafana
Before dashboards, alerts, and traces, there was mom with her intuitive observability system:
- Detects anomalies instantly
- Correlates signals across rooms, siblings, & suspicious silences
- Escalates with precision
#happymothersday to the original incident responders! 💐 -
Grafana
@grafana
Have questions about the Grafana Cloud CLI (GCX), Grafana Assistant, AI Observability, or how our teams are thinking about AI in general?
Ask your question in an upcoming AMA with the AI team. The AMA is happening on May 12 from 9am-12pm ET: www.reddit.com/r/grafana/s/3TNrxZFcbs -
Grafana
@grafana
AI agents behave nothing like traditional software — and they need a new kind of observability.
At #grafanacon 2026 we launched AI observability in Grafana Cloud, treating agent sessions and LLM conversations as first-class telemetry signals.
siliconangle.com/2026/04/21/grafana-trying-close-ai-obser… -
Grafana
@grafana
The University of Iowa migrated from a self-hosted #grafana OSS setup to Grafana Cloud.
The result?
- Active series: ~4,000
- Observability costs: down 98%
- Single pane of glass across on-prem & #aws
A 3-person team. Full coverage. Boom.
Read more: grafana.com/success/iowa/?mdm=social&src=tw -
Grafana
@grafana
Announced at #grafanacon:
- Loki gets a Kafka-backed ingestion layer (up to 20x less data scanned, 10x faster aggregated queries)
- A new CLI, GCX, surfaces Grafana Cloud data inside Claude Code, Cursor & Copilot
Read more from @InfoQ. www.infoq.com/news/2026/04/grafana-loki-ai-agents/ -
Grafana
@grafana
#ai in production needs more than traditional monitoring.
At #grafanacon 2026, our Sr. Director of Product Jen Villa discussed how AI Observability treats prompts, responses, and agent execution paths as first-class observable signals.
itbrief.com.au/story/exclusive-grafana-lab-s-jen-villa-on… -
Grafana
@grafana
95% of #observability practitioners want #ai to explain its reasoning.
The most common barrier to AI adoption isn't cost or complexity. It's too much manual context required just to make it useful.
Black box AI doesn't fix alert fatigue. It compounds it: www.apmdigest.com/explainability-new-battleground-ai-powe… -
Grafana reposted
Dhananjay Yadav
@imDhananjay
Showcasing Neo 1 at GrafanaCon Barcelona was a proud moment.
We were the only company from India, and the only wearable in the room.
It’s been intense hard work by the entire team at @neosapien_xyz to build best-in-class AI observability. A small team, building something truly meaningful. -
Grafana
@grafana
The #grafanacon 2026 festivities aren't over. We're bringing the keynote recap, lightning talks, and bites to a meetup near you!
This is a 2-hour community meetup where you can connect with other observability experts in your area. Join us and discuss: grafana.com/events/grafanacon-local/ -
Grafana
@grafana
"We're allergic to false claims... We really need to make sure this stuff is actually useful and provides real value. And we're confident that it does." - @nopzor
Catch the #grafanacon 2026 keynote recording & see how open observability is evolving: youtube.com/live/UazoZQHW0kI -
Grafana
@grafana
💸 💸 ➡️ 💰💰
@Gopuff cut observability costs 40% with Grafana Cloud — LGTM stack, Adaptive Telemetry for cardinality control, and k6 for proactive load testing across 500+ microservices.
Watch their talk from #observabilitycon on the Road New York:
grafana.com/events/observabilitycon-on-the-road/new-york-… -
Grafana
@grafana
A long time ago, in a production environment far, far away…
Someone said, “We can stitch our #observability stack and agentic workflows together later.”
It was, in fact, a trap.
This #maythe4th, bring actual order to observability with #grafana.
See 🧵 for more memes!Post not available here, view on X
Grafana
@grafana
Grafana
@grafana
Grafana
@grafana
Grafana
@grafana
-
Grafana
@grafana
Being able to access #grafana via the command line and manage your observability as code is great, but...
The real power of gcx shines through when you give your agents access to it.
Learn more about the new Grafana Cloud CLI: grafana.com/blog/get-observability-in-the-terminal-for-yo…This media couldn't be displayed. See it on the original post. -
Grafana
@grafana
Secrets management is now available in Grafana Cloud k6!
Store API keys and credentials centrally, inject them at runtime, and keep them out of your scripts and version control.
grafana.com/blog/introducing-secrets-management-for-grafa… -
Grafana
@grafana
Happy Friday, indeed. The photos from #grafanacon 2026 are now available on our Flickr!
Re-experience the memories and vibes from Barcelona: www.flickr.com/photos/200539808@N03/albums/72177720333412718
See you at the next one 👋 -
Grafana
@grafana
Grafana 13 ships Git Sync as GA!
Save dashboards directly to GitHub, GitLab, or Bitbucket, open a PR from the Save button, and sync changes back automatically.
grafana.com/blog/git-sync-grafana/?camp=blog&mdm=social&s… -
Grafana
@grafana
Grafana Assistant builds a persistent knowledge base of your infrastructure before you ask your first question:
Services, dependencies, metrics, log formats — so you skip straight to troubleshooting when an alert fires.
grafana.com/blog/how-grafana-assistant-learns-your-infras… -
Grafana
@grafana
🔥 Say hello to Pyroscope 2.0!
This is a ground-up rearchitecture of our open source continuous profiling database — designed to be more cost-effective at scale, simpler to operate, and with native #otlp profiling support built in.
grafana.com/blog/pyroscope-2-0-release?camp=blog&mdm=soci… -
Grafana reposted
Tristan Rhodes
@tristanbob
Even though it CAN be used with the self-hosted opensource version, you should know that @Grafana Assistant is still a metered service hosted on Grafana Cloud.
The free version currently includes 200 messages/user/month, which seems quite generous.
Have you used the Grafana Assistant yet?
Grafana
@grafana
📣 ICYMI: You can now access Grafana Assistant in self-managed environments!
See why the feedback has been so strong. No hype. Just actually useful #ai.
Get started: youtu.be/0O0ZqrruGns -
Grafana
@grafana
🔌 Grafana Marketplace is live in pilot!
This is a new platform for ISVs and developers to sell and distribute plugins, with guarantees for updates and support.
∙ The Marketplace is entirely opt-in
∙ Free plugins aren't going anywhere
grafana.com/blog/grafana-marketplace-pilot/?pg=blog&camp=… -
Grafana reposted
La Eternauta 💻
@la_eternaut
No puedo con tanta belleza! Amo @grafana
-
Grafana
@grafana
Have questions about Grafana Assistant, AI observability, gcx, or how our team thinks about AI overall?
We're running an AMA on Reddit with a few folks from the AI team!
Join us on May 12 at 9 am ET. Or drop your question(s) if you can't make it!
🔗: www.reddit.com/r/grafana/comments/1sygzi0/hi_reddit_were_… -
Grafana
@grafana
📣 Introducing the official Grafana Cloud CLI. Meet gcx! 📣
gcx (public preview) brings Grafana Cloud into your terminal so agentic tools like Cursor and Claude Code can read actual production state — traces, SLOs, burn rates — instead of guessing.
grafana.com/blog/get-observability-in-the-terminal-for-yo… -
Grafana reposted
Ivana Huckova
@ivanahuckova
#grafanacon was SO good 🤗 I talked about Grafana Assistant and our new AI Observability and the feedback was incredible. What we shipped: 🔍 AI Observability in public preview 🤖 Assistant now available in OSS & self-managed Grafana 📊 o11y-bench, our OSS benchmark for AI agents
-
Grafana
@grafana
Grafana Labs 🤝 Google
We’re proud to partner with Google to offer internal #observability and support their planet-scale dashboards!
See what makes this a partnership with strong signal.This media couldn't be displayed. See it on the original post. -
Grafana
@grafana
📣 We're open sourcing o11y-bench, a benchmark for evaluating AI agents on observability workflows.
Built on Harbor, it runs agents against a Grafana stack w/ access to our MCP server & grades them on a set of observability tasks within that environment. grafana.com/blog/o11y-bench-open-benchmark-for-observabil… -
Grafana reposted
Kunal Kushwaha
@kunalstwt
Loki has always been known as the budget-friendly alternative for logging.
However, with the Kafka-backed ingestion and Logline acquisition announced at @grafana CON, the project is moving into much more powerful territory.
I asked @torkelo if Loki is becoming a heavy analytical database, or if it can actually stay cheap and light while getting these performance boosts.
Here is his answer.This media couldn't be displayed. See it on the original post. -
Grafana
@grafana
✨ What goes on when Claude Code is flibbertigibbeting?
Join us, @awscloud & @AnthropicAI for a workshop on AI-assisted software development.
Get hands-on with #claudecode and learn how to monitor your agents using AI Observability in Grafana Cloud: aisoftdevwithclaude.splashthat.com -
Grafana
@grafana
Grafana. Everything. Everywhere. All at once 🌍
This week, Grafana showed up wherever builders are working — across cities, clouds, teams, infrastructure, apps, AI agents, and LLM-powered workflows.
Because #observability is everywhere.
And so is #grafana.
#grafanaeverywhere -
Grafana
@grafana
🧡 GrafanaCON isn’t just about what we’re building.
It’s about who we’re building it with.
The connections, community stories, and the energy of builders coming together from around the world.
Thank you to everyone who made #grafanacon 2026 what it was.
'Til next time 🧡This media couldn't be displayed. See it on the original post. -
Grafana
@grafana
Bumping into new friends at #grafanacon 2026 be like:
This media couldn't be displayed. See it on the original post. -
Grafana
@grafana
Meet the 2026 Golden Grot winners!
🏆 Oren Lion, Jackson Sweeney, Mohamed Adem & Dhananjay Yadav
AI in hospital patient logistics. A lunar lander thermal dashboard. An aurora visibility tracker. AI observability for privacy-first wearables: grafana.com/blog/grafanacon-2026-announcements/?pg=blog
#grafanacon -
Grafana
@grafana
“But can it run Doom?” 🤔
TamaGROTchi is one of the projects from a recent Hackathon, featured at the #grafanacon 2026 Science Fair. -
Grafana
@grafana
📣 ICYMI: You can now access Grafana Assistant in self-managed environments!
See why the feedback has been so strong. No hype. Just actually useful #ai.
Get started: youtu.be/0O0ZqrruGns -
Grafana
@grafana
🤔 Who says 13 is unlucky?
#grafana 13 gives our community the most flexible & intuitive Grafana experience yet:
- Suggested dashboards
- Grafana Assistant accessible in Grafana OSS & Enterprise
- Git Sync GA
- Dynamic Dashboards GA; & more
#grafanacon
grafana.com/blog/grafana-13-release-all-the-latest-featur… -
Grafana reposted
Kunal Kushwaha
@kunalstwt
Nearly 40% of teams still find observability far too complex.
I asked @grafana creator @torkelo how the project stays approachable for a developer who needs a dashboard in five minutes without slowing down the SRE power-user who manages everything as code.
Here is how Grafana handles that balance.This media couldn't be displayed. See it on the original post. -
Grafana reposted
Angelo Conforti
@angeloxx
Thanks to @grafana and the #grafanacon workshop on advanced dashboarding for introducing me to the Tab layout in Grafana 13 (I was stuck on v9). With one click, my Garmin dashboard became much more usable, simply by switching from Rows to Tabs.
-
Grafana reposted
Beto Muniz
@obetomuniz
With AI Observability in Grafana Cloud, your AI is no longer a black box #grafanacon
Grafana
@grafana
But wAIt... one more thing 😉
@matryer & @svennergr have unveiled #ai Observability in Grafana Cloud (public preview)!
Observe #agent behavior, tool calls, and token-level conversation detail. Online evals with alerting built in.
🔗: grafana.com/blog/ai-observability-for-agents-in-grafana-c…
#grafanacon -
Grafana reposted
BC Gain
@bcamerongain
Used Claude Code to to select, configure and manage a @grafana plugin with @code at the #grafanacon workshop AI inception: Using AI to build a Grafana plugin I that uses AI Experience firsthand how to use large language models (LLMs). @grafana @thenewstack @AnthropicAI
-
Grafana reposted
BC Gain
@bcamerongain
.@grafana co-founders CEO Raj Dutt
and CGO @Torkelo Ödegaard close today's #grafanacon 2026 keynote with a look at the evolution of metrics. Amazing how much observability has changed. I wonder what it will look like in five years. @Grafana @nopzor grafana.com/events/grafanacon/agenda/ -
Grafana reposted
BC Gain
@bcamerongain
How a popular hacking tool can expose and access an open source project's secrets, as @grafana 's Nick Moore and David Andersson explain during "Lessons from that security incident when everything went wrong (but ended up right)" at #grafanacon 2026. grafana.com/events/grafanacon/agenda/
-
Grafana reposted
BC Gain
@bcamerongain
Faster and smarter Loki log data , @Grafana says. We will also see the use of a Bloom filters (interesting mathematical concept) to help find that "needle in the haystack." For scaling distributed systems, Kafka will support Loki at #grafanacon 2026. grafana.com/events/grafanacon/agenda/
-
Grafana reposted
Annanay
@mrannanay
A new interface for Grafana Cloud just dropped - Grafana Cloud CLI!
Super excited to have helped ship this. Check it out here - github.com/grafana/gcx
Getting started is as simple as `gcx auth login` and you can then fire away with Claude Code.
@grafana #grafanacon -
Grafana reposted
Gerard de Jong
@GDdeJong
So excited to be speaking at #grafanacon tomorrow!
-
Grafana
@grafana
We announced several AI innovations at #grafanacon 2026, but what’s the mindset and philosophy behind how and what we release?
Join the #ai team (@matryer, Maurice Rochau, and @svennergr) to hear their perspectives and learnings in this livestream.
www.youtube.com/live/Nwaoq4_Nnl0 -
Grafana
@grafana
🆕 Announced at #grafanacon: You can now access Grafana Assistant in self-managed environments!
🔸 Access via Slack, Teams, or CLI
🔸 Build custom Skills
🔸 Auto-remediation pipelines
grafana.com/blog/grafana-assistant-everywhere?camp=blog&m… -
Grafana
@grafana
We've been cookin'... 🍳
#grafana 13.
Loki evolution.
Grafana Assistant for self-managed users.
#ai Observability in public preview.
We can't fit all of the #grafanacon 2026 announcements in 1 tweet!
See them all: grafana.com/blog/grafanacon-2026-announcements/?camp=blog… -
Grafana
@grafana
🧡 And that’s a wrap on the #grafanacon 2026 keynote!
We hope you’re all just as excited about everything we announced as we are.
Thanks to those who joined us!
If you want to relive the experience, watch the keynote recording here: www.youtube.com/live/UazoZQHW0kI -
Grafana
@grafana
But wAIt... one more thing 😉
@matryer & @svennergr have unveiled #ai Observability in Grafana Cloud (public preview)!
Observe #agent behavior, tool calls, and token-level conversation detail. Online evals with alerting built in.
🔗: grafana.com/blog/ai-observability-for-agents-in-grafana-c…
#grafanacon -
Grafana
@grafana
🎉 Introducing GCX — the official Grafana Cloud CLI!
GCX brings the full power of Grafana Cloud and the Assistant to your command line..
…and more importantly to your agentic coding environments.
Public preview now: github.com/grafana/gcx
#grafanacon -
Grafana
@grafana
Grafana Assistant has been ALL the rage.
Live at #grafanacon, @svennergr just announced that self-managed #grafana users can now use and access Grafana Assistant!
🔗: grafana.com/blog/grafana-assistant-everywhere?camp=blog&m…
Grafana
@grafana
-
Grafana
@grafana
Introducing Integrated OpenTelemetry, a new way to instantly & consistently install #opentelemetry everywhere.
Using #k8s? We’ve had an #otel Operator for a while!
Now we're focused on Linux, but once we've stabilized things, we plan to look at Windows & Mac next. #grafanacon -
Grafana
@grafana
Announced at #grafanacon — the Grafana Marketplace!
We have 170 data sources in our catalogue, and we believe there's room for more.
We're piloting a marketplace for plugins with a group of select partners, who've built some of your most requested apps: grafana.com/blog/grafana-marketplace-pilot/ -
Grafana
@grafana
👀 A first look at #grafana 13!
Dynamic dashboards GA. Responsive.
Git Sync is GA. 2-way dashboard-as-code!
New gauge panel update.
Partnering with Google to offer Grafana visualization capabilities for internal #observability.
🔗: grafana.com/blog/grafana-13-release-all-the-latest-features/
#grafanacon -
Grafana
@grafana
The #grafanacon keynote is in full swing and we’re about to unveil #grafana 13.
Tune in now👇
Grafana
@grafana
📣 You don’t have to be here to *be* here! The #grafanacon 2026 keynote is happening today.
Watch live and catch every major reveal as they happen.
👉 The keynote starts at 9 am CET. Join here: grafana.com/events/grafanacon/?mdm=social&src=tw -
Grafana
@grafana
"35M+ Grafana users.
Over 99% of them are open source users.
That’s intentional. We give away most of the value and capture only a fraction — it’s part of our DNA, and part our business model."
- @nopzor at #grafanacon -
Grafana
@grafana
"For Grafana Labs as a company and for our projects, open is our strategy.
And it is more than open source. It's about open standards — standards like #opentelemetry, open ecosystems like #prometheus & Loki.... An open culture is also very important."
- @torkelo at #grafanacon -
Grafana
@grafana
#grafanacon 2026 is live!
Or as our friends in Barcelona would call it: GrafanyaCON!
@torkelo and @nopzor are kicking us off.
Did you know #grafana was born in Barcelona? 🇪🇸
True story: In 2013, Torkel was in Barcelona with a cold — coding and working on Grafana...This media couldn't be displayed. See it on the original post. -
Grafana
@grafana
📣 You don’t have to be here to *be* here! The #grafanacon 2026 keynote is happening today.
Watch live and catch every major reveal as they happen.
👉 The keynote starts at 9 am CET. Join here: grafana.com/events/grafanacon/?mdm=social&src=tw -
Grafana reposted
Mehul Patel 🇮🇳 🇩🇪
@NomadicMehul
BTS from my interview at #grafanacon 26! 🎥 Can’t wait to share the full conversation soon.
The energy in Barcelona is unreal! Pumped for 2 more days of innovation in the observability space. 🚀
Are you here? Let’s connect! 👇
#grafana #observability #techcommunity -
Grafana reposted
Yoshi Yamaguchi
@ymotongpoo
このハンズオン、OBIもちゃんと使うからいいんだよな #grafanacon
-
Grafana reposted
Yoshi Yamaguchi
@ymotongpoo
ハンズオンはじまりました〜。ここから3時間、OpenTelemetryのハンズオンです。これ、コンテンツはあるから日本でもやりたいなー #grafanacon
-
Grafana
@grafana
🙏 A heartfelt thanks goes to @AnthropicAI for sponsoring the #ai inception hands-on lab today!
Can't make it? The keynote's happening tomorrow. Don't miss the livestream: grafana.com/events/grafanacon/agenda/keynote/?mdm=social&… -
Grafana
@grafana
🎉 It's April 20, 2026! You know what that means...
#grafanacon 2026 begins today!
Thank you to @awscloud, our biggest sponsor this year. We couldn't do this without you.
Don't miss the keynote livestream tomorrow: grafana.com/events/grafanacon/agenda/keynote/?mdm=social&… -
Grafana
@grafana
🙌 #grafanacon 2026 begin tomorrow!
Our largest community event wouldn't be possible without... our community!
And that includes this year's sponsors.
Thank you, @awscloud, @googlecloud, @clickhouse, @cribl_io, @tigerdatabase, and @Tailscale. -
Grafana reposted
Beto Muniz
@obetomuniz
AI Observability is coming. See it first at #grafanacon
Grafana
@grafana
🤖 When it comes to agents, performance ≠ behavior.
You need both.
#ai Observability is coming. See it first at #grafanacon.
Join us in person: grafana.com/events/grafanacon/
Register for the keynote livestream: grafana.com/events/grafanacon/agenda/keynote/ -
Grafana
@grafana
Mehul Patel 🇮🇳 🇩🇪
@NomadicMehul
When you’re too deep into observability, you start seeing it everywhere! 😅
Spotted the venue for #grafanacon 2026 while walking through Barcelona today.
The energy is real! Cannot wait for tomorrow to kick off. Who else is in the city? Let’s grab a coffee! ☕️#observability -
Grafana
@grafana
Loading #grafanacon 2026… ⏳
See you soon! -
Grafana
@grafana
Days. We're just days away from #grafanacon 2026! 🎉
If you can't join us in Barcelona, register to watch the keynote livestream.
Get a first look at Grafana 13, our innovations in AI, and more: grafana.com/events/grafanacon/agenda/keynote/?mdm=social&… -
Grafana
@grafana
🚨 Alert enrichment is now in public preview for Grafana Cloud — attach logs, AI investigations, dashboard links, and dynamic annotations to alerts before they reach responders.
Triage starts at notification time, not after.
grafana.com/blog/grafana-alerting-respond-faster-and-get-… -
Grafana
@grafana
⚡️ Tally Group, a global SaaS energy solutions company, migrated to Grafana Cloud in *just* six weeks — unified metrics, logs, traces, alerting, synthetics, and IRM in one platform.
Here's how: grafana.com/events/observabilitycon-on-the-road/sydney/fr… -
Grafana
@grafana
🤖 When it comes to agents, performance ≠ behavior.
You need both.
#ai Observability is coming. See it first at #grafanacon.
Join us in person: grafana.com/events/grafanacon/
Register for the keynote livestream: grafana.com/events/grafanacon/agenda/keynote/ -
Grafana reposted
Kunal Kushwaha
@kunalstwt
I’m heading to Barcelona next week for GrafanaCON 2026 and am looking forward to catching up with everyone in the open source community 🇪🇸
The agenda from April 20-22 is looking great, especially with the first look at @grafana 13 and Loki’s new architecture. It’ll be awesome to see the production setups from Google and LEGO and get some hands-on time in the AI Lab.
🎟️ If you want to join, use my code GCON2026_KUNAL30 for 30% off your ticket at grafana.com/grafanacon.
See you in Barcelona!This media couldn't be displayed. See it on the original post. -
Grafana
@grafana
#grafanacon 2026 is almost here!
20–22 April in Barcelona.
30+ sessions, hands-on labs, Science Fair, #grafana 13 reveals, #ai announcements, and more.
Group discounts up to 40% off (almost sold out!)
grafana.com/blog/grafanacon-2026-in-barcelona-what-not-to… -
Grafana
@grafana
📣 Profiles Drilldown is now integrated with Grafana Cloud Knowledge Graph!
Go from spotting a CPU or memory spike to seeing the exact flame graph behind it, without switching tools or writing queries.
grafana.com/blog/a-faster-way-to-pinpoint-performance-bot… -
Grafana
@grafana
🎉 #kubernetes Monitoring Helm chart v4 is out — nearly six months of work to fix real pain points:
Destinations are now maps instead of lists, collectors are fully configurable, and multi-cluster config merges without blowing up your shared values files.
grafana.com/blog/kubernetes-monitoring-helm-chart-v4-bigg… -
Grafana
@grafana
⏰ There's still time to register for #grafanacon hands-on labs! Register for any of these by April 16!
🔸 #otel instrumentation from scratch
🔸 Alloy + #prometheus telemetry pipelines
🔸 #ai-assisted Grafana plugin dev
🔗: grafana.com/events/grafanacon/hands-on-labs/ -
Grafana reposted
-
Grafana reposted
Abhimanyu Sharma
@0xN1nja
started with a raspberry pi, now i run an entire AWS region at home
-
Grafana reposted
Sujal Gupta
@sujalgupta1412
I’ve been diving into k6 by @grafana, and it’s a total shift in how we think about load testing. It’s developer-centric, uses JavaScript/TypeScript, and fits perfectly into CI/CD pipelines.
-
Grafana
@grafana
☎️ @Dubberapp, a global call capturing and conversation intelligence platform, cut #observability costs by 25%!
They unified metrics, logs, and #kubernetes monitoring in Grafana Cloud and migrated away from fragmented tools.
Here's how:
grafana.com/events/observabilitycon-on-the-road/sydney/ho… -
Grafana
@grafana
Zero-code #ai observability for LLMs and agents on #kubernetes:
Deploy OpenLIT Operator once, and it auto-injects #opentelemetry instrumentation into your pods — no code changes, no image rebuilds.
grafana.com/blog/ai-observability-zero-code?camp=blog&mdm… -
Grafana
@grafana
🧠 Private data in Grafana Cloud + AI to query it — PDC keeps your databases off the public internet while Grafana Assistant translates complex SQL into readable visualizations.
grafana.com/blog/business-metrics-in-grafana-cloud-get-an… -
Grafana
@grafana
👀 Monitoring LLMs in prod means answering: what's this costing us, are we within SLO, and are we returning hallucinations?
Grafana Cloud + OpenLIT + #opentelemetry gives you one place to answer all three.
grafana.com/blog/ai-observability-llms-in-production/?cam… -
Grafana
@grafana
⛺️ New episode of Grafana's Big Tent!
Engineers from Grafana Labs and @Isovalent on observability in Go — logs first, when to reach for tracing, #pprof, and what #ebpf unlocks beyond your app.
youtu.be/1Vvm3B8rrWs -
Grafana
@grafana
💰 Grafana Cloud lets you query up to 100x your monthly ingested log volume for free — but if you're not strategic, overages happen.
Here's how to find your usage ratio, trace where queries are coming from, and avoid surprises.
grafana.com/blog/query-fair-usage-in-grafana-cloud-what-i… -
Grafana
@grafana
#openrouter's Broadcast automatically sends traces from your OpenRouter requests to Grafana Cloud.
This gives you cost and performance visibility across every #llm your app is hitting in production.
grafana.com/blog/how-openrouter-and-grafana-cloud-bring-o… -
Grafana
@grafana
The agenda for #grafanacon 2026 is ...stacked! 🥁
🔸 6 hands-on labs to build real skills
🔸 Major announcements + opening keynote
🔸 Technical sessions & real-world use cases
🔸 Live demos, expert access & community connections
Join us in Barcelona! grafana.com/events/grafanacon/?src=x&camp=gcon2026&mdm=so… -
Grafana
@grafana
🦴 Open standards are the backbone of #observability.
Here's what 1,300+ practitioners said about where the industry actually stands in 2026.
grafana.com/blog/observability-survey-OSS-open-standards-… -
Grafana
@grafana
Grafana Assistant 🤝 #claude Code
Shawn Pitts from Grafana Labs demos how you can use #grafana Assistant inside Claude Code to get an analysis and code recommendation to fix an issue.This media couldn't be displayed. See it on the original post. -
Grafana
@grafana
One DevOps engineer in helped transform #observability for a growing legal-tech startup.
With microservices, voice AI, and CloudWatch pains mounting, @honalegal turned to Grafana Cloud.
Here’s how Matías helped them scale with confidence.
grafana.com/success/hona/?mdm=social&src=tw -
Grafana reposted
Joost 🇪🇺🇳🇱🇨🇼🇺🇦🇵🇸
@J_00_S_T
Op #observabilitycon in de Beurs van Berlage 😎 @grafana
-
Grafana reposted
Mat Ryer
@matryer
BREAKING: Entire Grafana codebase leaked.
github.com/grafana/grafana -
Grafana
@grafana
👏 Introducing the #grafanacon 2026 lineup!
New to the list: @Google & their planet-scale dashboards 😮
30+ sessions. Real-world use cases from @LEGO_Group, @IrishRail, @DIGI4ECO, @ESNet, @ThePSF & more.
Join us: grafana.com/events/grafanacon/?src=x&camp=gcon2026&mdm=so… -
Grafana reposted
Simon Prickett 🇪🇺| simonprickett.dev
@simon_prickett
Join me at Grafana and Friends Kerala's virtual meetup on April 7th. I'll be speaking about @grafana SQL Expressions and how to use them to build a fun dashboard with reality TV data from the Traitors! www.meetup.com/grafana-and-friends-kerala/events/313976801/
-
Grafana
@grafana
✨ POV: Kubernetes Monitoring meets actually useful #ai.
Grafana Assistant helps you quickly investigate your #kubernetes cluster, namespace, or workload. See this quick demo from Coleman Rollins, Staff Software Engineer at Grafana Labs. -
Grafana
@grafana
✨ When you're running #ai workloads in production, you need to understand how those workloads perform & what they cost.
Here’s how the OpenRouter integration for Grafana Cloud gives you that visibility — no additional instrumentation required.
grafana.com/blog/how-openrouter-and-grafana-cloud-bring-o… -
Grafana
@grafana
Grafana Labs is at #kubecon EU this week!
Come visit us at booth #480 to chat about Kubernetes monitoring *with* actually useful #ai and full-stack observability.
Or learn more about #kubernetes Monitoring here: grafana.com/solutions/kubernetes -
Grafana reposted
Sahil Thakare
@sahilthakare52
Queryless drilldowns connecting metrics, logs, and traces are crucial for rapid incident response. This cuts MTTR in complex GKE/EKS/AKS K8s environments, enabling quicker root cause analysis and proactive operational insights.
Grafana
@grafana
The Grafana Drilldown apps gives you a queryless, point-and-click way to explore your metrics, logs, traces, and profiles.
And with these new updates to the apps, it's now even easier to go from exploration to action. grafana.com/blog/quickly-go-from-exploration-to-action-wi… -
Grafana
@grafana
77% of of observability experts say open source & open standards are important to their observability strategy.
Take a look at the role of OSS/open standards in observability today, based on the results from the 2026 edition of the Observability Survey.
grafana.com/blog/observability-survey-OSS-open-standards-… -
Grafana
@grafana
The Grafana Drilldown apps gives you a queryless, point-and-click way to explore your metrics, logs, traces, and profiles.
And with these new updates to the apps, it's now even easier to go from exploration to action. grafana.com/blog/quickly-go-from-exploration-to-action-wi… -
Grafana
@grafana
LLM-based applications can bring a lot of value to your business, but they present some unique observability challenges.
In this series, you'll learn how to use AI Observability in Grafana Cloud to monitor LLMs in production, AI agents, and MCP servers.
grafana.com/blog/ai-observability-llms-in-production/?cam… -
Grafana
@grafana
When it comes to #devops... Resilience isn't just a technical metric. It's a reflection of team culture.
Grafana Champion Pratik Parikh shares why scaling systems goes beyond code — it's about understanding infrastructure, security & user experience.
open.spotify.com/episode/0MERqJ29YuYBUtBAsDt3j3 -
Grafana
@grafana
Interested in observing #cilium health and operations?
Grafana Champion Donald Le's blog outlines how to get started.
ledinhcuong99.medium.com/monitor-cilium-with-grafana-a4c8… -
Grafana
@grafana
Keycloak is an OSS identity provider that provides support for standard protocols like OpenID Connect, Oauth 2 & SAML.
Learn how to integrate Keycloak with Grafana for authentication & authorization from Grafana Champion Rudi Martinsen. rudimartinsen.com/2025/12/23/grafana-keycloak-auth/ -
Grafana
@grafana
🔭 The #observability industry is shifting from siloed pillars to unified open data platforms.
#opentelemetry is at the center of that transformation — changing how teams build and operate!
OTel co-founder @tedsuo breaks it down in @thenewstack. thenewstack.io/open-observability-ai-platforms -
Grafana
@grafana
🤖 The role of AI in observability is rapidly evolving, but the data is clear:
The potential is real, and so are the reservations.
This post dives deeper into how observability experts think about AI & how it fits into their workflows and their future. grafana.com/blog/observability-survey-AI-2026/?camp=blog&… -
Grafana
@grafana
Grafana Cloud supports integration with #kubernetes out of the box with features for observability and monitoring, so that you can view metrics and set up alerts for your K8s cluster.
Learn how to get started from Grafana Champion Donald Le.
ledinhcuong99.medium.com/integrate-k8s-to-grafana-dashboa… -
Grafana reposted
John Farrall
@JohnFarrall
Thanks to @Grafana for publishing the 4th Annual Observability Survey.
Bottom line for me: the gap between how much hashtag#telemetry we collect and how much we actually understand about the behavior of our systems is still widening.
One thing we know for sure is that the problem of noisy, complex systems driving alert fatigue is real! -
Grafana
@grafana
What engineers want from AI in observability...
According to the 2026 Observability Survey report.
Learn more about the findings from our report in this video, featuring Marc Chipouras (VP of Emerging Products): youtu.be/oPgL9_9dhl8 -
Grafana
@grafana
If you're headed to #srecon next week, come say 👋 and ask your questions about Grafana Cloud, the LGTM Stack, and all things observability: www.usenix.org/conference/srecon26americas
We'll see you there! -
Grafana
@grafana
The 4th annual Observability Survey report is live 🎉
From #oss & #ai in observability to its evolution beyond engineering — this report explores what's going on in observability based on 1,363 responses from #observability experts all over the world: grafana.com/observability-survey/?mdm=social&src=tw -
Grafana reposted
Syed Usman Ahmad
@usahmad87
Date: 21 March
Time: 3:00 PM CEST (2 PM UTC)
Topic: Grafana Release Pipelines
🟢I'll be hosting the next @grafana Campfire🔥call where you'll learn from experts about Grafana Engineering release pipelines 🚥for On-prem & #cloud ☁️
Check out the details:
community.grafana.com/t/grafana-campfire-release-pipeline… -
Grafana
@grafana
🤝 Time to bridge the #devsec divide.
We've partnered with @MiggoSecurity on a joint solution that builds on production telemetry in Grafana Cloud to deliver evidence-based runtime security.
grafana.com/blog/grafana-cloud-and-miggo-for-runtime-prot… -
Grafana
@grafana
Grafana Labs will be at booth #480 at #kubecon EU next week!
Request a 1-1 meeting with our creators and experts.
It's your chance to share feedback & feature requests, explore new use cases, and receive recommendations for *your* use case. grafana.com/events/kubecon/?mdm=social&src=tw -
Grafana
@grafana
An oldie but a goodie. Learn how to get started with Git Sync (dashboards as code) from Grafana Champion Taisuke Okamoto.
And if you missed it, Git Sync is now in public preview: b1gb4by.github.io/en/posts/2025-12-11-grafana-git-sync/ -
Grafana
@grafana
What *is* an agentic LLM? And what does it look like in the context of #observability?
Join @matryer and @Kuqd, engineers on the Grafana Assistant team, live on The Context Window to hear their POVs on #ai, agentic LLMs, and more.
www.youtube.com/watch?v=0ukJLT0hVHI -
Grafana
@grafana
💰 Cloud cost optimization shouldn’t be a manual battle.
By combining Grafana Assistant with #mcp servers, you can automate the entire process, from identifying resource waste to implementing fixes, using real production telemetry.
Here's how.
grafana.com/blog/from-signals-to-savings-optimizing-cloud… -
Grafana
@grafana
🚢 Just shipped: Alloy v1.14.0.
This release brings you the best of both worlds with a new experimental OpenTelemetry engine.
Run "vanilla" OpenTelemetry while still getting all the benefits of Alloy.
grafana.com/blog/native-opentelemetry-inside-alloy-now-yo… -
Grafana
@grafana
6 hands-on labs at #grafanacon 2026. Limited capacity.
🔸 #otel instrumentation from scratch
🔸 Alloy + #prometheus telemetry pipelines
🔸 AI-assisted #grafana plugin dev
🔸 Advanced + 101 dashboarding
🔸 Reliability testing with k6
Pick yours: grafana.com/events/grafanacon/hands-on-labs/ -
Grafana
@grafana
ICYMI, you can add skills to Grafana Assistant (public preview) for more effective insights and investigations.
Operationalize your organization's collective SRE expertise — encode the ways you debug your systems directly into Grafana Cloud.
grafana.com/blog/add-skills-to-agents-use-assistant-skill… -
Grafana reposted
akvn
@0xAkvn
Grafana Cloud has an always free tier. It comes with their AI Assistant that will analyze the logs for you without needing to leave the platform.
-
Grafana reposted
TruthSeeker
@sassysquirrel69
100 percent and only @grafana cloud
Boris Cherkasky
@cherkaskyb
Imo - grafana.
Love it -
Grafana reposted
Joey Freeland
@joeyfreeland
Grafana Assistant is pretty spectacular
-
Grafana
@grafana
🤝 We've signed a strategic collaboration agreement with #aws!
This helps customers adopt & scale Grafana Cloud on AWS with full-stack, open observability powered by AI, simplified procurement through AWS Marketplace, and support for migration & growth: grafana.com/press/2026/03/10/grafana-labs-signs-strategic… -
Grafana
@grafana
Voting closes on March 11, 2026. Help us select this year's Golden Grot Awards winners.
Grafana
@grafana
Presenting the 2026 Golden Grot Awards finalists 🏆
Help us select this year's winners by ranking your favorite #grafana dashboards. Voting ends March 11, 2026: grafana.com/golden-grot-awards/?mdm=social&src=tw
Thank you to all who submitted, and congratulations to our finalists! -
Grafana
@grafana
As observability environments scale, implementing just-in-time and least-privilege access for your data sources can minimize risks without slowing teams down.
Here's how to achieve just that using the Apono integration for Grafana. grafana.com/blog/apono-integration-for-grafana-enabling-j… -
Grafana
@grafana
❤️
ana
@aninhacsgo
pqp eu AMO a stack do grafana
-
Grafana reposted
Boris Cherkasky
@cherkaskyb
Imo - grafana.
Love it -
Grafana
@grafana
It’s a good day to vote!
Grafana
@grafana
Presenting the 2026 Golden Grot Awards finalists 🏆
Help us select this year's winners by ranking your favorite #grafana dashboards. Voting ends March 11, 2026: grafana.com/golden-grot-awards/?mdm=social&src=tw
Thank you to all who submitted, and congratulations to our finalists! -
Grafana
@grafana
👏 👏 👏
Putu Prema
@putupurema
Disuruh bayarin listrik rumah sama ortu. Yaudah saya bikin dashboard di Grafana supaya gampang kelihatan kalo ada pemakaian listrik yang boros.
Sumber datanya dari Home Assistant, di-ingest ke Prometheus, lalu disajikan dalam bentuk dashboard di Grafana.
Mungkin berikutnya mau setup alert, supaya kalo ada perangkat yang konsumsi dayanya terlalu boros bakal kirim notifikasi ke WA / Telegram. -
Grafana
@grafana
📂 Grafana is everywhere — including #observability at @Dropbox. File under: logging at scale.
Software Engineer Chris Hodges shares how they ingest 5-6GB of logs per second with #loki and #grafana, and why that matters for user experience and the business. #grafanaeverywhereThis media couldn't be displayed. See it on the original post. -
Grafana
@grafana
Presenting the 2026 Golden Grot Awards finalists 🏆
Help us select this year's winners by ranking your favorite #grafana dashboards. Voting ends March 11, 2026: grafana.com/golden-grot-awards/?mdm=social&src=tw
Thank you to all who submitted, and congratulations to our finalists! -
Grafana
@grafana
👏 Just shipped: the #grafanacon 2026 agenda!
Highlights
• Grafana 13
• Loki’s new storage engine
• Alloy's new #otel engine
• Use cases from LEGO, DIGI4ECO, Irish Rail, PSF, and more
Tickets AND hands-on labs are 30% off. See the agenda & register: grafana.com/events/grafanacon/agenda/?mdm=social -
Grafana
@grafana
#mysql fans, this one's for you!
Check out @usahmad87's video on how to visualize and query MySQL data in a #grafana dashboard using the data source plugin.
www.youtube.com/watch?v=p_RDHfHS-P8 -
Grafana
@grafana
Grafana Alerting has become an operational hub that's reliable and efficient at any scale.
See how we're making your on-call life a little easier, and check out some examples of how you can start streamlining your workflows today. grafana.com/blog/grafana-alerting-faster-rules-personaliz… -
Grafana reposted
Francis 🎈
@realestfrancis
Grafana’s AI direction is impressive.
-
Grafana reposted
K e n T a
@kenta_feels_ayu
自分がAI時代以前からずっとやりたかった「給与明細ダッシュボード」Grafanaで始めた!
ポイント
・NotebookLMのおかげで給与明細画像のCSV化に成功(過去OCRで試行も失敗続きだった)
・給与明細と源泉徴収票をinfluxDBに投入
・生涯賃金の算出/可視化
・在籍企業別の平均手取りや在籍期間を可視化
K e n T a
@kenta_feels_ayu
あぁ~、CakePHP+PostgreSQL+herokuの組み合わせで自分の今まで5年間働いてきた給与明細の集計・分析サイトでも作ろっかなぁ~
総支給額はいくらなのか、前年比アップ率はどう推移してるか、各種課税の推移はどうなっているか、内訳はどうなっているのか、給与と課税の比率およびその推移などなど -
Grafana
@grafana
🚀 1 year ago today, @fireflyspace made history with Blue Ghost Mission One.
The first successful commercial lunar landing was made possible by the grit and determination of the BGM1 team. And we're proud that #grafana contributed to their success.
Grafana
@grafana
🚀 We're excited to introduce Grafana Everywhere — our new video series spotlighting the bold, brilliant, and unexpected ways people use the #grafana Stack to power what’s next.
From everyday wins to moonshot missions, see what happens when #observability is everywhere.
Our first video is out of this world. Learn how Grafana supported the very first successful commercial #moonlanding, achieved by @fireflyspace's Blue Ghost Mission One.
Congratulations to Jesus Charles and the entire Firefly Aerospace team on this incredible accomplishment!This media couldn't be displayed. See it on the original post. -
Grafana
@grafana
Tracing FTW!
On season 3 ep 6 of the Big Tent podcast, #opentelemetry co-founder @tedsuo talks about how how #otel emerged, why the “3 pillars” model may be holding teams back, and the technical + philosophical shifts happening in #observability.
Watch: youtu.be/pSTf7nt_Vjk -
Grafana
@grafana
Actually useful AI. Go Hamm on your observability.
-
Grafana
@grafana
🤝 #prometheus and #opentelemetry are moving past years of compatibility friction, paving the way for a unified observability stack.
Read more from @bcamerongain over at @thenewstack.
thenewstack.io/prometheus-and-opentelemetry-love-each-oth… -
Grafana
@grafana
Sure, you might *know* the power of #sql expressions in #grafana...
But what does it look like in action?
We created a dashboard on Grafana Play so you can see for yourself. Give it a whirl: play.grafana.org/d/mapr4nb/sql-expressions-showcase?orgId… -
Grafana
@grafana
#observability is about turning operational data into action and resolution. That’s where Grafana Cloud shines.
Read the full review from @Gartner_Peer: gtnr.io/2DYNt1G95 -
Grafana
@grafana
Just shipped: Grafana 12.4 🚀
This release brings Git Sync updates (#observability as code), dynamic dashboards in public preview (with new features), suggested dashboards, and new features to streamline data visualization overall.
grafana.com/blog/grafana-12-4-release-all-the-latest-feat… -
Grafana
@grafana
You've heard Grafana Assistant referred to as "actually useful AI," but do you know why?
Join our webinar on Feb 26 to learn how to get started with Grafana Assistant, and how it can help you build dashboards, troubleshoot, and propose fixes, fast.
grafana.com/go/webinar/getting-started-with-grafana-assis… -
Grafana
@grafana
🏆 An announcement that puts the AI in raising the roof.
Grafana Labs has been named to The Agentic List 2026!
This list identifies the 120 most promising private companies building enterprise-grade agentic AI. See the list: www.agentconference.com/agenticlist/2026 -
Grafana
@grafana
“You’ve got this oracle that knows everything about your software, why not use that? - @tom_wilkie
Read more about #opensource in the age of #ai in @theleaddev.
leaddev.com/ai/what-tailwind-teaches-us-about-open-source… -
Grafana reposted
Frederic Alix
@fax_v2_0
What do you think about my @grafana plugin panel to display metrics event like a virtual city ?
#grafana #visualization -
Grafana
@grafana
#grafanacon 2026 early bird tickets have sold out, but 30% discount tickets are still available!
See the latest updates in #grafana, #opentelemetry & other projects in the OSS observability ecosystem.
Save on your registration AND hands-on labs: grafana.com/events/grafanacon/ -
Grafana
@grafana
✅ From "something's off" to "here's why" — fast.
Grafana Assistant goes full detective: pulls the clues, connects the dots, and suggests fixes... with receipts. -
Grafana reposted
Syed Usman Ahmad
@usahmad87
𝗧𝗼𝗽𝗶𝗰: Back to Basics
𝗗𝗮𝘁𝗲: Thu. 26th Feb.
𝗧𝗶𝗺𝗲: 2:00 PM UTC (4:00 PM CEST)
@grafana Campfire 🔥 Community Calls are back and we are starting with 𝗕𝗮𝗰𝗸 𝘁𝗼 𝘁𝗵𝗲 𝗕𝗮𝘀𝗶𝗰𝘀.
Join the Live Stream and ask your Questions (anonymously): community.grafana.com/t/grafana-campfire-back-to-basics-g… -
Grafana
@grafana
"I like working with software that looks good."
On season 3 episode 5 of the Big Tent podcast, Grafana creator Torkel Ödegaard talks about #grafana 12 and why UI matters.
Catch the full episode: youtu.be/KlTn2qC1Pm4 -
Grafana
@grafana
Open is better. Open source. Open standards. Open ecosystem.
In this #ai era, #opensource is also a quick win.
Learn why it's become the cheat code for AI from @tom_wilkie on @CIOonline.
www.cio.com/article/4134023/why-open-source-is-the-cheat-… -
Grafana
@grafana
Visualizing data through APIs means digging through docs + building dashboards manually.
No more!
Use the Infinity data source plugin to query any #json API from Grafana. Pair it with Grafana Assistant to go from URL to answers or dashboards in minutes. grafana.com/blog/use-ai-to-turn-any-json-api-into-a-dashb… -
Grafana
@grafana
Are you team tabs or team spaces?
This dashboard looks at the top 100 most-starred GitHub repos and checks whether they use tab, spaces, or a mix of both because... chaos!
Let us know which team you're on 👇 and see the dashboard: play.grafana.org/d/roq9xv7/tabs-vs-spaces?orgId=1&from=no… -
Grafana
@grafana
.@JustEatTakeaway uses Grafana Cloud k6 to make performance testing core to production reliability.
The results:
- Weekly prod stress tests generating 45M+ requests/hour to prevent repeat incidents
- Confident production testing across 17 countries
🔗: grafana.com/events/observabilitycon/agenda/2025/just-eat-… -
Grafana
@grafana
#grafanacon 2026 discounted tickets are selling fast!
See the latest updates in Grafana, Prometheus, OpenTelemetry & other projects in the OSS observability ecosystem.
Save on your registration (& hands-on labs), AND reunite with the Grafana community: grafana.com/events/grafanacon/?mdm=social&src=tw -
Grafana
@grafana
In Nov 2025, we delivered native #opentelemetry support for #dotnet 10.
In this post, we share a behind-the-scenes look at this journey, and a few updates about how we're helping those who use OTel signals within .NET applications move to .NET 10.
grafana.com/blog/opentelemetry-support-for-net-10-a-behin… -
Grafana
@grafana
Optimize for #telemetry value to reduce MTTR, noise, and costs.
Go for gold with Adaptive Telemetry — powered by actually useful #ai 🥇
Check it out: grafana.com/blog/what-is-adaptive-telemetry-and-how-can-i… -
Grafana
@grafana
👀 Private networks can create monitoring blind spots.
Grafana Cloud Synthetic Monitoring + private probes let you run checks from inside your environment to validate internal APIs, staging, and performance—without exposing anything publicly.
🔗: grafana.com/blog/how-to-run-checks-on-internal-services-w… -
Grafana
@grafana
We couldn’t fit all our love for the Grafana community into one #valentine greeting.. so Grot created a few:
If love were a metric, you'd be off the charts!
Not even DNS can get between us.
You had me at LGTM.
#prometheus? More like Promethe-us.
#otel me more, tell me more. It was love at first sight. -
Grafana
@grafana
✨ Grafana Assistant gives your team an on-demand expert that they can trace, verify, and rely on to keep production stable.
Check out some of our pro-tips: grafana.com/blog/grafana-assistant-why-you-can-trust-our-… -
Grafana
@grafana
📣 Get ready to Rambla… (and rumble) — #grafanacon 2026 registration is open!
We're happy to bring the #grafana community back together again 🧡 This time, in Barcelona from 20-22 April.
Be one of the first to see the latest updates in Grafana, #prometheus, #opentelemetry, and other projects in the #oss observability ecosystem.
It's 1 day of hands-on labs (optional) plus 2 full days of talks, sessions, and real-world stories.
Tickets AND hands-on labs are 50% off for a limited time. Sign up before we sell out: grafana.com/events/grafanacon/?mdm=social&src=tw -
Grafana
@grafana
🪄 When #chatops meets actually useful #ai.
The Grafana Cloud app for #slack brings observability and incident response closer to where you and your teams already collaborate 🤝
Ask questions about system health, alerts, on-call schedules, and #grafana Cloud features; manage incidents and alerts; and collaborate with full context.This media couldn't be displayed. See it on the original post. -
Grafana
@grafana
By visualizing tracing data from the #openai Agents SDK in Grafana Cloud, you can monitor and optimize the workflows of your agentic AI applications.
Here's how to get started.
grafana.com/blog/observing-agentic-ai-workflows-with-graf… -
Grafana
@grafana
Continuous profiling is the go-to #observability practice to directly connect system behavior to specific lines of code.
Still, some teams are reluctant to deploy it in production because of the potential overhead.
Here’s what we’ve learned running Pyroscope at scale here at Grafana Labs — and why the benefits far outweigh the costs. grafana.com/blog/continuous-profiling-in-production-a-rea… -
Grafana
@grafana
Say bye, bye, bye to dashboard sprawl.
In case you missed it, Git Sync is in public preview in Grafana Cloud!
Get the power of Git version control right within your Grafana instance (no complex setup required): grafana.com/blog/git-sync-grafana/?camp=blog&mdm=social&s… -
Grafana
@grafana
🤔 In the fast moving world of #ai, is it better to build or buy your own #observability solution?
And how does open source factor into those decisions?
Take a closer look at your options, and see why the answer might not be as straightforward as you think. -
Grafana
@grafana
A dashboard beyond our wildest dreams🤩
K e n T a
@kenta_feels_ayu
出来てきた!!
まだ各種値の調整だったり裏側のCSV取り込み部分の自動化だとかの調整とか諸々必要な作業は残ってるけど、ビジュアル出来上がってくるだけでもテンション上がるわね。 -
Grafana
@grafana
Last chance to submit! your #grafana dashboard for global recognition and exciting prizes.
The clock is ticking...
Grafana
@grafana
🏆 The deadline to submit your #grafana dashboard for global recognition 10 Feb, 2026!
The Golden Grot Awards program recognizes the best professional or personal dashboards from the community.
Take 5-10 minutes to submit your dashboard: grafana-labs.typeform.com/to/Msv9tSgC?typeform-source=gra… -
Grafana reposted
Sarika | MLOps Engineer
@devopsbysarika
Finally submitted a Dashboard to the Golden Grot Awards.
Built it quietly, for myself.
Played with observability....not to optimize, just to notice.
This one mattered. -
Grafana
@grafana
🦄 With Grafana Cloud, @Lovable reduced low-value metrics by 93% and cut their observability bill by over $10K per month.
That’s the power of Adaptive Telemetry — ensuring every piece of telemetry you store is truly worth the investment.
grafana.com/success/lovable/ -
Grafana
@grafana
🦾 Our actually useful AI just became even more useful, er.. skillful.
You can now add skills to your agents with Grafana Assistant playbooks (public preview) for more effective insights and investigations.
Think of it as a means to operationalize your organization's collective SRE expertise — essentially encoding the ways you debug your systems directly into Grafana Cloud.
Learn how to get started: grafana.com/blog/add-skills-to-agents-use-assistant-playb… -
Grafana
@grafana
Join us for our first joint #grafana ❤️#otel and Tempo Community calls on practical distributed tracing from the field. Bring any questions you may have!
See the YouTube description for more details.
Thursday February 12th, 9:30a PT/6:30p CET
www.youtube.com/watch?v=1lMHX8CRHsc -
Grafana
@grafana
OTel Unplugged EU 2026 – It's a wrap!
Bringing together #opentelemetry contributors, end users, and community members in Brussels was everything we hoped for and more.
The best feedback we got? "Getting folks in a room together is better than any survey question answered."
The face-to-face connections, honest discussions, and collaborative energy proved why these gatherings matter.
Thank you to everyone who made it happen. Grafana Labs was proud to host, and we're looking forward to more OTel community events in the future. -
Grafana
@grafana
🎉 Git excited for observability as code:
Git Sync is now available in public preview in Grafana Cloud!
Get the power of Git version control right within your Grafana instance (no complex setup required): grafana.com/blog/git-sync-grafana/?camp=blog&mdm=social&s… -
Grafana reposted
akvn
@0xAkvn
the funny thing is grafana does not shove AI into every single sentence like those other observability tools and grafana still has better AI tools 🙄
-
Grafana
@grafana
Let's be real: #ai can hallucinate. And that can feel risky in the context of #observability.
There are 3 main ways we're addressing these concerns with Grafana Assistant, a purpose-built agent designed for real environments, where trust and traceability matter.
(1/5)Post not available here, view on X
Grafana
@grafana
3. It investigates conflicting signals.
When metrics seem to contradict each other, Grafana Assistant doesn’t just guess. It spins up additional agents to gather more evidence, like cross-checking other telemetry or pulling in memory data, to either confirm or rule out a potential issue.
(4/5)
Grafana
@grafana
These safeguards ensure that Grafana Assistant can truly act as a guided partner that reduces the manual toil of observability.
Give it a try in Grafana Cloud: grafana.com/docs/grafana-cloud/machine-learning/assistant
More info in this blog post: grafana.com/blog/grafana-assistant-why-you-can-trust-our-…
(5/5) -
Grafana
@grafana
You’ve heard Grafana Assistant referred to as “actually useful” AI. But what does that actually mean?
Devin Cheevers, Director of Product breaks it down for us 👇This media couldn't be displayed. See it on the original post. -
Grafana
@grafana
🔥 #prometheus Remote Write v2, though still experimental, has cut our network egress costs for internal telemetry by more than 50%!
See how you can potentially do the same by implementing v2 with Alloy.
grafana.com/blog/how-prometheus-remote-write-v2-can-help-… -
Grafana reposted
Tom Dörr
@tom_doerr
Grafana dashboard for Unbound DNS metrics via Prometheus and Loki
github.com/ar51an/unbound-dashboard -
Grafana
@grafana
T-minus: year-end → next up 🚀
How we closed the fiscal year on Jan 31, 2026: Strong revenue growth + expanding AI adoption + open observability leadership.
This doesn't happen by accident.
It happens by building in the open and innovating for how teams use observability in the AI era.
The result: $400M+ ARR, 7,000+ customers, and industry recognition across the board.
Thanks to our community, customers, and Grafanistas for building with us. Onward!
Read about our breakout year: grafana.com/about/press/2026/02/03/grafana-labs-caps-a-br… -
Grafana
@grafana
🏆 The deadline to submit your #grafana dashboard for global recognition 10 Feb, 2026!
The Golden Grot Awards program recognizes the best professional or personal dashboards from the community.
Take 5-10 minutes to submit your dashboard: grafana-labs.typeform.com/to/Msv9tSgC?typeform-source=gra… -
Grafana reposted
𝙳𝚘𝚝𝚊𝚗 𝙷𝚘𝚛𝚘𝚟𝚒𝚝𝚜 ✈️ KubeCon 🇺🇸
@horovits
Great catching up with Mario Macías at #otelunplugged EU after FOSDEM, and discussing #opentelemetry, #ebpf instrumentation and more.
Check out my recent @OpenObserv episode with Mario: horovits.medium.com/unveiling-opentelemetry-ebpf-instrume… -
Grafana
@grafana
"One of our favorite parts of moving to Grafana Cloud was traces. Full end-to-end traces powered through the #opentelemety Java agent...
It's more data than we ever had in AppDynamics, and it makes it extremely simple to find exactly how and when something breaks." – Zachary Sistrunk, C Spire
Watch their story:
grafana.com/events/obsessions/2025/atlanta/how-c-spire-mi… -
Grafana
@grafana
🧡 We're thrilled to be at #fosdem again!
We've got a few talks lined up from our Grafanistas this weekend, covering everything from #kubernetes and CPU performance to #ai.
Be sure to visit us on Level 1 in the K building. See you soon!
grafana.com/blog/grafana-labs-at-fosdem-2026-kubernetes-a… -
Grafana
@grafana
Tempo 2.10 is here!
Catch up on all the latest updates related to TraceQL, vParquet5, MCP server support, and more. grafana.com/blog/tempo-2-10-release-all-the-latest-featur… -
Grafana
@grafana
🌎 Bring a #grafanacon Local meetup to your city! We’re looking for community hosts and speakers for this meetup series coming up in May and June.
The GrafanaCON Local meetups will happen globally through our Grafana & Friends meetup groups. Scheduling is dependent upon confirming hosts and speakers — with applications reviewed on a rolling basis.
Submit your application from now until April 10: grafana.qualtrics.com/jfe/form/SV_4OQ9dzUAbSHfrAG -
Grafana reposted
Siddhant Dembi
@siddhantdembi
Set up Grafana and InfluxDB to create a dashboard for sensor data. Everything is self-hosted. A 3D-printed case was made for the AQI monitor.
-
Grafana reposted
Tom Dörr
@tom_doerr
Visualizes Unbound DNS metrics in Grafana
github.com/ar51an/unbound-dashboard/ -
Grafana reposted
Vonng
@RonVonng
做了个 Claude Code Grafana Dashboard ,研究下它是怎么做决策,用工具,调 API 花钱的。
-
Grafana
@grafana
📰 Grafana Labs will take over the maintenance & development of the business intelligence plugins originally created by @VolkovLabs (recently acquired).
Our goal is to ensure continuity for the community while developing timely compatibility updates.
grafana.com/blog/business-intelligence-plugins-for-grafan… -
Grafana
@grafana
#observabilitycon is making one-day stops around the world, and we've added a new destination: New York City! 🍎
Preview AI solutions and new LGTM Stack releases, deepen your OSS observability expertise, and leave with actionable strategies to drive bigger business impact.
Register for an event near you: grafana.com/events/observabilitycon-on-the-road/ -
Grafana
@grafana
Our product isn’t observability.. it’s sleep. 😴
Hear why from Devin Cheevers, Director of Product 👇 -
Grafana
@grafana
At Grafana Labs, listening to customer feedback is a guiding principle. We actively pay attention to it and use it to shape what we build next.
Our Voice of Customer (VoC) program — a centralized effort to collect, triage, and share feedback from our user base across both our #oss and #grafana Cloud offerings — is one of the key ways we achieve this.
Thank you to all of those who provided feedback and voted. Your input helped shape the releases in 2025 and we can't wait for what we'll do together this year!
Read more: grafana.com/blog/grafana-labs-voice-of-customer-program-2… -
Grafana
@grafana
✅ 32% reduction in unused metrics.
✅ Unified alerting + on-call.
✅ Full visibility across #blockchain workloads.
Learn how @flipsidecrypto built a scalable #observability system with Grafana Cloud:
grafana.com/events/obsessions/nyc/how-flipside-built-reve… -
Grafana
@grafana
Last week to register for OTel Unplugged EU 2026!
📷 Brussels | February 2
If you’re heading to #fosdem, stay an extra day and connect with the #opentelemetry community — including maintainers and contributors from the Grafana Labs team.
Register now before it fills up: -
Grafana
@grafana
As part of the upcoming #grafana 13 release, we will be updating to #react 19.
Here’s everything Grafana plugin developers need to know, and some helpful tools and tips to prepare for the change. grafana.com/blog/react-19-is-coming-to-grafana-what-plugi… -
Grafana reposted
Aditya Choudhary
@ServerSideTale
This is really cool 👏
@grafana’s take on ChatOps that actually works is a great example of how observability + collaboration should feel in 2026.
Instead of bouncing between Grafana dashboards, logs, alert UIs, and Slack, you do most of the investigation and coordination in the same space where your team is already chatting. That alone saves huge cognitive load and precious time during incidents.
AI-powered observability inside Slack feels less like a gimmick and more like a natural evolution of on-call workflows — faster context, fewer tabs, better decisions.
Worth a read if you care about incident response, SRE workflows, or reducing operational friction 👇
grafana.com/blog/chatops-that-actually-works-grafana-clou…
#chatops #observability #sre #devops #grafana #incidentmanagement #aiinengineering -
Grafana
@grafana
#genai isn’t magic once you observe it in action.
When systems are non-deterministic, SLIs break down — #observability shifts to tracking costs and evaluating outcomes.
Catch up on our discussion here (spoiler: live demo!)
www.youtube.com/watch?v=LfDVygRWQJU -
Grafana
@grafana
AI-powered observability for restaurant tech!
Because reliability is always on the menu.
@SpotOn shares how they use Grafana Assistant to onboard faster, build dashboards quicker, and troubleshoot with more context: grafana.com/blog/baking-in-site-reliability-with-observab… -
Grafana
@grafana
Say hello to #chatops that *actually* works: the Grafana Cloud app for #slack.
Ask natural-language questions about system health, alerts, on-call schedules, and Grafana Cloud features; manage incidents and alerts; and collaborate with full context: grafana.com/blog/chatops-that-actually-works-grafana-clou… -
Grafana reposted
WarpStream
@warpstream_labs
Using @warpstream_labs, @grafana decoupled the read and write paths in their metrics database (Mimir), eliminated inter-AZ charges, and benchmarked up to 7.5 GiB/s of aggregate throughput (compressed). 👉 www.warpstream.com/blog/how-warpstream-powers-grafana-lab…
-
Grafana
@grafana
Keeping “humans in the loop” is one of the core principles for how we think about AI at Grafana.
AI should reduce toil, not take over — engineers stay in control.
Hear more from Devin Cheevers, Director of Product. -
Grafana reposted
akvn
@0xAkvn
if you are using grafana cloud and not using fleet management, you are doing something wrong.
Grafana
@grafana
Simplify observability with Fleet Management: a Grafana Cloud feature designed to help you manage collectors at scale.
It's also designed to work alongside your favorite #iac tool, including #terraform.
Discover the benefits of pairing the two, and learn some best practices to help you get started. grafana.com/blog/fleet-management-and-terraform-use-cases… -
Grafana
@grafana
Simplify observability with Fleet Management: a Grafana Cloud feature designed to help you manage collectors at scale.
It's also designed to work alongside your favorite #iac tool, including #terraform.
Discover the benefits of pairing the two, and learn some best practices to help you get started. grafana.com/blog/fleet-management-and-terraform-use-cases… -
Grafana reposted
Saurav Chaudhary
@sauravstwt
If you’re working with Grafana, this is worth your time.
7 practical ways Grafana Assistant speeds up data analysis & dashboard creation 👇
csselectronics.com/pages/grafana-assistant-can-bus-data-a… -
Grafana
@grafana
Online grocery platform @Ocado streamlined their observability practice by migrating from New Relic & a half dozen other providers to Grafana Cloud.
Learn how the move to translated to more flexibility, cost savings, and proactive incident response. grafana.com/blog/cost-efficient-and-open-observability-wh… -
Grafana
@grafana
How do teams scale observability as systems, data, and organizations grow more complex?
In this customer panel, BlackRock and DriveWealth share real-world lessons from operating observability at scale using open standards.
📺 Watch now: grafana.com/events/obsessions/nyc/lessons-learned-scaling… -
Grafana
@grafana
We’re honored that Grafana Cloud was named Best Observability Solution in the 2026 DevOps Dozen Awards! 🎉
This recognition celebrates what we’re building every day: observability that helps teams turn signals into action. From powerful dashboards to "actually useful" AI with Grafana Assistant, Grafana Cloud is all about making complex systems easier to understand. 🤖✨
Huge thank you to our customers and community, we wouldn't be here without you 🧡
Read more 👉 devopsdozen.com/devops-dozen-2026-tools-and-services-awar… -
Grafana
@grafana
Grafana ❤️ OpenTelemetry
From the stabilization of certain Semantic Conventions to introducing OpenTelemetry eBPF Instrumentation, here’s a look back at some key #opentelemetry project milestones in 2025 and a glimpse at what’s next. grafana.com/blog/opentelemetry-and-grafana-labs-whats-new… -
Grafana
@grafana
You can't escape the iron triangle of cost, quality, and time. But...
You can change where the toil lives, with AI-powered investigations in Grafana Cloud.
Learn how Grafana Assistant Investigations is changing the dynamics of uptime economics.
grafana.com/blog/breaking-the-iron-triangle-how-ai-powere… -
Grafana reposted
Tridev Gurung
@tridevgurung
i was trying grafana assistant few weeks back. game changer. all i did was gave some prompts and it created beautiful dashboards. used to take a full day for that.
-
Grafana
@grafana
In Ep. 14 of Grafana Alloy for Beginners, Mischa Thompson walks through the solutions to all four Alloy missions and wraps up what you've learned across logs, metrics, & traces.
Thanks for following along!
🎥 Watch: www.youtube.com/watch?v=qmwMGXx7FFE -
Grafana
@grafana
The last day to submit your #grafanacon talk is quickly approaching!
Tell us about your plugins, dashboards, best practices, or that one unexpected use case that delighted you.
Speakers get free entry to GrafanaCON and a speaker gathering. Apply: pretalx.com/grafanacon-2026/cfp -
Grafana
@grafana
“Grafana Cloud lets us understand our services, create real SLOs, and fix problems before they affect customers. It’s become essential to how we build.”
@honalegal's story showcases how our open observability cloud accelerates development.
grafana.com/success/hona/?mdm=social&src=tw -
Grafana
@grafana
For software teams, effective planning involves a mix of prioritizing the backlog, setting realistic roadmap goals, and justifying those decisions.
Learn how one of our teams developed a new scoring method to help them balance those priorities so they can focus on delivering innovative new features to Grafana Labs customers: grafana.com/blog/a-better-way-to-prioritize-feature-backl… -
Grafana
@grafana
Upcoming #pyroscope community call:
Source code integration with #java and #python
Join us on Thursday, Jan 15 at 8AM PT/5pm CET. See you there!
www.youtube.com/watch?v=OYYrSdMTlaE -
Grafana
@grafana
The #observability landscape is always evolving, but those shifts might kick into overdrive this year.
From unified observability to AI, here are the trends you need to be aware of for 2026. grafana.com/blog/2026-observability-trends-predictions-fr… -
Grafana
@grafana
Observability is critical, but the old model of collect everything, pay for everything isn’t working anymore: thenewstack.io/can-opentelemetry-save-observability-in-2026/
In @bcamerongain's latest piece for @TheNewStack, @tom_wilkie explores how #opentelemetry, combined with intelligent tooling (*ahem* Adaptive Telemetry), and transparent cost models, can reshape observability in 2026. -
Grafana reposted
Mart
@itsmja00
I saw this and thought it was really cool, so I made my own for the MTA.
grafana.mart.fyi/public-dashboards/6c4f599ed548488fa3e7d4…
alistair
@alistaiir
I started recording everything happening on UK rail🚆
grafana.traini.ac/public-dashboards/fb3b963903244df8bae5f… -
Grafana
@grafana
Even with a powerful database or visualization layer, performance can suffer if queries or system settings aren’t tuned.
Follow these tips to improve query performance in Grafana Cloud. grafana.com/blog/grafana-dashboards-tips-for-optimizing-q… -
Grafana
@grafana
Jumping into a new stack is always tricky.
Find out how a new Grafanistas got over his imposter syndrome and quickly got up to speed with the help of Grafana Assistant, our AI agent designed specifically for Grafana. grafana.com/blog/shorten-your-inner-loop-as-a-new-hire-an… -
Grafana
@grafana
Your contact center is talking. Are you listening… or drowning in logs?
By visualizing data from your @3CX phone system in Grafana, you gain detailed insights into call volumes, agent activity, call statuses, and more.
grafana.com/blog/how-to-visualize-your-3cx-contact-center… -
Grafana
@grafana
There's less than 2 weeks left to submit your #grafanacon talk!
🔗: pretalx.com/grafanacon-2026/cfp
Tell us about your plugins, dashboards, best practices, or that one unexpected-but-awesome use case that delighted you.
We welcome:
• First-time speakers
• Hands-on practitioners
• OSS contributors
•Folks building with #prometheus, Loki, Mimir, #otel, Alloy, and the whole big-tent ecosystem
Speakers get free entry to GrafanaCON and a fun speaker gathering. -
Grafana
@grafana
🕵️ Ready for your Alloy missions?
Ep. 13 of Grafana Alloy for Beginners drops four challenges to test your skills, from finding hidden tokens to reducing label cardinality, standardizing attributes, and redacting sensitive data.
🎥 Watch: youtu.be/obUholL0E58 -
Grafana
@grafana
Sleep well.... if you can.
This new dashboard by @simon_prickett tracks the UK faithfuls and traitors.
Experience it in Grafana Play: play.grafana.org/d/siqtdwm/the-traitors-uk-series-4?orgId…
#thetraitorsThis media couldn't be displayed. See it on the original post. -
Grafana
@grafana
While working on Adaptive Metrics, we discovered that #kafka’s architecture solved problems we were struggling with — even if running Kafka wasn’t our favorite part. Then @warpstream_labs appeared.
Kafka semantics, object storage economics.
Sometimes the timing really is perfect. 🎯
Watch the new Big Tent podcast episode: youtu.be/iOiPD-gxgRs
🎧 Or listen wherever you get your podcasts.
Spotify: open.spotify.com/show/3beQvS8to0rYs1gxOnPrfD
Apple Podcast: podcasts.apple.com/us/podcast/grafanas-big-tent/id1616725129
Featuring @tom_wilkie, @pracucci, @ryanworl, @matryer, and @Kuqd.This media couldn't be displayed. See it on the original post. -
Grafana
@grafana
Need to ingest #grafana-managed alert payloads directly into @ServiceNow?
Follow this step-by-step guide to help your team parse complex alert JSON files, map fields into ServiceNow tables, and automate incident workflows using a scripted REST API. grafana.com/blog/servicenow-and-grafana-how-to-receive-al… -
Grafana
@grafana
Proud moment: Grafanistas Martin Costello and Bryan Boreham made it to the 2026 OpenUK Honours List!
This list celebrates some of the individuals supporting the UK’s leadership in Open Technology: openuk.uk/honours/
Congratulations, Martin and Bryan! -
Grafana reposted
akvn
@0xAkvn
Grafana's new Instrumentation Hub is a game changer. You can literally pick and choose what you want to instrument (metrics, logs, traces, and/or profiles) for every single service running on your cluster and it will do it for you automatically.
Grafana
@grafana
Now available in public preview in Grafana Cloud, Instrumentation Hub is a control plane for remote discovery and selective auto-instrumentation.
See how we're providing an opinionated, guided way to roll out and manage observability coverage at scale.
grafana.com/blog/instrumentation-hub-a-guided-scalable-wa… -
Grafana reposted
TheOperator 🇨🇭
@HB9VQQ
The new year starts with exceptional DX conditions on 10m grafana.gafner.net/goto/VlCrZg4Dg?orgId=1
-
Grafana reposted
yang
@chyuang2
Health data, also in Grafana
-
Grafana reposted
alistair
@alistaiir
I started recording everything happening on UK rail🚆
grafana.traini.ac/public-dashboards/fb3b963903244df8bae5f… -
Grafana
@grafana
🙃 First Monday post-holiday energy:
• Circling back on that "we'll add a runbook later" note. It is, unfortunately, later.
• Revisiting the "we'll fix this after the holidays" ticket (it aged badly).
• Upgrading the thing we refused to touch pre-holidays because we "value peace."
• Reauthing that one Grafana data source that also decided to go OOO over the holidays.
• Remember that additional observability coverage you said you'd add to that service in the new year?... Well, here we are.
Happy 2026 (after we finish circling back)! -
Grafana
@grafana
Grafana Cloud Application Observability, enables the C Spire team to:
🔎 Click into services and see what’s downstream to pinpoint the root cause of slowness
🚀 Plan their next steps with Grafana Asserts, IRM, and deeper integrations with ServiceNow
From faster troubleshooting to future-proofing, Application Observability became the deciding factor for their move to the cloud.
Hear the full story 👉 grafana.com/events/obsessions/2025/atlanta/how-c-spire-mi… -
Grafana
@grafana
New year — more tail sampling benefits and less complexity.
In this blog post, we explain the difference between tail sampling and head sampling in distributed tracing, and how Adaptive Traces in Grafana Cloud delivers the benefits of tail sampling without the complexity: -
Grafana
@grafana
Most teams only notice instrumentation gaps during an incident.
Hear why Grafana Labs’ Director of Product predicts that AI can help close said gaps 👇 -
Grafana
@grafana
What's better than receiving alerts on your laptop? Receiving alerts on your toy robot, of course.
Find out how to set yours up with Grafana Cloud. grafana.com/blog/beep-boop-how-to-visualize-grafana-cloud… -
Grafana
@grafana
Jan 1, 2026 is the last day to complete the Observability Survey anonymously and be part of the upcoming report: grafana.com/observability-survey/
You'll have the option to enter to win Grafana swag. A special thanks to all those who've already taken it! -
Grafana
@grafana
🪵 Time to generate logs from traces!
In Ep. 12 of Grafana Alloy for Beginners, Mischa Thompson shows how to use Alloy to turn your application traces into clean, structured log lines, and send them into Loki for analysis.
🎥 Watch: youtu.be/r4qawjD7j4M -
Grafana
@grafana
You've heard that high cardinality can be bad, but do you really know why?
Take a closer look at this telemetry challenge and get tips for mitigating issues to help keep down costs and improve your queries.
grafana.com/blog/what-is-high-cardinality-and-is-it-as-sc… -
Grafana
@grafana
Now available in public preview in Grafana Cloud, Instrumentation Hub is a control plane for remote discovery and selective auto-instrumentation.
See how we're providing an opinionated, guided way to roll out and manage observability coverage at scale.
grafana.com/blog/instrumentation-hub-a-guided-scalable-wa… -
Grafana
@grafana
Your users shouldn't be the first to know when your application goes down!
HTTP checks in Grafana Cloud Synthetic Monitoring can help you proactively monitor your endpoints, verify that they're online, measure response times, and more.
grafana.com/blog/how-to-perform-http-checks-in-grafana-cl… -
Grafana
@grafana
Modern observability demands both breadth and depth, and no single instrumentation technique delivers it all.
Here’s why you should combine #ebpf and SDKs for #opentelemetry instrumentation: grafana.com/blog/why-opentelemetry-instrumentation-needs-… -
Grafana
@grafana
AI in observability is powerful, but building trust still matters.
Keeping humans in the loop is how we make it work when it matters most. -
Grafana
@grafana
📝 Time to bring in application logs!
In Ep. 11 of Grafana Alloy for Beginners, Mischa Thompson shows how to ingest logs from your app services, process them through Alloy, and send them into your observability setup.
🎥 Watch: youtu.be/EpJSBPlW-iA -
Grafana
@grafana
With the year coming to an end, we're excited to share 2025's memorable #grafana use cases and dashboards.
With all the innovative ways the community used our dashboards this year, it begs the question: What can't you do with Grafana?
See them all: grafana.com/blog/grafana-community-dashboards-memorable-u… -
Grafana
@grafana
Our 4th annual Observability Survey is closing on Jan 1, 2026. Help the community understand the state of observability — take the survey!
Your responses will be anonymous and you can opt in for your chance to win #grafana swag: grafana.com/observability-survey/?mdm=social -
Grafana
@grafana
📈 Learn how to extract, process, and visualize survey data in #grafana.
You can use the same techniques for corporate reporting and sales figures, event attendance, or any other information you want to represent in a beautiful and interactive way.
grafana.com/blog/how-to-share-and-analyze-survey-data-or-… -
Grafana
@grafana
New to logging and not sure how Grafana Loki differs from other traditional logging tools: medium.com/@kedarnath93/the-art-of-the-labels-a-non-techn…
#grafana Champion Kedarnath Grande's blog covers the basics of Loki and how it uses a different type of indexing to overcome some common observability challenges. -
Grafana
@grafana
’Twas the Friday before the holidays, when all through Grafana,
The charts were steady (a rare kind of nirvana).
Observability was set with attentive care —
Happy holidays to you, and smooth systems everywhere! -
Grafana
@grafana
2025 was the year we at Grafana Labs went all-in on #ai — and what a year it was!
Look back at how we've been building actually useful AI, spearheaded by our development of Grafana Assistant.
grafana.com/blog/the-year-in-ai-at-grafana-labs/?camp=blo… -
Grafana
@grafana
“How did Prometheus go from a SoundCloud side project to 3.0?”
Ep. 2 of Grafana’s Big Tent podcast features Julius Volz, co-creator of #prometheus and founder of PromLabs & #promcon, and “RichiH” Hartmann, Sr.Developer Programs Director at Grafana Labs and Prometheus maintainer.
Watch: youtu.be/XvvBkhSasH4This media couldn't be displayed. See it on the original post. -
Grafana
@grafana
What a year! 2️⃣0️⃣2️⃣5️⃣
From launching #grafana Assistant to hosting our first-ever #grafanacon Science Fair with plenty of clever #iot creations, 2025 was full of standout moments for Grafana Labs and our #opensource community.
grafana.com/blog/2025/12/11/grafana-labs-top-10-moments-o… -
Grafana
@grafana
Candle monitoring... sounds lit! 🔥
Watch the latest episode of the Big Tent podcast, all about homelabs and #raspberrypi stashes: youtu.be/p22K_Q0SAlo
Featuring @ivanahuckova, @andrewmccalip, Brad Fitzpatrick, and hosts @matryer and @tom_wilkie. -
Grafana reposted
SecretiveShell
@SecretiveShell
Grafana assistant is an amazing product when you need to get an overview of a problem
-
Grafana reposted
VMblog
@vmblog
2026 is the year #observability moves from prototype to practice.
@Grafana's Maurice Rochau explores the rise of autonomous #aiagents: from passive assistants to active operational teammates.
Read the #predictions: vmblog.com/archive/2025/12/17/ai-in-observability-moves-f…
#ai #sre #cloud -
Grafana
@grafana
📉 Time to add application traces to your Alloy pipelines!
In Ep. 10 of Grafana Alloy for Beginners, Mischa Thompson shows how to ingest spans from your services, batch them, and send them into Tempo for analysis.
🎥 Watch: youtu.be/0Twbc69n03A -
Grafana
@grafana
There’s a special place in the snow for observability issues that ruin everyone’s day. We've got just the thing.
The name's Grafana Assistant.This media couldn't be displayed. See it on the original post. -
Grafana reposted
Syed Usman Ahmad
@usahmad87
Topic: Holiday Special ✨🎄🎉 Year 2025 Recap
Date: Friday 19th December
Time: 1:30 PM UTC (3:30 PM CEST)
💡 Join the holiday special #grafana Campfire Community Call where we celebrate year 2025 achievements
👉 Complete Agenda:
community.grafana.com/t/grafana-campfire-holiday-special-… -
Grafana
@grafana
“80% of the data you store is never used — and no vendor tells you which 80%.” @tom_wilkie
At #reinvent, Tom broke down how Adaptive Telemetry + AI are changing what’s possible in observability.
🎥 Watch the interview: youtu.be/PHHYZ1z0Igs -
Grafana
@grafana
😱 The Grinch is sabotaging Santa’s infrastructure!
Your mission: fix the chaos with the help of #grafana Assistant.
Play our new browser game where you tackle observability challenges inside Santa’s workshop to save Christmas — all while getting hands on with AI-powered #observability👇
grotvsgrinch.com -
Grafana
@grafana
You: I'd like to speak to the [product] manager about AI in observability. I have questions.
Us: We've got answers. Join our first ever Grafana Assistant webinar on Dec 17, 2025: grafana.com/go/webinar/getting-started-with-grafana-assis…
Here's what @rperry_ will cover:
🦾 What Grafana Assistant is and how it helps anyone get answers faster
🤖 See how Grafana Assistant works directly inside Grafana Cloud to help you query, build dashboards, and troubleshoot without learning PromQL
⁉️ Discover prompting best practices to get the most accurate, relevant responses grounded in your own environment
🛡️ Get answers to common legal and security FAQs so your team can confidently get started with AI in Grafana -
Grafana reposted
The New Stack
@thenewstack
That depends on how you measure all vendors' approaches to AI. But @grafana's new AI-based capabilities do signify practical improvements.
By @bcamerongain thenewstack.io/has-grafana-taken-lead-in-ai-for-observabi… -
Grafana
@grafana
🚨 Reminder: starting Jan 1, 2026, Grafana Assistant will bill based on active users each month. There's *still* time to use Grafana Assistant in your observability workflows for free!
The Grafana Cloud free tier includes 3 Grafana Assistant users with limited messages; paid plans include 3 users with fair-use and $20 per additional active user: grafana.com/docs/grafana-cloud/machine-learning/assistant… -
Grafana
@grafana
🚨 Alert fatigue. Is it still public enemy #1 when it comes to faster incident response?
This is one of the questions we're asking in the 4th annual Observability Survey (not quite in those words).
Share your perspective and you can opt in to win #grafana swag!
Your responses will help shape the report and analysis that'll be published for the community next year.
It's anonymous and takes up to 10 minutes to fill out: grafana.com/observability-survey/?mdm=social&src=twThis media couldn't be displayed. See it on the original post. -
Grafana
@grafana
Infrastructure & application code have version control, but Grafana dashboards often don’t.
Git Sync in #grafana 12 (experimental) enables version control for dashboards while keeping the familiar UI-based editing: devopscube.com/observability-as-code-with-grafana-git-sync/
This blog post by Grafana Champion @heyiqbalpb covers how to set it up and when you should/shouldn't use it. -
Grafana
@grafana
In this blog post by Grafana Champion @jorgedlcruz, he walks through how to monitor an unofficial Veeam ONE Node Exporter using #grafana, #influxdb, and #telegraf.
jorgedelacruz.uk/2025/10/07/looking-for-the-perfect-dashb… -
Grafana
@grafana
Trying to visualize different data formats like JSON, CSV, XML, GraphQL and HTML endpoints?
#grafana Champion @ledinhcuong99 shares why and how the Grafana Infinity Datasource can help: ledinhcuong99.medium.com/visualize-any-data-with-grafana-… -
Grafana
@grafana
🤖 If you're looking for a sign to try out Grafana Assistant, here it is.
In this blog, CSS Electronics shares how to get started with practical tips and 7 jaw-dropping ways you can use Grafana Assistant to accelerate your data analysis and dashboard creations: -
Grafana reposted
Mat Ryer
@matryer
I haven’t seen community opinion drive what we do as much as it does at Grafana Labs.
Tell us what actually works (and what doesn’t) in your observability stack.
It’s anonymous so be brutal :)
👉 grafana.com/observability-survey/?src=mat -
Grafana
@grafana
🇪🇸 Sagrada Famili-YEAH: #grafancon 2026 is heading to Barcelona! Want 1st dibs on 50% discount tickets? Sign up for notifications: grafana.com/events/grafanacon?mdm=social&src=tw
It's our biggest community conference of the year — all about the OSS #observability ecosystem: #grafana, #opentelemetry, #prometheus, and more, plus the plugins and collectors that power your stack. -
Grafana
@grafana
'Tis the season! 🎅
Pandelis
@PandelisZ
Who ordered a @grafana for Christmas?
-
Grafana
@grafana
#grafana + #opentelemetry = ❤️🔥
We’ve launched a new Community Call diving into all things OTel + Grafana. Next up on Dec 17 → Logging Best Practices: youtube.com/live/D-bWeY-gBWU
Join us & help shape the future of OTel + Grafana! -
Grafana
@grafana
Many Grafana users like to share their favorite dashboards or panels in emails or presentations.
The #grafana Image Renderer is a backend service for Grafana that helps you do just — and with recent updates, it's even more performant and reliable. grafana.com/blog/2025/12/03/whats-new-in-the-grafana-imag… -
Grafana
@grafana
📊 Time to level up your app observability!
In Ep. 9, Mischa Thompson walks through how to use Alloy to scrape application metrics from your services and get them flowing into your dashboards.
🎥 Watch: youtu.be/73Y2LwucXNg -
Grafana
@grafana
Congrats and welcome to the clurb 🙌
John Potess
@johnpotess
Nothing like your first Grafana dashboard, feels good to be building again
-
Grafana reposted
Nati Yeshi
@natiyeshi16
I didn’t know Grafana was this powerful. One dashboard later and I’m hooked
-
Grafana
@grafana
This Grafana use case.... who's hungry? 🤤
Swissky
@pentest_swissky
Grafana Dashboard for my Blackstone Smoker - @PaulWebSec
paulsec.github.io/posts/grafana-dashboard-for-my-blacksto… -
Grafana
@grafana
🤝 We're excited to partner with @CoreWeave on Mission Control, their unified operating standard to run large-scale AI workloads efficiently, securely, and reliably.
www.coreweave.com/news/coreweave-expands-mission-control-… -
Grafana reposted
labrute
@labrute974
My API was fairly slow, so decided to put in some tracing.
Given I didn't want to spend extra money, it's limiting what one can do when it comes to tracing / logging / metrics.
But as a solo founder, @grafana Cloud offer works great for me!
#buildinpublic -
Grafana reposted
rod.codes
@rod_codes
Got to say, Grafana Cloud is pretty fucking easy to use - and for a startup, the limits are very reasonable. With the MCP, it's like a self dashboard creating super operations analyst.
-
Grafana reposted
akvn
@0xAkvn
The other day, 1 TB of data was mysteriously deleted. Of course, I recovered it using the backup, but management requested a detailed investigation. So, I asked @grafana Assistant to investigate the culprit. In a minute, it generated a detailed investigation report based on the findings from the messy logs.
Grafana Assistant really keeps impressing me, it once again saved me a lot of time! -
Grafana
@grafana
Has your #opentelemetry usage increased in the past year? What about #prometheus?
These are some of the questions we're asking in the 4th annual Observability Survey. Share your perspective and you can opt in to win #grafana swag!
Your responses will help the community understand the state of #observability, and shape the report and analysis that'll be published next year.
It's anonymous and takes up to 10 minutes to fill out: grafana.com/observability-survey/?mdm=social&src=twThis media couldn't be displayed. See it on the original post. -
Grafana
@grafana
🧑🎓 New to #grafana? Our popular "Getting Started with Grafana" webinar is back!
Register to join us on Dec 10: grafana.com/go/webinar/getting-started-with-grafana-lgtm-…
We'll show you how to build your first dashboard, and how you can connect to a wide range of data sources, regardless of where it lives, to get a unified view of your data in a single dashboard. -
Grafana
@grafana
Back in May, we introduced the public preview of Grafana Drilldown Investigations, a new feature intended to help Grafana OSS & Grafana Cloud users accelerate their incident response.
Now, as we head into the new year, we’ve made the difficult decision to deprecate this feature from OSS and deprovision it from Grafana Cloud.
Your Drilldown apps (logs, metrics, traces, profiles) will not be affected, and neither will the classic Explore. Also, Drilldown Investigations should not be confused with Grafana Assistant Investigations, which remains available to all Grafana Cloud users.
Though this feature never became generally available, we want to be transparent about the decision.
Here's everything you need to know: grafana.com/blog/2025/12/04/removal-of-drilldown-investig… -
Grafana
@grafana
🕰️ We're going back in time (with the time machine that never happened)... to the recording of #grafana's Big Tent S3E1.
Watch the new episode on #homelabs and #raspberrypi stashes, featuring @ivanahuckova, @andrewmccalip, Brad Fitzpatrick, and hosts @matryer and @tom_wilkie:
youtu.be/p22K_Q0SAlo
🎧 Or listen wherever you get your podcasts.
Spotify: open.spotify.com/show/3beQvS8to0rYs1gxOnPrfD
Apple Podcast: podcasts.apple.com/us/podcast/grafanas-big-tent/id1616725129 -
Grafana
@grafana
You can now send #opentelemetry traces and logs from Cloudflare Workers to Grafana Cloud ☁️
The new #cloudflare Workers integration for Grafana Cloud also offers pre-built dashboards, allowing you to quickly visualize and get value from your data.
This includes the ability to drill down into traces and logs based on attributes like request location and duration.
Learn about this new integration from Ishan Jain, Grafana Labs and Nevika Shah, @Cloudflare: grafana.com/blog/2025/12/04/send-opentelemetry-traces-and… -
Grafana
@grafana
🛎️ The new Grafana Cloud Service Center is a comprehensive hub for all service-related activities.
Monitor performance trends, minimize disruptive alerts, analyze past incidents, and understand on-call page load — all in one place. grafana.com/blog/2025/12/01/improve-service-reliability-a… -
Grafana
@grafana
🎨 Some dashboards are more than charts. They're art. And they deserve the spotlight.
Enter the #goldengrot Awards with a #grafana dashboard you're proud of — personal or professional by 10 Feb 2026: grafana-labs.typeform.com/to/Msv9tSgC?typeform-source=gra…
Learn more about the awards program and see past winners: grafana.com/golden-grot-awards/?mdm=social&src=tw -
Grafana
@grafana
🚗 We’re taking #observabilitycon on the road and this year, we’re opening the door for partners to join us as official sponsors.
If you want to amplify your brand, connect with Grafana users, and engage directly with observability practitioners in your region, we’d love to hear from you.
Reach out to sponsors@grafana.com to learn more about sponsorship opportunities. -
Grafana
@grafana
🧑🎓 The new Interactive Learning feature in Grafana 12.3 brings learning resources directly into the #grafana platform.
Find the answers you're looking for easily as you run into questions — no context switching required. grafana.com/blog/2025/12/02/contextual-in-product-guidanc… -
Grafana
@grafana
🖥️ Meet the Alloy UI: your new debugging superpower.
In Ep. 8 of Grafana Alloy for Beginners, Lisa Jung shows how to use Alloy’s UI to inspect component health, watch live telemetry flow, explore the visual pipeline graphs & debug issues fast.
Watch: www.youtube.com/watch?v=B-5bcVlVuMY -
Grafana
@grafana
🪵 Logs can tell us so much about the state of our systems, but they can also be a bit overwhelming.
See how Grafana Logs Drilldown can help you get the most out of your logs — whether you're new to Loki or highly proficient in #logql. grafana.com/blog/2025/11/18/how-to-pair-grafana-drilldown… -
Grafana
@grafana
🚀 “The features available in Grafana Cloud are tremendous: Application Observability, k6, Grafana IRM, Fleet Management…
All things we didn’t even see in the paid enterprise version we were evaluating. They all looked so useful that we couldn’t pass them up.” – Zachary Sistrunk, C Spire
Learn more about how C Spire migrated their #observability platform to gain a single pane of glass across metrics, logs, and traces: grafana.com/events/obsessions/2025/atlanta/how-c-spire-mi… -
Grafana
@grafana
That feeling when Grafana Labs finds a way... just in time for #awsreinvent 😃
This is made possible through our new integration with Amazon CloudWatch & Amazon Data Firehose.
Chat with us at booth #137 or learn more: grafana.com/blog/2025/09/03/aws-metric-ingestion-for-less…This media couldn't be displayed. See it on the original post. -
Grafana
@grafana
Webinar on Dec 3: Intro to Application and Frontend Observability with Grafana Cloud
Register to join the live Q+A or to receive the recording: grafana.com/go/webinar/intro-to-application-and-frontend-…
You'll learn how to:
• Monitor application and frontend performance using Grafana’s out-of-the-box dashboards and workflows
• Reduce #mttr by correlating metrics, logs and traces across the full stack
• Standardize on #opentelemetry and Prometheus to avoid vendor lock-in
• Use #grafana Beyla (now OpenTelemetry #ebpf Instrumentation), to easily get started with application observability -
Grafana
@grafana
Correlations: a #grafana feature that lets you jump from a chart to logs or traces w/ 1 click.
The time range & label values are carried automatically — no copying + pasting, no new agents.
Learn how to use them with 3rd-party data in Grafana.
grafana.com/blog/2025/11/21/breaking-siloes-how-to-use-cr… -
Grafana
@grafana
In part 2 of our complete guide to observing #ai agents on #amazonbedrock #agentcore, we focus how to monitor the infrastructure layer.
grafana.com/blog/2025/11/28/how-to-monitor-amazon-bedrock… -
Grafana
@grafana
3 days until the Grafana Labs team is at #awsreinvent.
Swing by booth #137 and our experts will walk you through:
🔸 AWS observability in Grafana Cloud
🔸 Easier, faster, and more cost-effective observability with our latest #ai/ML developments
Book dedicated time to discuss your project with Grafana experts or our leadership team. Reach out or submit a request here: grafana.com/events/aws-reinvent/?mdm=social&src=tw -
Grafana
@grafana
#ai agents offer all sorts of benefits, but they can also be notoriously difficult to monitor.
Follow this guide to see how you can use #grafana Cloud to monitor agents built in #amazonbedrock #agentcore. grafana.com/blog/2025/11/26/how-to-monitor-ai-agent-appli… -
Grafana
@grafana
🙏 Feeling extra grateful for our wonderful community today. Whatever LGTM+ means to you today —
Leftovers Go To Me;
Let’s Give Thanks, Mate;
Limitless Gravy and Turkey Mayhem;
or simply Loki, Grafana, Tempo, and Mimir —
we wish you a happy Thanksgiving! -
Grafana reposted
-
Grafana
@grafana
The 4th annual Observability Survey is in motion & we need your input!
Share your (anonymous) input on tooling, AI, cost & complexity in ~10 mins for a chance to win #grafana swag. We'll publish a free report for the community.
Take the survey: grafana.com/observability-survey/?camp=survey-2025&mdm=so… -
Grafana
@grafana
🛠️ New episode drop!
In Ep. 7 of Grafana Alloy for Beginners, Lisa Jung walks through how to expose, scrape, and relabel Postgres metrics with Alloy and then export them to Mimir, Grafana’s Prometheus-compatible metrics backend.
🎥 Watch to learn how: youtu.be/U_MWuJR76d4 -
Grafana
@grafana
🤝 The new #temporal Cloud integration for Grafana Cloud gives teams an easy way to visualize, monitor, and alert on the health of their Temporal Workflows, all within #grafana Cloud. grafana.com/blog/2025/11/24/monitor-temporal-workflows-se…
-
Grafana
@grafana
🎤 The #grafanacon 2026 #cfp is officially open, and we want your talk!
Tell the community about your plugins, dashboards, best practices, or that one unexpected-but-awesome use case.
We welcome:
• First-time speakers
• Hands-on practitioners
• OSS contributors
• Folks building with Prometheus, Loki, Mimir, OTel, Alloy, and anything within the Big Tent ecosystem
Speakers get free entry to GrafanaCON and a fun speaker gathering.
Apply by 19 Jan: pretalx.com/grafanacon-2026/cfpThis media couldn't be displayed. See it on the original post. -
Grafana reposted
Causely
@Causelyai
It's Thanksgiving week, and we’re grateful for open-source projects that push #observability forward — like @grafana #beyla.
Here’s our breakdown of why Beyla matters + how to get started:
www.causely.ai/blog/thank-you-grafana-beyla-how-to -
Grafana
@grafana
🇪🇸 #grafanacon 2026 is heading to Barcelona, Spain from 20-22 Apr!
Get ready to feel on tapas the world at our biggest community conference of the year.
This conference goes beyond #grafana. It’s also about all of the other open source projects in our ecosystem (#opentelemetry, #prometheus, Loki, etc.), plus related data source plugins and collectors.
Sign up to receive notifications when 30% discount tickets go on sale: grafana.com/events/grafanacon/?mdm=social&src=tw -
Grafana
@grafana
Learn how continuous profiling can offer deep visibility into the performance of a highly optimized codebase, as well as provide clear targets for optimizing CPU usage. grafana.com/blog/2025/11/14/continuous-profiling-for-nati…
-
Grafana
@grafana
“We're not [load] testing to celebrate every green light.. we load test to uncover failures.”
Senior SRE Christopher Orchard shared how Just Eat takeaway.com built a blameless culture around reliability & why Grafana Cloud k6 is central to it.
Watch: youtu.be/qG5tCR4OS9g -
Grafana
@grafana
🛒 #blackfriday is coming. A reminder to #loadtest before the internet stampedes your app.
We'd prefer that this meme stays hypothetical for you.
Learn how Just Eat takeaway.com load tests with Grafana Cloud k6 to ensure millions of people across 17 countries get their orders reliably:
grafana.com/events/observabilitycon/agenda/2025/just-eat-… -
Grafana
@grafana
📣 Tickets are now on sale for #observabilitycon on the Road in the following cities:
🇩🇪 Frankfurt (Feb 5)
🇨🇦 Toronto (Mar 5)
🇦🇺 Sydney (Mar 10)
🇯🇵 Tokyo (Mar 17)
🇳🇱 Amsterdam (Mar 31)
➕ More locations & dates to be announced
Join us for a 1-day event and learn about our new innovations around actually useful #ai, how we're reimagining the economics of #saas, and new ways to simplify complexity in #observability.
Save 30% on your registration fee for a limited time: grafana.com/events/observabilitycon-on-the-road/?mdm=soci… -
Grafana
@grafana
Now GA: #azure Monitor dashboards with #grafana 🎉
This service provides Azure users with Grafana dashboards natively integrated within the Azure Portal: grafana.com/blog/2025/11/18/azure-monitor-offers-grafana-…
Use prebuilt dashboards to start monitoring your Azure ecosystem — available by default for over a dozen Azure services. -
Grafana
@grafana
🚨 Along with the release of Grafana Enterprise 12.3, we've released updated versions of Grafana Enterprise 12.2.1, 12.1.3 and 12.0.6 — all of which contain a critical severity security fix for CVE-2025-41115.
grafana.com/blog/2025/11/19/grafana-enterprise-security-u… -
Grafana
@grafana
#grafana 12.3 has landed! 🚀 This release delivers new features for:
∙ Interactive learning within the Grafana UI
∙ Deeper insights into #logging data
∙ Data visualization updates for greater flexibility and control
∙ New updates in data sources (hint: #solarwinds, Amazon #cloudwatch, #databricks, #honeycomb, and #opensearch)
Learn more: grafana.com/blog/2025/11/19/grafana-12-3-release-all-the-… -
Grafana
@grafana
📈 Time to dive into metrics!
In Ep. 6 of Grafana Alloy for Beginners, Lisa Jung shows how Alloy discovers, scrapes & exports infrastructure metrics without manually tracking all the telemetry sources.
🎥 Watch now: youtu.be/tT2r5gHFqzY -
Grafana
@grafana
#remotework at Grafana Labs means:
You get time back in your day.
You're enabled to do better work.
Being remote-first enables our team to be based where they feel most productive and to ensure that work and life aren't in competition.
Remote-first is *not* remote only. Grafanistas enjoy the opportunity to come together during team offsites or in shared co-working spaces. Connection is important.
If this sounds something you want to be a part of, see our openings and apply. We're hiring all around the world: grafana.com/about/careers/?mdm=social&src=tw -
Grafana
@grafana
Whether you’re preparing for #blackfriday, a major product launch, or some other peak seasonality event, the key is to test system reliability early and often — ideally throughout the year.
Here's how to do just that with Grafana Cloud k6.
grafana.com/blog/2025/11/12/performance-testing-best-prac… -
Grafana
@grafana
Say hello the redesigned Grafana Play 👋 It's a free sandbox environment where anyone can explore and learn about #grafana.
No setup or sign-in required.
We updated the homepage to celebrate our wonderful community and make the page more welcoming and *playful*.
Check out the new experience and let us know what you think: grafana.com/blog/2025/11/17/grafana-play-updates-a-redesi… -
Grafana
@grafana
We're big believers in hackathons here at Grafana Labs.
See how we helped @GEOTAB complete a successful Grafana-focused session and get some tips for how to make the most of your next #hackathon. grafana.com/blog/2025/10/31/hacking-observability-for-veh… -
Grafana
@grafana
During a recent internal incident, #grafana Assistant Investigations found the cause 3.5x faster than our on-call engineers.
See how Grafana Cloud's newest #ai feature helps engineers focus on delivering great products instead of putting out fires.
grafana.com/blog/2025/11/17/a-tale-of-two-incident-respon… -
Grafana reposted
The New Stack
@thenewstack
That depends on how you measure all vendors' approaches to AI. But @grafana's new AI-based capabilities do signify practical improvements.
By @bcamerongain thenewstack.io/has-grafana-taken-lead-in-ai-for-observabi… -
Grafana
@grafana
"... I can attest firsthand that Grafana’s #ai support is useful when setting up & integrating #grafana with #opentelemetry, bringing metrics data from both AWS & GCP data sources to gather metrics to my Grafana panel." - @bcamerongain, @thenewstack
thenewstack.io/has-grafana-taken-lead-in-ai-for-observabi… -
Grafana
@grafana
✨ A new hope (for your dashboards).
In celebration of Life Day, the Wookiee holiday, we're sharing Ronald McCollam's blog on how he built a #starwars dashboard.
grafana.com/blog/2025/11/14/a-star-wars-dashboard-deep-di… -
Grafana
@grafana
We're excited to announce the public preview of Grafana Cloud Database Observability: grafana.com/blog/2025/11/13/understand-diagnose-and-optim…
Empower your application developers, SREs, and DBAs to understand, diagnose, and optimize their SQL queries.
With Database Observability, you can correlate your data across your entire stack—from application to infrastructure—so you can quickly understand system-wide performance. -
Grafana
@grafana
Grafana Labs is a Leader + Outperformer in the 2025 @gigaom Radar for Cloud Performance Testing 🎯
See why we ranked highest in both the Emerging Features Comparison & Business Criteria Comparison.
🔗 portal.gigaom.com/reprint/gigaom-radar-for-cloud-performa… -
Grafana
@grafana
🏆 We’re proud to be a finalist across 6 categories in the 2025 DevOps Dozen Awards — including Best Observability Solution, Best Open Source Project, & Best AI Application!
We’d love your support — cast your votes by Dec 31: www.surveymonkey.com/r/DevOps-Dozen-2025 -
Grafana
@grafana
Grafana Labs is at KubeCon & CloudNativeCon North America 2025 in Atlanta this week!
Come visit us at booth #444 to chat about Kubernetes monitoring and all things observability, see live demos, and grab some Grafana swag.
Or learn more about Kubernetes Monitoring here: grafana.com/solutions/kubernetes/?mdm=social&src=tw -
Grafana
@grafana
Getting started with observability? Let’s take a closer look at how to work with logs!
In the latest episode of Grafana Alloy for Beginners, Lisa Jung walks through how to collect, process & export infrastructure logs with Alloy, step by step.
🎥 Watch: www.youtube.com/watch?v=FFtvoc6iQVE -
Grafana
@grafana
🇯🇵 Today marks the official launch of Grafana Labs Japan, our new subsidiary in Tokyo!
This expansion brings open observability closer to the amazing innovators across the country. From JAXA’s lunar mission to DENSO’s smart factories, Japan’s already been building incredible things with Grafana. Now, we’re investing even deeper — in people, partnerships, and local innovation.
Read the announcement: grafana.com/about/press/2025/11/12/grafana-labs-establish…
Stay up to date by following @grafanaJP. -
Grafana
@grafana
🇩🇰 We’re heading to Copenhagen!
Join us for Observability Sessions Denmark, where experts & industry leaders share real world insights to help you level up your observability strategy.
Save your spot: grafana.com/events/obsessions/2025/copenhagen/?mdm=social… -
Grafana
@grafana
🥉 Grafana Labs is a top 3 contributor to #opentelemetry, so of course we have a webinar to help your teams get started with OTel and #grafana.
Join us on Nov 26 at 14:00 CET: grafana.com/go/webinar/how-to-instrument-apps-with-otel-a…
Here's what you'll get out of it:
🔸 The OTel TL;DR - why it's important and the common adoption challenges
🔸 A step-by-step walkthrough of basic OpenTelemetry automatic and manual instrumentation
🔸 How to store and visualize OTel data with the Grafana ecosystem (LGTM Stack) + Grafana Cloud for Application Observability
🔸 How to get started with OTel as part of your observability strategy -
Grafana
@grafana
☁️ AWS here, Azure there, GCP somewhere else?
Get a unified view, without moving your data.
Join us for a webinar on Nov. 19 to learn how to simplify cloud monitoring with Grafana Cloud and OpenTelemetry.
Sign up: grafana.com/go/webinar/cloud-infrastructure-monitoring-wi… -
Grafana
@grafana
#opentelemetry can enhance #java application reliability by uncovering hidden production issues through real-time observability and tracing: www.youtube.com/watch?v=T5SEnaUKABw
In this video from our Grafana Champion Cees Bos, learn practical techniques to diagnose problems and improve performance, especially in cloud-native and microservice environments. -
Grafana
@grafana
🤖 New to #mcp? It's an open source standard for connecting #ai applications to external systems.
In this video, Grafana Champion shows how to set up a #grafana MCP server using VS Code. Check out his tutorial.
www.youtube.com/watch?v=HeBY3aHj7ag -
Grafana
@grafana
Too many alerts, not enough insight?
Join our Nov. 13 webinar to see how Grafana IRM & SLOs in Grafana Cloud cut through the noise with AI-powered RCA & automated incident response.
Sign up: grafana.com/go/webinar/getting-started-with-grafana-incid… -
Grafana
@grafana
"[With Grafana Cloud], we’re getting maximum value per dollar and we’re spending on a platform where the skills the team is developing are useful to engineers working in this space."
Check out AuditBoard's success story: grafana.com/success/auditboard/?mdm=social&src=tw -
Grafana
@grafana
As a top 3 contributing company to #opentelemetry, we’re excited to be at #kubecon next week at booth #444.
Don’t miss talks from our Grafanistas with topics ranging from OTel and Prometheus to debugging. See them all 👇
grafana.com/events/kubecon?mdm=social&src=tw -
Grafana
@grafana
The 1st alpha of @opentelemetry eBPF instrumentation (OBI) is live 🎉
Originally Grafana Beyla, OBI brings zero-code, zero-downtime telemetry to any app.
Read the blog post: opentelemetry.io/blog/2025/obi-announcing-first-release/ -
Grafana
@grafana
🚨 Looking for best practices on alerting in Grafana?
Join us Nov 13 for Intro to Alerting with Grafana, a live webinar covering how to cut alerting toil, use adaptive alerts, & focus on what matters most.
🔗 Register: grafana.com/go/webinar/intro-to-alerting-with-grafana/?md… -
Grafana
@grafana
🦄 Lovable, one of Europe’s fastest-growing AI startups, reduced low-value metrics by 93% and saved over $10K per month since turning to Grafana Cloud.
That’s the power of Adaptive Telemetry and the open observability cloud.
See their case study 👇 grafana.com/success/lovable/ -
Grafana
@grafana
By saving and reusing queries in Grafana Cloud, you help new team members get up to speed faster and ensure your entire organization benefits from consistent, well-crafted queries.
Here's how to get started.
grafana.com/blog/2025/10/28/faster-more-collaborative-dat… -
Grafana
@grafana
“We're not [load] testing to celebrate every green light.. we load test to uncover failures.”
Senior SRE Christopher Orchard shared how Just Eat takeaway.com built a blameless culture around reliability & why Grafana Cloud k6 is central to it.
Watch: youtu.be/qG5tCR4OS9g -
Grafana
@grafana
Before you can build Alloy pipelines, you need your playground!
In Ep. 4 of Grafana Alloy for Beginners, Lisa Jung shows how to set up a learning environment that generates metrics, logs, traces & profiles, plus Grafana’s LGTMP stack to observe your environment!
🎥 youtu.be/fZRwVwCvLAg -
Grafana
@grafana
Grafana Mimir 3.0 is here! 🎉
The release marks a new era for the open source, horizontally scalable, multi-tenant time series database (TSDB), delivering dramatic improvements in both reliability and performance. grafana.com/blog/2025/11/03/grafana-mimir-3-0-release-all… -
Grafana
@grafana
From 🍕 apps to production: Grafana k6 Studio records real interactions & turns them into automated performance tests.
Great blog post from Grafana Champion Monish Correia!
medium.com/@monish.correia/from-recording-to-reality-how-… -
Grafana
@grafana
You've got a handle on logs and metrics... but what about traces?
If you're new to Grafana Tempo, join the webinar on Nov 7. We'll demo how to use logs and #prometheus exemplars to find traces effectively in Tempo.
grafana.com/go/webinar/getting-started-with-tracing-and-g… -
Grafana
@grafana
This month's Pyroscope Community Call is happening on Nov 6 at 5 pm CET/8 am PT!
Join the call as the team discusses diff view + metrics from profiles.
www.youtube.com/watch?v=ozf2dtUtohE -
Grafana
@grafana
As part of the 4th Annual Observability Survey, we’re excited to introduce a series where we pair your responses to one of the things we all love to observe — landmarks & world wonders.
🌏Which world wonder best reflects your response? See the thread to find out.
Answer similar questions in the survey for your chance to win a #grafana swag pack! Winners announced each month until Dec. 31, 2025.
grafana.com/observability-survey/?camp=survey-2025&mdm=so…
Grafana
@grafana
-
Grafana
@grafana
☁️ Headed to #kubecon North America?
Book a meeting with the Grafana Labs team to talk observability, Kubernetes, and what’s new in Grafana Cloud.
➡️ events.grafana.com/2025-11-kubeconnorthamerica-meetingreq…
Can’t make it? Learn more: grafana.com/solutions/kubernetes/?mdm=social&src=tw -
Grafana
@grafana
📣 #prometheus native histograms are now GA in Grafana Cloud, giving you greater precision, ease of use, and compatibility for analyzing your metrics.
Discover how they improve on the classic Prometheus histograms. grafana.com/blog/2025/10/30/get-more-precision-from-your-… -
Grafana
@grafana
💰 The Adaptive Telemetry suite in Grafana Cloud enables organizations to capture & surface the data that delivers business value.
This helps eliminate noise, reduce operational complexity, and cut down observability costs — by 30-50% on average: grafana.com/blog/2025/10/08/adaptive-telemetry-suite-in-g… -
Grafana
@grafana
🚀 SQL expressions are now available in public preview in #grafana OSS & Grafana Cloud!
This is a powerful feature that opens up all sorts of creative possibilities by manipulating & combining data from different data sources. grafana.com/blog/2025/10/30/sql-expressions-in-grafana-co… -
Grafana
@grafana
We’re proud to team up with @codingblackfems on a hands-on workshop in London on Nov. 13.
Learn how to turn API data into interactive dashboards — no backend needed!
Sign up. www.eventbrite.co.uk/e/apis-to-omg-transform-your-api-dat… -
Grafana
@grafana
👋 We can’t wait to see you at #kubecon + CloudNativeCon North America 2025!
See our around #prometheus, #otel, and more, and swing by booth #444 in the sponsor solutions showcase to meet the team and score some swag! grafana.com/blog/2025/10/29/grafana-labs-at-kubecon-opent… -
Grafana
@grafana
🛜 Using Grafana Cloud, #telecom company C Spire achieved a 30% reduction in CPU usage & 95% adoption across C Spire’s App Dev teams, spanning over 1,000 service/VMs.
Watch their story: grafana.com/events/obsessions/2025/atlanta/how-c-spire-mi… -
Grafana
@grafana
Learn how a simple AWS Lambda function and Grafana Cloud Logs can transform your GitLab pipeline visibility. grafana.com/blog/2025/10/10/a-serverless-approach-to-ci-c…
-
Grafana
@grafana
🎃 Finally... #halloween costumes that are both heroic *and* scary. IYKYK.
Wishing our community a happy and safe Halloween this week! -
Grafana
@grafana
✋ Stop thinking about observability in terms of siloed pillars.
With Grafana Cloud's opinionated solutions, you can combine your signals to optimize performance, minimize waste, and focus on the data that truly matters. grafana.com/blog/2025/10/16/from-pillars-to-rings-how-int… -
Grafana
@grafana
🧩 Ready make your Grafana dashboards turn heads?
Join us for our Oct. 31 webinar on building advanced dashboards — from data transformations to dynamic drilldowns and annotations.
Sign up: grafana.com/go/webinar/building-advanced-grafana-dashboar… -
Grafana
@grafana
🕑 2:17 a.m. A subtle spike appears that wouldn’t trip any thresholds, but it doesn’t go unnoticed.
Before the on-call engineer’s phone can buzz, a host of AI agents embedded in Grafana Cloud are already at work.
That’s what actually useful AI looks like: -
Grafana
@grafana
🧩 Configuring Grafana Alloy is like assembling LEGO blocks. Each component can be mixed and matched to build your observability pipeline!
In Episode 3 of Grafana Alloy for Beginners, Lisa Jung breaks down the language used to instruct Alloy how to collect, process & export data.
🎥 youtu.be/fN0uwuwm1Fo -
Grafana
@grafana
Haters will say it's AI-generated 😉
A flashback to Grafana beaming on the Tower of London during #observabilitycon.
We're taking this event on the road to cities around the world, packed into a 1-day event: grafana.com/events/observabilitycon-on-the-road/?src=x&md…
Join us for ObservabilityCON on the Road:
🇧🇷 São Paulo (Nov 4) - Waitlist
🇺🇸 Washington, DC (Nov 5) - Registration open
🇪🇸 Madrid (Nov 18) - Registration open
🇺🇸 Dallas (Nov 18) - Registration open
🇩🇪 Frankfurt (Feb 5) - Save the date
🇨🇦 Toronto (Mar 5) - Save the date
🇦🇺 Sydney (Mar 10) - Save the date
🇯🇵 Tokyo (Mar 17) - Save the date
🇳🇱 Amsterdam (Mar 31) - Save the date
🇺🇸 Bay Area (TBD) -
Grafana
@grafana
🪵 Logs.
This blog post gets into some of the challenges that come with taking a logs-first approach in Grafana Cloud and how you can optimize your stack to avoid the typical gotchas: grafana.com/blog/2025/10/20/making-logs-work-smarter-evol… -
Grafana
@grafana
🧛♂️ What scares Count Grotula more than downtime? Deploying on #halloween this Friday. Beware.
If you're batty for Count Grotula, find them and their past costumes on GIPHY: giphy.com/grafana/trick-or-treating-with-grot-halloween-c… -
Grafana
@grafana
⚠️ We'll implement 2 separate release cycle freezes between Nov. and Jan. to help ensure stability for everyone during the holiday season.
Read the details and get a primer on the rolling release channels for Grafana Cloud. grafana.com/blog/2025/10/23/grafana-and-grafana-cloud-rel… -
Grafana
@grafana
And the good news is that for folks who want to just give it a try, we have a free forever tier. That's right. grafana.com/products/cloud/
And it comes with:
🔸10k series Prometheus metrics
🔸50GB logs, 50GB traces, 50GB profiles
🔸500VUk k6 testing
🔸20+ Enterprise data source plugins
🔸100+ pre-built solutions
Branko
@brankopetric00
Evaluated 6 observability platforms for our stack.
Datadog: $8,000/month, everything included
New Relic: $6,500/month, complex pricing
Grafana Cloud: $2,800/month, good enough
Self-hosted Prometheus: $800/month, high maintenance
Elastic Stack: $4,200/month, steep learning curve
Honeycomb: $5,000/month, amazing for traces
We chose Grafana Cloud.
Why:
- Team already knew Prometheus/Grafana
- 80% of features at 35% the cost
- Easy migration from self-hosted
- Could switch to self-hosted if needed
Perfect tool doesn't exist.
Good enough tool that your team will use wins. -
Grafana reposted
Branko
@brankopetric00
Evaluated 6 observability platforms for our stack.
Datadog: $8,000/month, everything included
New Relic: $6,500/month, complex pricing
Grafana Cloud: $2,800/month, good enough
Self-hosted Prometheus: $800/month, high maintenance
Elastic Stack: $4,200/month, steep learning curve
Honeycomb: $5,000/month, amazing for traces
We chose Grafana Cloud.
Why:
- Team already knew Prometheus/Grafana
- 80% of features at 35% the cost
- Easy migration from self-hosted
- Could switch to self-hosted if needed
Perfect tool doesn't exist.
Good enough tool that your team will use wins. -
Grafana
@grafana
📣 The #observabilitycon 2025 talks are now available on demand!
Our sessions include different strategies and solutions you can use to help scale your observability, within these key themes:
🔸 *Actually useful* AI
🔸 SaaS economics reimagined
🔸 Complexity, simplified
Catch the announcements, demos, deep dives, and customer stories: grafana.com/events/observabilitycon/2025/?src=x&mdm=socia…This media couldn't be displayed. See it on the original post. -
Grafana reposted
𝙳𝚘𝚝𝚊𝚗 𝙷𝚘𝚛𝚘𝚟𝚒𝚝𝚜 ✈️ KubeCon 🇺🇸
@horovits
#opentelemetry 's got a new #ebpf based agent that extracts basic R.E.D. metrics out of your application's services without any code change!
Check out the latest @OpenObserv episode for a deep dive with the creator @MaciasUpc:
👉 horovits.medium.com/unveiling-opentelemetry-ebpf-instrume…
@grafana @opentelemetry -
Grafana reposted
OpenObservability
@OpenObserv
📢 October episode is out! 📢
Unveiling #opentelemetry #ebpf Instrumentation
With @horovits hosting the project's co-creator and maintainer @MaciasUpc; Principal SW Engineer @grafana
🎧 podcasters.spotify.com/pod/show/openobservability/episode…
📺 www.youtube.com/watch?v=u-J3O5nizuE&list=PLd57eY2edRXz4dj…
Recap post:
👉 medium.com/p/377cb0432bf1 -
Grafana
@grafana
The Adaptive Telemetry suite helps teams maximize data while cutting costs.
We recently added more to this suite with Adaptive Traces (GA) + Profiles (Private Preview).
Learn how 👇
grafana.com/blog/2025/10/14/managing-observability-costs-… -
Grafana
@grafana
🌍 After wrapping up our most successful #observabilitycon yet, we're thrilled to extend the excitement to 1-day events around the world!
Save the date or register for an ObservabilityCON on the Road event near you: grafana.com/events/observabilitycon-on-the-road/?src=x&md…
You'll learn about our new innovations around *actually useful* AI, how we're reimagining the economics of SaaS, and new ways to simplify complexity in #observability.This media couldn't be displayed. See it on the original post.
Grafana
@grafana
Here’s where we’re heading:
🇧🇷 São Paulo (Nov 4) - Waitlist
🇺🇸 Washington, DC (Nov 5) - Registration open
🇪🇸 Madrid (Nov 18) - Registration open
🇺🇸 Dallas (Nov 18) - Registration open
🇩🇪 Frankfurt (Feb 5) - Save the date
🇨🇦 Toronto (Mar 5) - Save the date
🇦🇺 Sydney (Mar 10) - Save the date
🇯🇵 Tokyo (Mar 17) - Save the date
🇳🇱 Amsterdam (Mar 31) - Save the date
🇺🇸 Bay Area (TBD) -
Grafana
@grafana
Don’t miss #observabilitycon on the Road in the following cities:
🇧🇷 São Paulo (Nov 4) - Waitlist
🇺🇸 Washington, DC (Nov 5) - Registration open
🇪🇸 Madrid (Nov 18) - Registration open
🇺🇸 Dallas (Nov 18) - Registration open
🇩🇪 Frankfurt (Feb 5) - Save the date
🇨🇦 Toronto (Mar 5) - Save the date
🇦🇺 Sydney (Mar 10) - Save the date
🇯🇵 Tokyo (Mar 17) - Save the date
🇳🇱 Amsterdam (Mar 31) - Save the date
🇺🇸 Bay Area (TBD)
Grafana
@grafana
🌍 After wrapping up our most successful #observabilitycon yet, we're thrilled to extend the excitement to 1-day events around the world!
Save the date or register for an ObservabilityCON on the Road event near you: grafana.com/events/observabilitycon-on-the-road/?src=x&md…
You'll learn about our new innovations around *actually useful* AI, how we're reimagining the economics of SaaS, and new ways to simplify complexity in #observability.This media couldn't be displayed. See it on the original post. -
Grafana
@grafana
New release: Grafana Tempo 2.9 is here 🚀
We’re introducing:
🧠 MCP server support
⚡ TraceQL metrics sampling
🛠️ Multi-tenant improvements
Check out the blog + demo: grafana.com/blog/2025/10/22/grafana-tempo-2-9-release-mcp… -
Grafana reposted
PrometheusMonitoring
@PrometheusIO
Huge thanks to @grafana for being a fantastic sponsor of #promcon! 🙌
Their booth is packed with amazing swag, cool demos, and a 3D printer in action. If you're at the conference, make sure to stop by and grab some goodies before they're all gone! -
Grafana
@grafana
Telemetry collection can get messy — multiple collectors, complex configs, endless juggling. 😵💫
That’s where Grafana Alloy comes in 💪
In this episode, Lisa Jung breaks down what Alloy is and how you can use it to collect logs, metrics, traces, and profiles, all in one place. -
Grafana
@grafana
Seeing it all come together in #grafana… 🤩
Fabian Hedin
@FabianHedin
Claude Sonnet 4.5 in Lovable together with other codegen improvements in the last 2 weeks have resulted in
- 30% less build errors
- 20% faster responses -
Grafana reposted
Syed Usman Ahmad
@usahmad87
🔔𝐓𝐨𝐩𝐢𝐜: PromCON 2025 Highlights - What's New in Prometheus Community?
𝐃𝐚𝐭𝐞: Fri. 24th October
𝐓𝐢𝐦𝐞: 1:00 PM UTC (3:00 PM CEST)
Join us to learn whats new in #grafana & #prometheus & all the exciting news from #promcon & in the #community
www.youtube.com/watch?v=Gp16KpN3CWk -
Grafana
@grafana
"This meeting could've been an email." 🙃
This #grafana dashboard helps you monitor the real-time costs of your meetings — in actual dollars and cents. It also helps you track your team's favorite corporate buzzwords!
grafana.com/blog/2025/10/17/show-me-the-meeting-money-how… -
Grafana
@grafana
📊 Oct. 22 webinar: Getting started with logging using Grafana Loki
See how Loki 3.0 makes logging faster, simpler, and more cost-effective.
Sign up: grafana.com/go/webinar/getting-started-with-logging-and-g… -
Grafana reposted
The New Stack
@thenewstack
Learn how OTel project OBI is redefining how observability fits into developer workflows and platform engineering strategies.
Thanks to @CloudNativeFdn and @grafana thenewstack.io/how-ebpf-is-powering-the-next-generation-o… -
Grafana
@grafana
Proud to see Grafana, Loki, and Tempo highlighted in the 2025 @Pragmatic_Eng survey — alongside projects we contribute to like OpenTelemetry and Prometheus.
Read @GergelyOrosz’s deep dive 👇 newsletter.pragmaticengineer.com/p/the-pragmatic-engineer… -
Grafana reposted
cemaxecuter
@cemaxecuter
👀 If someone already built this for @grafana , I’m gonna lose it 😅 — could’ve saved so much time. Positions showing w/ clickable map dots now take you straight to the exact message or log that generated the location. Still need to finish up the VDL2 side of things!
cemaxecuter
@cemaxecuter
I’d probably have my new portable @UUGear scanning up to 6 GHz by now (SDR swap), but I got completely sidetracked trying to push all this HFDL and VDL2 data into Grafana. Still can’t get the map fields to parse right… but man, this stuff’s addictive. Thanks @thebaldgeek 👀📡
-
Grafana reposted
Simon Prickett 🇪🇺| simonprickett.dev
@simon_prickett
I've been playing around with the #chicago transit APIs and @grafana - here's work in progress on an L train departure board for a given station/platform.
-
Grafana
@grafana
From Grafana Beyla to OpenTelemetry OBI — the future of observability is open, automatic, and built in.
Grafana Labs’ Nikola Grcevski explains how eBPF is helping developers simplify instrumentation and scale observability across every stack.
🔗 Read more via @thenewstack: -
Grafana reposted
-
Grafana reposted
PrometheusMonitoring
@PrometheusIO
Big shoutout to @grafana for sponsoring #promcon 2025! 🎉 Your support means the world to the Prometheus community. Thanks for helping us make this event possible! 💙
Be sure to checkout their booth next week! -
Grafana
@grafana
📊 As your observability strategy scales, keeping costs in check can get harder.
Here are some new Grafana Cloud features to help you optimize and gain deeper insights into your overall observability spend 👇
grafana.com/blog/2025/10/14/managing-observability-costs-… -
Grafana
@grafana
We’re proud to be a Diamond Sponsor of PromCon EU 2025! 💎
Join us Oct 21–22 in Munich for deep dives, live demos, and conversations on the future of open observability.
See you there 👋
Agenda: promcon.io/2025-munich/schedule/ -
Grafana
@grafana
When your tech runs restaurants, you can’t afford downtime.
SpotOn uses Grafana Assistant to help engineers get up to speed fast, troubleshoot issues quickly, and keep kitchens running smoothly.
🍽️ Read their story: grafana.com/blog/2025/10/15/baking-in-site-reliability-wi… -
Grafana
@grafana
#observabilitycon 2025 London, you were incredible.
Thanks to everyone who joined us last week — our exceptional community and customers, speakers, and Grafanistas. See you at the next one.
Check out photos from the event: www.flickr.com/photos/200539808@N03/albums/72177720329587583 -
Grafana
@grafana
New to Grafana Alloy? 🔧 Learn to collect, process & export telemetry data in our Alloy for Beginners series! 💡
🎥 Start with Episode 1 and kick off your observability journey → www.youtube.com/watch?v=KWWI0WONPVE -
Grafana
@grafana
We’ve joined Google Cloud’s Gemini CLI ecosystem!
The new Grafana extension brings observability to your terminal — monitor, explore, and stay in flow.
Learn more: blog.google/technology/developers/gemini-cli-extensions/ -
Grafana
@grafana
#ai-powered observability updates from #observabilitycon:
🔹 GA of Grafana Assistant: an agent that helps you investigate & troubleshoot faster using natural language
🔹Assistant Investigations (public preview): an autonomous agent for incident response
🔗 grafana.com/blog/2025/10/08/grafana-assistant-ga-assistan… -
Grafana
@grafana
📊 Ready to build better Grafana dashboards?
Join us Oct 16 to learn the essentials of Grafana dashboard design — from context & style to storytelling & improvements.
grafana.com/go/webinar/getting-started-with-grafana-dashb… -
Grafana
@grafana
👏 Exciting news — our Adaptive Telemetry suite is evolving, with Adaptive Traces now generally available and Adaptive Profiles in private preview!
With this end-to-end Adaptive Telemetry suite, you can extend the benefits of the adaptive model across all core pillars of your observability strategy, ensuring every piece of telemetry you store is truly worth the investment: grafana.com/blog/2025/10/08/adaptive-telemetry-suite-in-g… -
Grafana reposted
BC Gain
@bcamerongain
@opentelemetry support for @rustlang remains in beta stage for traces, metrics and logs, as @grafana ‘s Tom Donohue, showed at the OpenTelemetry Workshop at ObservabilityCon in London this week.
-
Grafana
@grafana
“We’re kind of allergic to hype.” @nopzor
The #observabilitycon keynote is live on demand.
See the announcements on:
🤖 Actually useful AI
☁️ SaaS economics reimagined
🔍 Complexity simplified
www.youtube.com/live/MJXpfFgFCjg -
Grafana reposted
Nearform
@nearform
We're here at #observabilitycon London!
Suffering from logxiety?
Our team of specialists are here at the Nearform booth to help diagnose and treat your toughest monitoring challenges! 🚑
Drop by for a chat! @grafana -
Grafana reposted
BC Gain
@bcamerongain
Headed by @grafana ‘s Tom Donohue, the OpenTelemetry Workshop at ObservabilityCon was a great hands-on way to build muscle memory for integrating apps with OpenTelemetry and visualizing data in Grafana Cloud. Good stuff. Learned a lot.
-
Grafana reposted
BC Gain
@bcamerongain
.@grafana Assistant (an in-console AI co-pilot for observability) is now generally available. At #observabilitycon today, Dmitry Filimonov demoed Assistant Investigations that lets the agent detect issues can the background and can help analyze the sources of errors.
-
Grafana
@grafana
📣 At #observabilitycon 2025, we unveiled updates that make observability smarter, scalable, and easier for every team — including Grafana Assistant GA, new additions to the Adaptive Telemetry, & more.
See *all* of the announcements 👇
grafana.com/blog/2025/10/08/observabilitycon-2025-announc… -
Grafana
@grafana
Two letters. More innovations.
It wouldn’t be an #observabilitycon in 2025 if we didn’t talk about #ai that’s actually useful.
We’ve added several enhancements to Grafana Assistant. A few highlights from @matryer include: rules, the ability to connect to MCP servers, infrastructure memory, and the Knowledge Graph.This media couldn't be displayed. See it on the original post. -
Grafana
@grafana
🤖 Our teams have seen a lot of excitement around Grafana Assistant and now we’re taking it a step further.
Meet Assistant Investigations in public preview!
It uses specialized agents to analyze your observability stack, find anomalous behavior, and build a broader picture of your system.
#observabilitycon -
Grafana
@grafana
The announcements at #observabilitycon keep rolling.
Next up, we’re introducing the Instrumentation Hub!
We leveraged infrastructure and service discovery with Alloy, and Beyla and Fleet Management to build the Instrumentation Hub.
Use the Instrumentation Hub to see which service namespaces and #k8s clusters aren’t instrumented yet, and then instrument them with the push of a button.
It’s centrally managed, so no more hunting around in config files. -
Grafana
@grafana
We’ve created a platform to integrate our open cloud observability solutions.
Now you can easily get an overview of:
- All of the components of your system and their relationships to each other with the Knowledge Graph (sounds like Asserts 😉)
- New component behavior in your system with Insights; and
- The relationships between new component behavior with the Root Cause Analysis Workbench (also known as the RCA Workbench)
#observabilitycon -
Grafana
@grafana
We think a lot about how to make complex things simpler.
We started off with Grafana, then built a forest of open source projects — Loki, Tempo, Mimir, Pyroscope, Faro, and more.
… We’ve contributed to #opentelemetry and #prometheus.
… We’ve built a hundred integrations to cover a hundred different infrastructure systems.
… We’ve introduced observability for K8s, for your web front end, for your service landscape and for your CSPs.
… And as we identify new system components in need of deep insight, we’ll grow new solutions.
#observabilitycon -
Grafana
@grafana
At #observabilitycon, we’re also excited to announce the general availability of Grafana Federal Cloud — FedRAMP High and DoD IL5 compliance!
For US federal agencies, SLED organizations, systems integrators, and software vendors, Grafana Federal Cloud keeps your software running smoothly with fully managed observability built for teams in regulated environments. -
Grafana
@grafana
How BYOC works:
🔸 We run an region of Grafana Cloud in your AWS or GCP account
🔸You get all the capabilities of Grafana Cloud, including Adaptive Telemetry, Grafana Assistant, etc.
🔸We operate, upgrade, patch, respond to pages, and defend the SLO for your cluster
#observabilitycon -
Grafana
@grafana
"Some users find it more cost effective, at the very largest of scales, to leverage our open source. We're not happy that these users don't get to experience all the innovations we’ve shipped in Grafana Cloud.
To solve for this we’re introducing ‘Bring Your Own Cloud (BYOC).’” - @tom_wilkie
#observabilitycon -
Grafana
@grafana
We’ve now expanded the Adaptive Telemetry suite by adding Adaptive Traces (GA) and Profiles (Private Preview)!
🔗: grafana.com/blog/2025/10/08/adaptive-telemetry-suite-in-g…
Adaptive Telemetry analyzes telemetry use and suggests ways to cut noise — aggregating, sampling, dropping, or reducing low-value data to lower costs. Made possible via the use of #ai/ML.
#observabilitycon -
Grafana
@grafana
Observability costs are rising – but telemetry value hasn’t been increasing at the same rate.
To address this, we created Adaptive Telemetry, and it’s *just* one of the ways we’re trying to change the usual SaaS economics.
#observabilitycon -
Grafana
@grafana
.@nopzor shares why *open* is the Grafana Labs strategy.
- Open source: builds the best software, LLMs know Grafana
- Open ecosystems: any data from anywhere
- Open standards: OpenTelemetry and Prometheus means no lock-in
- Open & transparent way of doing business, a reflection of our internal culture
#observabilityconThis media couldn't be displayed. See it on the original post. -
Grafana
@grafana
At #observabilitycon, we’re proud to share our recent milestones & recognition:
◾️ 25M + Grafana users
◾️$400M+ ARR
◾️7000+ Grafana Labs customers including Anthropic, NVIDIA, Salesforce, and Microsoft
◾️#13 in the 2025 Forbes Cloud 100
◾️Listed on the InfraRed 100 -
Grafana
@grafana
The ObservabilityCON 2025 keynote has started! We're streaming from the city of Buckingham Palace, Big Ben, and more 🇬🇧
youtube.com/live/MJXpfFgFCjg
We'll live tweet major moments during the keynote. Follow along via #observabilitycon to see what’s coming up in the next chapter of #observability. -
Grafana
@grafana
Today's the day!
The #observabilitycon 2025 keynote starts at 10:00 am BST / 9:00 am UTC.
Join the livestream and be among the first to learn about new AI features and Grafana Cloud solutions: youtube.com/live/MJXpfFgFCjg -
Grafana
@grafana
#observabilitycon 2025 day 0 has kicked off with hands-on labs.
Thanks to @awscloud for being a Grafana Labs partner and sponsoring our flagship #observability conference!
If you can't make it in person, sign up to join the keynote livestream tomorrow: grafana.com/events/observabilitycon/ -
Grafana
@grafana
What's coming up in the next chapter of #observability?
We recently surveyed 150 IT leaders to get their insights on unified platforms, tool consolidation, SLOs, AI, and tying observability to business value.
Read the analysis: grafana.com/blog/2025/10/06/the-observability-maturity-cu… -
Grafana
@grafana
By helping you collect frontend web vitals, capture custom metrics, and simulate user actions, k6 browser offers a deeper understanding of performance and availability from your end users’ point of view. grafana.com/blog/2025/10/02/a-closer-look-at-grafana-k6-b…
-
Grafana
@grafana
☁️ The #observabilitycon 2025 livestream is made possible by our sponsor, @googlecloud! Sign up to join or to catch the recording: grafana.com/events/observabilitycon/?mdm=social&src=tw
And if you're attending in person this week, be sure to check out their headshots booth for some new photos! -
Grafana
@grafana
We have two community calls coming this week on Oct 9!
Grafana Pyroscope: #ebpf observability history and #grafana Alloy with native code: www.youtube.com/watch?v=yTQYzrKLFHo
Grafana Tempo: Struggling with span metrics? #hyperloglog can help: www.youtube.com/watch?v=e248vEvAhfQ -
Grafana
@grafana
Companies like Shopify and Uber are using continuous profiling to get better ROI from observability.
See how you can pair it with #grafana Drilldown to save even more time and money 💰
grafana.com/blog/2025/09/30/how-to-boost-observability-ro… -
Grafana
@grafana
Unsure whether to silence a notification or simply mute it temporarily?
Use this guide for a high-level understanding of both options in #grafana Alerting. grafana.com/blog/2025/09/24/mute-timing-vs-silences-in-gr… -
Grafana
@grafana
⚡Incidents draining your team?
In our Oct. 8 webinar, see how Grafana Cloud helps you:
📊 Simplify SLOs
🛠️ Streamline response
⚡ Automate incident management
Sign up: grafana.com/go/webinar/getting-started-with-grafana-incid… -
Grafana
@grafana
#observabilitycon is happening in just a few days!
We couldn't bring you the next chapter of observability without our sponsors: @alibaba_cloud, @embracemobile, @causelyai, @nearform, and @Luciq_AI.
Stop by their booths to learn how their solutions can support your observability journey. -
Grafana
@grafana
Learn how to use Grafana Cloud and the Infinity data source to visualize live #json data from #cheerlights, the popular IoT project fueling a global network of synchronized light installations.
grafana.com/blog/2025/09/26/lighting-up-your-dashboards-h…
👏 Kudos to @simon_prickett for the writeup! -
Grafana reposted
SecondaryLink
@SecondaryLink
@OTPPinfo leads @grafana Labs’ $150 million tender offer.
“This investment reflects the strong confidence our investors have in our vision for open, AI-powered observability,” said Raj Dutt, CEO and Co-Founder of Grafana Labs.
Read on SecLink: secondarylink.com/seclink/news/68dbcfb06811a2caba3d646e/o… -
Grafana reposted
Ivana Huckova
@ivanahuckova
We got the most danceable #taylorswift album! 💃💚🧡
Dive into The Life of a Showgirl with our public #grafana dashboard 👉 swifties.grafana.net/public-dashboards/6eac2dfe57674a7280… 🪩 and learn how we’ve built is using Grafana AI Assistant grafana.com/blog/2025/10/03/taylor-swift-grafanas-version…. Also, can you spot the hidden easter eggs? 🐣🎶 -
Grafana
@grafana
Can't make it to #observabilitycon 2025? Join us from anywhere in the world 🌍
Sign up to join us for the opening keynote, livestreaming straight from London, or to receive the recording: grafana.com/events/observabilitycon/?mdm=social&src=tw
We'll unveil the future of AI-powered #observability and new features in Grafana Cloud. -
Grafana
@grafana
Call it “The Dashboard of a Showgirl” 🎶
4 Swifties with varying levels of engineering expertise used Grafana Assistant to build a #taylorswift dashboard that will never go out of style.
✨ Enchanted ✨ to share the dashboard and the story behind it: grafana.com/blog/2025/10/03/taylor-swift-grafanas-version…
Grafana
@grafana
The dashboard beyond our wildest dreams: swifties.grafana.net/public-dashboards/a2000410bf714aac81…
-
Grafana reposted
Forbes
@Forbes
With a client list that includes Nvidia, Anthropic and Uber, the $6 billion-valued Grafana Labs is flexing with $400 million in annualized revenue — and new investment from a tender offer of up to $150 million. www.forbes.com/sites/richardnieva/2025/09/30/grafana-labs…
-
Grafana
@grafana
Dashboards like this are *chef's kiss*
TheOperator 🇨🇭
@HB9VQQ
October gets off to a bumpy start, HF propagation severely impaired - Strong geomagnetic Storm Kp 7 grafana.gafner.net/d/kAZyp6bMz/solar-indices-and-ham-radi…
-
Grafana reposted
Nearform
@nearform
#observabilitycon '25 is heading to London 7-9 Oct, and we’re proud to sponsor the next chapter of #observability!
See how @Grafana’s new #ai features + open observability cloud solutions drive bigger business impact and stop by our booth for your free Observability Healthcheck! -
Grafana
@grafana
There really can be a dashboard for anything...
Ivana Huckova
@ivanahuckova
When my favorite things meet: #taylorswift , @grafana and AI Assistant 🫶
ALL OF US CAN’T WAIT FOR FRIDAY when The Life of the Showgirl drops. While counting down, we - the Swiftie Grafanistas (with a help from Grafana Assistant) - built this dashboard. ✨
Check it out 👇🤩
Grafana
@grafana
Taylor's in her Showgirl era — and this week, so is Grafana ✨
Using #grafana Assistant, we built a #taylorswift dashboard — and it tells Taylor's musical story all too well.
Full dashboard reveal coming this Friday! -
Grafana reposted
COATUE
@coatuemgmt
🚀 Proud to back @grafana - a leader in OSS + AI-powered observability - now at $400M ARR, 7K+ customers, and new investors to scale.
More via @richardjnieva in @Forbes: www.forbes.com/sites/richardnieva/2025/09/30/grafana-labs… -
Grafana
@grafana
Grafana Cloud is a fully managed #observability platform built on #opensource and open standards.
When every second counts, it unifies 150+ data sources and uses #ai-powered guidance to spotlight what matters — helping teams find what matters fast.
We offer forever-free Grafana Cloud plan that's *actually* useful:
10k metrics
50GB logs
50GB traces
50GB profiles
500VUh k6 testing
50k frontend sessions
2,232 app o11y host hours
14-day retention
3 active users
2,232 k8s monitoring host hours
37,944 k8s monitoring container hours
Learn more: grafana.com/products/cloud/?src=x&mdm-socialThis media couldn't be displayed. See it on the original post. -
Grafana
@grafana
Taylor's in her Showgirl era — and this week, so is Grafana ✨
Using #grafana Assistant, we built a #taylorswift dashboard — and it tells Taylor's musical story all too well.
Full dashboard reveal coming this Friday! -
Grafana
@grafana
The 4th annual Observability Survey is live!
Share your (anonymous) input on tooling, AI, cost & complexity in <10 mins for a chance to win #grafana swag 🎁
Take the survey: grafana.com/observability-survey/?camp=survey-2025&mdm=so… -
Grafana
@grafana
In case you missed it, Grafana Labs has reached new heights, and we’re still climbing:
🚀 $400M ARR
🚀 7,000+ customers worldwide
🚀 Completion of a secondary transaction
🚀 A top contributor to #opentelemetry & #prometheus
Read the full announcement: grafana.com/about/press/2025/09/30/grafana-labs-surpasses… -
Grafana reposted
Forbes
@Forbes
Grafana Labs Is Cleaning Up On The Vibe Coding Boom
go.forbes.com/qb7PmU -
Grafana
@grafana
Lift off! We’re proud to announce that Grafana Labs has soared past $400M ARR & 7,000 customers.
We’ve also completed a secondary transaction led by @otppinfo with @SapphireVC, Tiger Global & existing investors.
Read more from @richardjnieva at @forbes.
www.forbes.com/sites/richardnieva/2025/09/30/grafana-labs… -
Grafana
@grafana
#observability is evolving as organizations shift to consolidated platforms, adopt OpenTelemetry, and look to AI to help troubleshoot faster: grafana.com/blog/2025/09/26/grafana-labs-co-founder-woods…
Those were just some of the takeaways from Grafana Labs Co-founder Anthony Woods, who recently appeared on the "Tech Keys by Mercari India" podcast. -
Grafana
@grafana
We’re proud to be a bronze sponsor at @AllThingsOpen 2025 in Raleigh, NC (Oct 12–14)! 🎉
Catch us at booth #36 + hear our Grafanistas share insights on open source, Kubernetes & observability. Full schedule: 2025.allthingsopen.org/schedule -
Grafana reposted
Christian Lempa
@ChristianLempa
Friendly Reminder: Grafana Alloy isn’t just Promtail replacement—it's a central telemetry hub for logs and metrics. It combines Promtail, Loki plugins, and Cadvisor into one workflow, simplifying your HomeLab!
-
Grafana
@grafana
With Grafana Cloud, Prudential SG’s SRE team turned monitoring into a scalable, secure, self-service platform ☁️
Now teams see what matters across regions — without the overhead of managing a platform.
🎥 See how they scaled observability: www.youtube.com/watch?v=-cBwBzNNv5E&t=1047s -
Grafana
@grafana
⚡Incidents draining your team?
In our Oct. 8 webinar, see how Grafana Cloud helps you:
📊 Simplify SLOs
🛠️ Streamline response
⚡ Automate incident management
Sign up: grafana.com/go/webinar/getting-started-with-grafana-incid… -
Grafana
@grafana
🚀 Grafana 12.2 is live!
This release includes a more intuitive, LLM-powered experience for SQL expressions (public preview), data visualization updates, and so much more.
Details 👇
grafana.com/blog/2025/09/25/grafana-12-2-release-all-the-… -
Grafana
@grafana
🗣️Louder for those in the back! Here's what the Grafana forever-free tier includes:
10k metrics
50GB logs
50GB traces
50GB profiles
500VUh k6 testing
50k frontend sessions
2,232 app o11y host hours
14-day retention
3 active users
2,232 k8s monitoring host hours
37,944 k8s monitoring container hours -
Grafana
@grafana
🛜 Learn how to perform a #dns check in Grafana Cloud Synthetic Monitoring to continuously validate DNS resolution performance and ensure an optimal end-user experience. grafana.com/blog/2025/09/23/how-to-perform-real-time-dns-…
-
Grafana reposted
Syed Usman Ahmad
@usahmad87
📌 Join me and our group of Experts at the Grafana Campfire 🔥Community Call and Learn all about UI Extensions: Enabling Cross-App Workflows 🙂
www.meetup.com/grafana-friends-virtual-meetup-group/event… #meetup via @Meetup -
Grafana
@grafana
👋 Goodbye noise, hello #observability ease.
The Grafana Drilldown apps are designed for effortless data exploration through intuitive, queryless interactions. (What PromQL?)
Read the full 5-star review on @Gartner_Peer: gtnr.it/4lH3nd4 -
Grafana
@grafana
🔑 In Grafana Cloud, single-stack offers simplicity while multi-stack provides isolation. Most orgs benefit from single-stack, but each approach has pros & cons. Here’s how to choose👇
grafana.com/blog/2025/09/18/single-tenant-vs-multi-tenant… -
Grafana
@grafana
🚀 By processing queries in a streaming manner — without loading all samples at once — Mimir Query Engine boosts performance and memory efficiency in Grafana Mimir. A foundational feature for the upcoming 3.0 release.
Here’s how 👇
grafana.com/blog/2025/09/17/faster-more-memory-efficient-… -
Grafana
@grafana
Grafana k6 Operator has reached 1.0.
What began as an experiment in 2020 is now a community-driven OSS project that makes it easier to run and scale distributed performance tests in Kubernetes.
Read what's new: grafana.com/blog/2025/09/16/distributed-performance-testi… -
Grafana
@grafana
🚦Struggling to scale Prometheus?
In our Oct. 1 webinar, learn how Grafana + Mimir make it easier to:
📈 Scale reliably
🧩Simplify workflows
✂️ Cut complexity
Sign up: grafana.com/go/webinar/intro-to-metrics-with-grafana-prom… -
Grafana
@grafana
Grafana Cloud IRM now supports advanced webhooks for incident events.
Template URLs, headers & data, chain responses, and sync more easily with systems like ServiceNow.
Details 👇
grafana.com/blog/2025/09/15/how-to-connect-servicenow-to-… -
Grafana
@grafana
Getting started with Grafana Cloud Frontend Observability? Here’s a breakdown of the key metrics and visualizations you’ll find on our pre-built dashboards for real user monitoring (RUM). grafana.com/blog/2025/09/02/actionable-insights-into-the-…
-
Grafana
@grafana
You can now stream #aws metrics into in Grafana Cloud in near real-time.
This new functionality is more cost-effective and easier to operate, and it delivers more accurate data. grafana.com/blog/2025/09/03/aws-metric-ingestion-for-less… -
Grafana
@grafana
We were proud to sponsor HackUPC 2025 — one of Europe’s biggest student hackathons. In just 36 hours, teams built Grafana-powered dashboards to track climate change and global music trends. Check out the highlights 👇
grafana.com/blog/2025/09/12/data-storytelling-at-hackupc-… -
Grafana
@grafana
Too many monitoring tools? 🛠️ See everything in one place with #grafana.
Join us for a webinar on Sep 17: Learn to connect metrics, logs & traces, build dashboards, and troubleshoot faster with the LGTM stack + Grafana 12.
📅 Save your spot: grafana.com/go/webinar/getting-started-with-grafana-lgtm-… -
Grafana
@grafana
With Grafana Cloud Synthetic Monitoring, TCP checks can be your first line of defense against service failures and network connectivity issues.
Here’s how to get started. grafana.com/blog/2025/09/09/measuring-service-response-ti… -
Grafana reposted
Ivana Huckova
@ivanahuckova
We’ve recently launched @grafana AI Assistant into public preview 🎉🤖, but Grafanistas have been using it for a while already.
I loved 🥰 talking to my colleagues about how it helps them save ⏱️ and find answers faster.
Grab some tips & usecases here 👉 grafana.com/blog/2025/09/11/debug-query-and-build-faster-… -
Grafana
@grafana
Assistant, our integrated AI-powered chat agent, is quickly becoming a go-to tool inside Grafana Labs. See how our developers use it to debug, query, and build faster. grafana.com/blog/2025/09/11/debug-query-and-build-faster-…
-
Grafana reposted
Erick Wendel
@erickwendel_
Nunca foi tão fácil monitorar suas aplicações e nesse vídeo eu vou te provar!
Contratar serviços de monitoramento e alertas é uma das coisas mais caras do momento
Muita empresa só contrata depois de alcançar um certo nível de maturidade, quando está faturando muito bem e captando muita grana
O que você talvez não saiba é que você pode ter todo o benefício de entender como suas aplicações back, frontend e mobile se comportam em produção sem ter que gastar o salário de 5 devs seniores pra isso 😂
Nesse vídeo eu trouxe um projeto pronto para o uso, 100% gratuito e até fiz um experimento em um ambiente de alta demanda e disponibilidade
Para provar que você pode não só monitorar qualquer aplicação de forma gratuita como reduzir o custo geral da sua empresa em monitoramento
E a melhor parte, adicionei @Grafana, #prometheus e @opentelemetry no projeto do Emerson Costa, que teve seu projeto entre os top 5 dos vencedores da 2ª edição da @rinhadebackend, monitorando requests e mostrando na prática o quão simples a parada é!
Tá esperando o que? Vem ver ewbr.cc/otel-javascript-video -
Grafana
@grafana
By putting all your users in a single Grafana Cloud stack, you can manage access via teams, roles, and folders: grafana.com/blog/2025/09/08/managing-access-in-grafana-a-…
Follow the hypothetical journey of an #observability engineer to learn how it can help you and your organization stay clear, collaborative, and secure. -
Grafana
@grafana
🚢 Ahoy! Meet Project Bob, the autonomous 14-foot boat, made by @andrewmccalip, attempting to circumnavigate the globe with the help of #opensource software, including #grafana.
grafana.com/blog/2025/08/29/project-bob-the-open-source-b…
#grafanaeverywhere -
Grafana
@grafana
Can AI help tame #observability complexity?
1,200+ observability experts shared how they juggle multiple tools, signals, and dashboards. AI can help highlight patterns and reduce setup overhead, as long as humans are in the loop 🤓This media couldn't be displayed. See it on the original post. -
Grafana
@grafana
We're updating the #grafana Alerting UI in response to user feedback. With the new filtering experience, you quickly and easily find the alert rules you need. grafana.com/blog/2025/09/10/a-smarter-filter-for-grafana-…
-
Grafana reposted
Joe Smith
@Yasumoto
Easily one of the coolest @grafana dashboards we maintain
Neuralink
@neuralink
There are now 12 people around the world with Neuralink implants. Collectively, they’ve had their devices for 2,000 days and accumulated over 15,000 hours of use.
We look forward to continuing to explore the possibilities of neural interfaces with all of our participants! -
Grafana
@grafana
Every contribution helps 🙏
John-George Sample
@JG_Sample
My day-to-day work is closed source despite working at an OSS company. 5 months later, I finally got a commit into _the_ repo 🎉 (even if it’s just a doc change)
github.com/grafana/grafana/pull/110824 -
Grafana
@grafana
A global leader in CX testing and monitoring, @GetCyara saved 30% in monitoring costs and scaled to handle 11 million logs in 15 minutes with Grafana Cloud.
Find out how 👇
youtu.be/Ms_R35KpRKk -
Grafana
@grafana
The Infinity data source has enabled a wide range of use cases within our community — from visualizing cloud computing costs to popular Pokémon games: grafana.com/blog/2025/09/04/whats-new-in-the-infinity-dat…
Recently, we’ve made several updates to the data source to improve its functionality, performance, and ease of use. -
Grafana
@grafana
🧠 #grafana Cloud brings beauty and brains to your #observability.
Read the full 5-star @Gartner_Peer review: gtnr.it/4jmq6d6 -
Grafana
@grafana
📺 Webinar on Sep 11: Intro to Kubernetes monitoring in Grafana Cloud ☁️
Learn how to collect the right telemetry, simplify metrics + logs w/ Grafana Alloy & use #grafana dashboards + alerts to troubleshoot #k8s faster.
grafana.com/go/webinar/kubernetes-monitoring-with-grafana… -
Grafana
@grafana
In 3 minutes, learn how to capture HTTP requests directly from your browser and export them as a k6 script.
Kudos to #grafana Champion Razvan Vancea on this helpful step-by-step tutorial!
www.youtube.com/watch?v=VBpqEUnRqwM -
Grafana reposted
Lightspeed
@lightspeedvp
This year’s @Forbes Cloud 100 shows just how far AI has spread, shaping everything from health and security to customer service, and beyond.
Congratulations to these Lightspeed-backed companies on being recognized within the industry as top-tier private ventures leading the cloud and AI technology revolution: @1Password, @AbridgeHQ, @AnthropicAI, @AWNetworks, @AxoniusInc, @CartaInc, @CatoNetworks, @Chainguard_dev, @ClickHouseDB, @ClickUp, @Cyera_io, @Databricks, @EvenUpLaw, @Glean, @Grafana, @Navan, @Netskope, Personio, @Rippling, and @Stripe. -
Grafana
@grafana
🚨Heads up, Vegas! Grafana Labs is sponsoring @Trace3Evolve (Sept 30 - Oct 3).
Stop by our booth to see live demos, chat with engineers, and explore how the Grafana Stack makes observability simple, scalable, and cost-effective.
See you there! 👇
www.evolvetechconference.com -
Grafana
@grafana
Grafana Labs is a 2025 Forbes #cloud100 honoree!
We jumped 10 spots to come in at #13 among the world’s top private cloud & AI companies.
Thanks to our community for your support, and to @cloud100, @BessemerVP, & @Forbes for this 5x consecutive recognition: www.forbes.com/lists/cloud100/ -
Grafana
@grafana
💰 30% discount tickets are close to selling out! Purchase as a group of 2+ for even more savings. Don't miss #observabilitycon in London.
This is *the* event to learn how to leverage Grafana Cloud as a complete, AI-powered observability solution: grafana.com/events/observabilitycon/?src=x,bs&mdm=social&… -
Grafana
@grafana
✏️ School’s back in session, and so is your chance to grow. Introducing GROT Academy, your Grafana Cloud learning hub.
This new self-paced resource features hands-on learning built by Grafana experts with a badge to flex your skills.
This quarter, we've launched a new Technical Practitioners 101 course. Sign up: learn.grafana.com -
Grafana
@grafana
How can #prometheus handle #opentelemetry resource attributes better?
UX designer Victoria Nduka talked to leaders for both projects and surveyed more than 100 people to find out: grafana.com/blog/2025/08/28/how-should-prometheus-handle-…
Nduku undertook the project as part of the @linuxfoundation mentorship program, with three Grafanistas supporting her in her efforts. -
Grafana
@grafana
👀 Monitor your application's HTTP requests and error rates to detect bottlenecks in realtime with HTTP Performance Insights in Grafana Cloud Frontend Observability.
Here's how to get started.
grafana.com/blog/2025/08/27/optimize-application-performa… -
Grafana
@grafana
From the public preview of Grafana Assistant to a new secrets manager in Synthetic Monitoring, we have a lot of #grafana Cloud updates to share this month. grafana.com/blog/2025/08/20/grafana-cloud-updates-onboard…
-
Grafana
@grafana
🔁 The Grafana Labs Voice of Customer (VoC) program is a centralized effort to collect, triage, and share product feedback from our user base.
Learn how we're expanding its reach to make it even more impactful. grafana.com/blog/2025/08/26/inside-grafana-labs-voice-of-… -
Grafana reposted
Mat Ryer
@matryer
LLMs are great for this kind of use case. Tbh I’ve been quite surprised by some of the things Grafana Assistant has been able to do. It’s in public preview and we’re adding more features every week.
grafana.com/blog/2025/08/14/ai-for-grafana-onboarding-get… -
Grafana reposted
Albert Lam
@albert_
Great interview with @grafana CTO @tom_wilkie:
"A good BYOC solution will support zero-access from the vendor accessing their raw data in their cloud under any circumstances."
www.theregister.com/2025/08/28/grafanas_tom_wilkie_interv… -
Grafana
@grafana
"A good #byoc solution will support zero-access from the vendor accessing their raw data in their cloud under any circumstances." - @tom_wilkie
Here's what to know about BYOC and sovereignty + privacy issues.
Via @TheRegister
www.theregister.com/2025/08/28/grafanas_tom_wilkie_interv… -
Grafana
@grafana
📣The first-ever Grafana Labs Partner Summit 2025 is here!
Join us on Oct 7 for:
⚡Strategy insights from Grafana Labs leadership
⚡Updates on our Partner Program
⚡Real-world success stories + inaugural Partner Awards 🏆
Register in your preferred time zone 👇 -
Grafana
@grafana
🎙 Webinar Sept 4: Learn how to go beyond the basics of #opentelemetry with Grafana.
Get best practices for instrumentation, step-by-step code examples, and see how deeper #otel data helps uncover what’s really happening in production 👇
grafana.com/go/webinar/mastering-code-based-instrumentati… -
Grafana reposted
Tracebit
@tracebit_com
🔍 Great to see @grafana sharing their canary token success story - they deployed them across their systems and actually caught a real intrusion‼️
This is exactly the kind of real-world validation we love to see. Security teams want precise alerts that mean something and allow them to catch attacks early.
Props to their security team for sharing this publicly: grafana.com/blog/2025/08/25/canary-tokens-learn-all-about… -
Grafana
@grafana
We are aware of the supply-chain attack targeting Nx, an open source build system: github.com/nrwl/nx/security/advisories/GHSA-cxm3-wv7p-598c
Two Grafana Labs employees were affected by the attack. We have determined that only GitHub OAuth credentials of these employees and no other secrets, systems, customer data, or Grafana Labs data were impacted.
We have validated that the GitHub OAuth credentials were not used; however, we have rotated the impacted credentials of the two affected employees and we continue to monitor the situation. -
Grafana
@grafana
🚨 Alert fatigue is real — and it’s not just engineers.
Grafana’s latest Observability Survey (1,200+ respondents) shows how teams fight it: SLOs, AI/ML for root cause analysis & adaptive alerts.
Watch our Head of Emerging Products break it down 👇
youtu.be/be2OeAE4uI4This media couldn't be displayed. See it on the original post. -
Grafana
@grafana
🏡 Monitoring your #homelab can a real challenge, but it doesn't have to be.
Find out how you can use Grafana Beyla, #ebpf, and #opentelemetry to make homelab observability easy. grafana.com/blog/2025/08/22/how-to-monitor-your-homelab-w… -
Grafana
@grafana
🔍 The placement of canary tokens across our systems helped us spot a recent intrusion and respond quickly.
Learn more about canary tokens, and find out how you can use them to prevent serious security incidents in the future. grafana.com/blog/2025/08/25/canary-tokens-learn-all-about… -
Grafana
@grafana
Grafana Mimir is built to be deployed on #kubernetes, but that's not feasible for everyone.
Learn why you might want to run it on bare metal instead in this blog from Grafana Champion Wilfried Roset. grafana.com/blog/2025/08/22/grafana-mimir-3-reasons-to-ru… -
Grafana
@grafana
🏗️ What goes into building a leading #observability team?
Tune in to the discussion between @StanChart’s Nayan Omar, Jun Hong Choo from iZeno, and Alessio Basso from @AWSCloud to learn about building a culture of continuous learning.
Watch here: www.youtube.com/watch?v=05N8s4ZlKLA&t=294s -
Grafana
@grafana
Visibility might be tough, but your observability team is even tougher.
-
Grafana
@grafana
Saving money 💰 and shaving down MTTR ⏱️? #grafana Cloud understood the assignment.
Read the full 5-star @Gartner_Peer review: gtnr.it/4jBtDE0 -
Grafana
@grafana
📅 Webinar on Aug 27: Getting started with continuous profiling in Grafana Cloud Profiles
🧩 Learn profiling 101, see a live demo + optimize apps w/ traces + performance test data.
Register to join live Q&A or get the recording 👇 grafana.com/go/webinar/getting-started-with-continuous-pr… -
Grafana
@grafana
"Until recently, #prometheus and #opentelemetry had compatibility issues. However, Prometheus now integrates well with OpenTelemetry and remains a core part of the ecosystem." - @bcamerongain from @thenewstack
thenewstack.io/prometheus-and-opentelemetry-just-couldnt-… -
Grafana
@grafana
And built on open standards 🧘
-
Grafana
@grafana
💰 Bring #observability to your sales pipeline!
With the #salesforce Enterprise data source for #grafana, you can visualize and correlate customer data with system metrics, logs, and more — all in a single dashboard.
grafana.com/blog/2025/08/21/visualize-salesforce-data-in-… -
Grafana
@grafana
If you're in the Bay Area and leading observability in your organization, don't miss Observability Sessions in the Bay Area (Sep 23): grafana.com/events/obsessions/2025/bay-area/?src=social2&…
What you'll walk away with:
✅ Proven frameworks for aligning leadership and teams
✅ Strategic roadmaps and engagement models to scale adoption
✅ Insights on connecting observability success to business outcomes -
Grafana
@grafana
🎉 Secrets management is now in public preview in #grafana Cloud!
We’re solving the credential management problem that every growing team faces by delivering:
🔸 Centralized credential storage with enterprise-grade encryption
🔸Reference-based secrets access
🔸Granular access controls
🔸Complete audit trail of secret usage
This highly requested feature is available now for Synthetic Monitoring! grafana.com/blog/2025/08/20/secure-credential-storage-for… -
Grafana
@grafana
🧠 With support for the Model Context Protocol (#mcp) within #grafana Cloud Traces, you can leverage LLM-powered tools like #claude Code to quickly analyze and derive value from your tracing data. grafana.com/blog/2025/08/13/llm-powered-insights-into-you…
-
Grafana
@grafana
💻 Want to get started with Grafana Loki OSS?
Check out this step-by-step blog post by Grafana Champion @RudiMartinsen on how to install it on your virtual machine. There's also steps to install Grafana Alloy and Tempo.
rudimartinsen.com/2025/07/20/install-loki-oss/ -
Grafana
@grafana
📣 Introducing the @AnthropicAI integration for #grafana Cloud!
This new solution lets you get real-time insights into the cost and performance of your #claude LLMs via pre-built dashboards and alerts.
Here's how: grafana.com/blog/2025/08/19/how-to-monitor-claude-usage-a… -
Grafana
@grafana
🔥 Several hot topics for this upcoming #grafana Community Call — all centered around getting the most out of your telemetry with Drilldown, OTel, and more.
Don't miss it!
Syed Usman Ahmad
@usahmad87
Join @grafana Campfire 🔥- Community Call
Topics: "𝗨𝘀𝗶𝗻𝗴 𝗗𝗿𝗶𝗹𝗹𝗱𝗼𝘄𝗻 𝗔𝗽𝗽𝘀"
Date: 𝟐𝟐𝐭𝐡 𝐀𝐮𝐠𝐮𝐬𝐭 2025
Time: 1:00 PM 𝑼𝑻𝑪 (15:00 𝑪𝑬𝑺𝑻)
Link to Live YouTube stream: www.youtube.com/watch?v=DzzF62HGbPk
Ask your questions at: community.grafana.com/t/grafana-campfire-fire-using-the-d…
#grafana #oss -
Grafana reposted
Raj Dutt
@nopzor
super excited about grafana assistant reaching public preview. if you like/use grafana, give us feedback! we think it represents part of a fundamental paradigm shift for observability
Grafana
@grafana
🎉 Grafana Assistant is now in public preview!
It's AI-powered #observability for your stack. Grafana Assistant provides answers and takes action with your dashboards, data sources, and context in mind:
▪️ Investigate issues
▪️ Explore logs, metrics, and traces
▪️ Build and edit dashboards
▪️ Guide onboarding, and more
Learn how Grafana Assistant can help you get onboarded to #grafana: grafana.com/blog/2025/08/14/ai-for-grafana-onboarding-get… -
Grafana
@grafana
🤝 With @deno_land and Grafana Cloud, you can achieve deep insights into your #javascript project without having to manually instrument code or deploy a third-party agent.
Here's how to get started.
grafana.com/blog/2025/08/15/integrating-deno-and-grafana-… -
Grafana reposted
InfluxData
@InfluxDB
Aug. 19: We’re heading to Snowflake's new AI Hub in Menlo Park!
Hear from #influxdb's @suyashcjoshi on real-time anomaly detection with the TIG Stack ⚡ and from Grafana Labs on Grafana Assistant.👇 www.meetup.com/grafana-and-friends-bay-area/events/310013… -
Grafana
@grafana
✌️ Grafana Labs is 2x a Leader in the Gartner® Magic Quadrant™ for Observability Platforms. This year, we placed furthest in Vision.
To the 25M+ users and 5,000+ customers who continue to support our observability vision — thank you.
Download the complimentary report: -
Grafana
@grafana
🧡 We’re honored to be the answer to such an important question — according to The Pragmatic Engineer Survey 2025 by @GergelyOrosz.
Thanks to our community for your continued support and trust in #grafana.
Keep those dashboards coming!
Gergely Orosz
@GergelyOrosz
A product that (almost) everyone uses from mid-sized tech companies and up but I rarely hear talked about: Grafana
In The Pragmatic Engineer 2025 survey, it had more mentions than Cursor, and dominates as the answer to "how do you turn information into graphs"
This is Grafana: -
Grafana
@grafana
🐊 Let's talk about logging with glorious purpose using Loki. Join us for a webinar in the APAC timezone where we'll cover:
▪️ What is Grafana Loki and what it does
▪️ Overview of how Loki works, what makes it different, and what it’s good at
▪️ A demo of new and updated Loki 3.0 features so you can learn how to create metrics from logs and alert on your logs with powerful Prometheus-style alerting rules
grafana.com/go/webinar/getting-started-with-logging-and-g… -
Grafana
@grafana
Welcome to the Grafana Champions squad🎉 Great to have you on board!
Sathpal Singh
@Sathpal07
Honored to be officially recognized as a Grafana Champion 🎯
Today marks a proud milestone in my journey, I’ve been accepted into the prestigious Grafana Champions Programme.
@grafana -
Grafana
@grafana
Webinar on Aug 20: Gain better visibility into your Grafana Cloud usage
Learn how to access, query, and visualize your usage data to make smarter decisions about cost, performance, and scaling.
📅 Reserve your spot: grafana.com/go/webinar/how-to-query-and-visualize-your-gr… -
Grafana
@grafana
💡 AI will likely be integral to #observability in the future.
In this blog, we share the Grafana Labs perspective on the role of #ai in observability and how it's influencing the tools we're building to help our users: grafana.com/blog/2025/08/14/ai-in-observability-at-grafan… -
Grafana
@grafana
🎉 Grafana Assistant is now in public preview!
It's AI-powered #observability for your stack. Grafana Assistant provides answers and takes action with your dashboards, data sources, and context in mind:
▪️ Investigate issues
▪️ Explore logs, metrics, and traces
▪️ Build and edit dashboards
▪️ Guide onboarding, and more
Learn how Grafana Assistant can help you get onboarded to #grafana: grafana.com/blog/2025/08/14/ai-for-grafana-onboarding-get… -
Grafana
@grafana
Grafana Tempo community, we've got a call soon!
Join us today at 9:30 AM PT. We'll chat Grafana Tempo Performance Moonshots and updates on what's new with the #mcp Server!
www.youtube.com/live/88PqxxiqASg -
Grafana
@grafana
🔥 Don't miss the Grafana Pyroscope community call on Aug 14 at 8:00 am Pacific Time!
We'll discuss the new #ebpf profiler in #grafana Alloy as well as new Grafana Pyroscope Source Code Integration UI updates. Tune in here: www.youtube.com/watch?v=E1PjgOfFoDQ -
Grafana
@grafana
📈 We've teamed up with @googlecloud to help accelerate early-stage growth and success!
With the Grafana Labs Startup Program looped in to Startup Perks from Google Cloud, your team can get special discounts and offers to help your startup build, grow, and innovate faster.
Learn more: cloud.google.com/startup/perks -
Grafana
@grafana
The database you use to store all your #grafana objects can be a gold mine of information. See how you can use #sql to get more insights into your usage. grafana.com/blog/2025/08/08/how-to-use-slq-to-learn-more-…
-
Grafana
@grafana
Complexity is the biggest #observability challenge facing Brazilian organizations today, according to a localized version of our Observability Survey.
Read the full analysis (also available in Brazilian Portuguese). grafana.com/blog/2025/08/12/observability-trends-in-brazi… -
Grafana
@grafana
🔭 Our popular #opentelemetry + #grafana webinar is back!
Join us on on Aug 13 to learn how to store and visualize OpenTelemetry data with the Grafana (LGTM) Stack. Led by #otel co-founder Ted Young.
grafana.com/go/webinar/how-to-instrument-apps-with-otel-a… -
Grafana
@grafana
🐉 Game of Traces is here, and #opentelemetry is coming! ⚔️
Try out this grand strategy game to learn the fundamentals of #opentelemetry tracing — and, of course, heroically defend a few kingdoms along the way.
grafana.com/blog/2025/08/11/learn-opentelemetry-tracing-t… -
Grafana
@grafana
Something rare is about to hatch at Grafana Labs... Stay tuned.
-
Grafana
@grafana
😱 We’ve all had that “uh-oh” moment. You press Enter and then gasp, realizing you just deleted something critical.
With the deletion protection feature in Grafana Cloud, you’re fully protected against the accidental deletion of critical resources in your observability stack — so those dreaded moments are a thing of the past: grafana.com/blog/2025/08/07/deletion-protection-in-grafan… -
Grafana
@grafana
From observing your infrastructure to groceries-as-a-service.
Proud to see our customer @Ocado recognized for leveling up grocery automation with robotics + AI.
@verge's @dompreston has the story: www.theverge.com/robot/719880/ocado-online-grocery-automa…
#grafanaeverywhere -
Grafana reposted
Chamod Perera #KubeConNA 🇺🇸
@chamodshehanka
@grafana knows about the Hyderabad Biriyani Assignment 🧡 #kubeconindia
-
Grafana
@grafana
Same powers. New name 🕸️
In case you missed it, Grafana Labs donated Grafana Beyla to the CNCF #opentelemetry Project, under the project name OpenTelemetry eBPF Instrumentation (OBI).
Here's why: grafana.com/blog/2025/05/07/opentelemetry-ebpf-instrument… -
Grafana
@grafana
🤘 Monitoring..? Traces..? #observability...? Yeah we *rock* all that.
Read the full 5-star @Gartner_Peer review: review: gtnr.it/42EsLrf -
Grafana
@grafana
🛰️ @Space_Station observability isn't rocket science. It's #grafana!
Golden Grot Award winner Ruben Fernandez shares everything you can observe with his dashboard: grafana.com/blog/2025/07/18/reaching-for-the-stars-how-a-…
From your cluster to the International Space Station — #grafanaeverywhere.This media couldn't be displayed. See it on the original post. -
Grafana
@grafana
🐦 Missed the early bird deal?
We're now selling 30% discount tickets in limited quantity. Don't miss #observabilitycon 2025 in London.
Join us to learn how to leverage Grafana Cloud as a complete, AI-powered observability solution.
Leave with the strategy and skills to drive real business impact:
◼️ See how agentic #ai is reshaping observability
◼️Learn about the full range of #grafana Cloud solutions
◼️Turn operational data into business outcomes; and more
Register today: grafana.com/events/observabilitycon/?src=x&mdm=social&cam… -
Grafana
@grafana
Congratulations! Glad to have you as a Grafana Champion 🧡
Blueswen
@BlueswenTw
Excited to share that I’ve joined the Grafana Champions program 🎉!
@grafana has been a big part of my work in observability—building dashboards, sharing talks, and exploring new ways to help teams and the community see what matters.
#grafana #grafanachapion -
Grafana
@grafana
🇮🇳 #kubecon India booth S7 is where it's at!
Thanks to those who stopped by yesterday.
Day 2 is just beginning and we're here to answer your questions about #observability and #kubernetes monitoring, showcase cool demos, and send you off with #grafana swag! -
Grafana
@grafana
🤖 What makes AI-powered observability *actually* useful? Join us as we explore this question at #observabilitycon on the Road this year!
Tickets are now on sale, and we're offering a limited number of 30% off tickets.
Here's what you can expect:
◾️ Open #observability best practices with Prometheus and #opentelemetry
◾️ How agentic #ai is reshaping observability
◾️ Observability strategies to drive bigger business impact
◾️ Ask the Experts booth where our engineers will answer your questions
Capacity is limited. Register today: grafana.com/events/observabilitycon-on-the-road/?src=x&md… -
Grafana
@grafana
🔔 We've rebuilt the alert rules list page from the ground up, giving you a faster, more scalable way to manage your alerts.
It's already available in Grafana Cloud, or you can start using it today by downloading the #grafana 12.1 release: grafana.com/blog/2025/08/05/new-in-grafana-alerting-a-fas… -
Grafana reposted
TechBadger
@techbadger_
Metrics, logs and traces using 👇
@grafana Mimir
@grafana Loki
@opentelemetry
#devops #grafana #cloudengineer -
Grafana
@grafana
Meow
KittenzExe
@KittenzExe
why is this cat on my grafana dashboard. who did this
-
Grafana reposted
Silicon Vikings (also on Bluesky and Threads)
@siliconvikings
The story about #sthlmtech @grafana in an interview with co-founder Torkel Ödegaard (@torkelo) via @breakit_se (in Swedish) www.breakit.se/artikel/43811 #nordicmade
-
Grafana reposted
Randy Hamilton
@RandyHamilton
Building a Simple AIOps Monitoring Dashboard With Prometheus and Grafana dzone.com/articles/aiops-monitoring-dashboard-prometheus-…
-
Grafana
@grafana
🔭 We're building on the foundation of #opentelemetry eBPF Instrumentation with the release of Beyla 2.5!
This is the first #beyla release where we’re directly vendoring most of the code from the upstream OpenTelemetry #ebpf Instrumentation repository that #grafana Labs proudly donated earlier this year.
Here's a closer look at the latest updates: grafana.com/blog/2025/08/04/building-on-the-foundation-of… -
Grafana
@grafana
📺 Webinar on Aug 6!
Learn how to scale and secure your logs cost effectively with #grafana Loki — a horizontally scalable, highly available, multi-tenant log aggregation system inspired by #prometheus.
grafana.com/go/webinar/scaling-and-securing-your-logs-wit… -
Grafana
@grafana
📣 Early bird tickets are selling out! Don't miss #observabilitycon 2025: grafana.com/events/observabilitycon/?src=li&mdm=social&ca…
Join us to learn how to leverage Grafana Cloud as a complete, AI-powered #observability solution.
Leave with the strategy and skills to drive real business impact:
◾️ See how agentic #ai is reshaping observability
◾️ Learn about the full range of #grafana Cloud solutions
◾️Turn operational data into business outcomes ◾️Optimize for performance and cost; and more -
Grafana reposted
The New Stack
@thenewstack
Observability is expanding dynamically, broadening how organizations can leverage it for a variety of reasons.
By @bcamerongain feat. @grafana CTO @tom_wilkie thenewstack.io/grafanas-cto-on-the-state-of-the-observabi… -
Grafana
@grafana
A bug introduced in a recent release of the Mimir distributor (part of the open source Mimir project that powers Grafana Cloud Metrics) resulted in a memory corruption issue in Grafana Cloud Metrics.
At this time, we’ve released a patch to fix the issue and all affected customer data has been scrubbed from Grafana Cloud: grafana.com/blog/2025/08/03/grafana-cloud-metrics-memory-… -
Grafana
@grafana
⚒️ Faster fixes, fewer blind spots, open standards. Grafana Cloud’s Application & Frontend Observability give you end-to-end visibility.
Learn how we bring #opentelemetry and #prometheus together to unify metrics, logs, and traces across the full stack, removing proprietary formats and vendor lock-in.
grafana.com/go/webinar/intro-to-application-and-frontend-… -
Grafana
@grafana
🇮🇳 #kubecon India, we can't wait to see you! Stop by our booth (S7) from 6-7 August for live demos and swag, and see our #ebpf-focused talks.
Learn more about #opentelemetry eBPF instrumentation (formerly Grafana Beyla): grafana.com/oss/beyla-ebpf/?mdm=social&src=tw -
Grafana
@grafana
🎉 ICYMI: Grafana Labs is 2x a Leader in the Gartner® Magic Quadrant™ for Observability Platforms. This year, we’re placed furthest in Vision.
Thank you to the 25M+ users and 5,000+ customers who continue to support our #observability vision.
Download the complimentary report: -
Grafana
@grafana
🏕️ Open #observability just works better.
With #grafana Cloud, teams can detect, investigate, and resolve incidents faster. Thanks to #ai, open standards, and integrations with #kubernetes, Salesforce, and more.
See how it all works in this demo of a simulated e-commerce outage: youtu.be/tBjEUUys7YE -
Grafana
@grafana
🔭 Earlier this year, we donated Beyla (now eBPF #opentelemetry) to the #cncf — advancing the reach of #ebpf for those types of metrics that only it can provide.
Read more from @bcamerongain over at @thenewstack.
thenewstack.io/grafanas-ebpf-beyla-future-hinges-on-opent… -
Grafana
@grafana
Grafana Learning Journeys are guided, step-by-step experiences that can help you become a Grafana expert.
In this video, learn why we created #grafana Learning Journeys and how they differ from tutorials and Grot Guides.
youtu.be/5B-vPhqDib8 -
Grafana reposted
-
Grafana
@grafana
Life is just a bunch of data points on a Grafana dashboard.
eigen moomin
@eigen_moomin
you may one day wake up to find yourself transformed into a data point on a grafana dashboard
-
Grafana
@grafana
This is the way.
Akash Singh
@SkySingh04
Bold of you to assume I will be looking at anything but the grafana dashboards in office 😔
-
Grafana reposted
The New Stack
@thenewstack
Observability is expanding dynamically, broadening how organizations can leverage it for a variety of reasons.
By @bcamerongain feat. @grafana CTO @tom_wilkie thenewstack.io/grafanas-cto-on-the-state-of-the-observabi… -
Grafana
@grafana
🚀 Grafana 12.1 is here!
Automate health checks for your Grafana instance now that Grafana Advisor is in public preview.
Plus, new updates to tame alert sprawl, simplify instance management, and make your dashboards feel ✨extra clean✨.
grafana.com/blog/2025/07/28/grafana-12.1-release-all-the-… -
Grafana
@grafana
🍋 When your systems give you lemons, make #observability lemonade with #grafana Cloud.
Read the full 5-star @Gartner_Peer review: gtnr.it/4ivOOqe -
Grafana
@grafana
🔔 Getting started with Grafana Alerting?
This new step-by-step video shows you how to create and receive your first alert: youtu.be/YVhKNbQNNss -
Grafana
@grafana
📣 Exciting news! We've partnered with @Tailscale on a new integration.
Now you can effortlessly query data sources on your tailnet directly from your Grafana Cloud stack using Private Data Source Connect. grafana.com/blog/2025/07/24/securely-query-data-sources-o… -
Grafana
@grafana
📞 Your dashboards called. They want an upgrade. Join us on July 30 to give your dashboards a little extra sparkle.
We'll cover:
🪄 Advanced variables and dynamic panels
📈 Smarter layouts for scale & performance
🤩 Practical design tricks
grafana.com/go/webinar/building-advanced-grafana-dashboar… -
Grafana
@grafana
📣 #observabilitycon 2025 registration tickets are now on sale and we're offering a 50% discount for a limited time!
Join us to learn how to leverage Grafana Cloud as a complete, AI-powered observability solution.
Leave with the strategy and skills to drive real business impact:
◼️ See how agentic #ai is reshaping observability
◼️ Learn about the full range of #grafana Cloud solutions
◼️ Turn operational data into business outcomes
◼️ Optimize for performance and cost; and more
Register today: grafana.com/events/observabilitycon/?src=li&mdm=social&ca… -
Grafana reposted
Syed Usman Ahmad
@usahmad87
💡Join our tomorrows @grafana Campfire🔥Community Call where we will talk about the Grafana MCP Server as how to integrate it into your work environment and learn more from our experts🚀
www.youtube.com/watch?v=6b94tox6Wk0
#grafana #opensource #community #mcp -
Grafana
@grafana
☁️ From deeper insights in #kubernetes Monitoring to a new auto-apply feature in Adaptive Metrics, here are some of the latest and greatest features available in Grafana Cloud. grafana.com/blog/2025/07/23/grafana-cloud-updates-deeper-…
-
Grafana
@grafana
IDDQD
IYKYK 😉
ケン
@rxynrg
In case you missed this absolutely amazing post by @grafana
GUYS, GRAFANA CAN RUN DOOM!!! 🤯
grafana.com/blog/2022/03/31/can-grafana-run-doom/ -
Grafana
@grafana
🔭 Open source has always been core to what we do — which is why we continue to go all in on #opentelemetry.
In this blog, we reflect on what’s top of mind for us when it comes to the project, and how we continue to invest in the OTel community.
grafana.com/blog/2025/07/21/opentelemetry-at-grafana-labs… -
Grafana
@grafana
Our cloud infrastructure monitoring webinar starts in 1 hour!
Learn about:
- The nuances in observing cloud service models
- Strategies for monitoring across multiple cloud providers
#opentelemetry benefits for consistent observability
grafana.com/go/webinar/cloud-infrastructure-monitoring-wi… -
Grafana reposted
-
Grafana reposted
Cyril Tovena 🇪🇺
@Kuqd
Building the Grafana Assistant has been so much fun. Loads of learning we've made along the ways with a world class team.
We're hiring ! -
Grafana reposted
Kai Lentit (e/xcel)
@KaiLentit
If Grafana chart flickered yellow while no one was watching… did latency truly spike?
Kai Lentit (e/xcel)
@KaiLentit
Senior DevOps engineer in 2025
This media couldn't be displayed. See it on the original post. -
Grafana
@grafana
This beauty
Nelson Isioma
@nelson_isioma
Added grafana to my php server, just look at this beauty
-
Grafana reposted
The New Stack
@thenewstack
Observability is expanding dynamically, broadening how organizations can leverage it for a variety of reasons.
By @bcamerongain feat. @grafana CTO @tom_wilkie thenewstack.io/grafanas-cto-on-the-state-of-the-observabi… -
Grafana
@grafana
"If Grafana chart flickered yellow while no one was watching, did the latency truly spike?"
Kai Lentit (e/xcel)
@KaiLentit
Interview with Senior DevOps engineer 2025 [FULL]
This media couldn't be displayed. See it on the original post. -
Grafana
@grafana
Hey San Francisco! 👋
Join us for a free, hands-on workshop on to learn how to monitor your #aws Infrastructure using #grafana Cloud: events.grafana.com/2025-07-30-introtomonitoringaws?mdm=so…
After the workshop, follow us to a networking happy hour at Wayfare Tavern! -
Grafana
@grafana
🔭 This #grafana dashboard tracks the @Space_Station, including its current location, sighting opportunities, and information about the crew on board.
Congratulations to Ruben Fernandez on this 2025 Golden Grot award-winning dashboard! #grafanaeverywhere -
Grafana
@grafana
Hey San Francisco! 👋
Join us for a free, hands-on workshop on to learn how to monitor your #aws Infrastructure using #grafana Cloud: events.grafana.com/2025-07-30-introtomonitoringaws?mdm=so…
After the workshop, follow us to a networking happy hour at Wayfare Tavern! -
Grafana
@grafana
🔥 When life’s a beach, Grafana Labs is your observability paradise. Sending cool vibes to our community across the Northern Hemisphere as we approach peak summer!
-
Grafana
@grafana
An oldie but a goodie, especially if you care about your home air quality.
@geerlingguy built a DIY air quality monitor and used a #grafana dashboard to quantify the indoor contaminants that contributed to health issues: www.youtube.com/watch?v=Cmr5VNALRAg -
Grafana reposted
Kunal Kushwaha
@kunalstwt
I spoke with @tom_wilkie, CTO of @grafana about what it’s like scaling open source projects while building a commercial company around them.
Discussed the challenges, lessons, and what goes on behind the scenes of a tool so many of us use: youtu.be/AKmnXtDOZ_c -
Grafana
@grafana
Agree or disagree?
Check out @kunalstwt's conversation with @tom_wilkie below. ⬇️
Kunal Kushwaha
@kunalstwt
“I don’t think open source is a business model.”
Had a great conversation with @grafana's CTO, Tom, about all things open source and observability.
Full episode drops on my channel next week.This media couldn't be displayed. See it on the original post. -
Grafana
@grafana
You can’t fix what you can’t find. 🔎
The latest update to Kubernetes Monitoring in Grafana Cloud makes it easier to diagnose and resolve cluster issues — with sharper alerts, cleaner metrics, and support for all workload types. grafana.com/blog/2025/07/15/kubernetes-monitoring-backend… -
Grafana
@grafana
From example dashboards to more robust security options, here’s how we’ve enhanced the user experience when visualizing and managing Snowflake metrics in #grafana.
grafana.com/blog/2025/07/16/snowflake-data-visualization-… -
Grafana reposted
Andrew McCalip
@andrewmccalip
Project Bob's dashboard is progressing nicely. The @ArcGISOnline layers you can pull in are wild, showing global satellite based radar and surface current flow. Of course @grafana on the right side with all the craft metrics. Obviously simulated course tracks right now, we haven't launched yet.
The AIS-dispatcher is now configured to broadcast our MMSI to MarineTraffic through @Starlink so observers can verify position reports against the dashboard. I’m preparing a public, read-only @InfluxDB + @Redisinc backend: everyone will be able to follow the metrics in real time while the command channels remain completely isolated. -
Grafana reposted
Rajiv Singh
@therajiv
my first contribution to @grafana tempo replaced jaeger agent with OTLP export support
github.com/grafana/tempo/pull/5058 -
Grafana reposted
Kunal Kushwaha
@kunalstwt
I sit down with Torkel Ödegaard, the creator of Grafana, to talk about the journey of open source, where Grafana is headed, and how AI is playing a role in the future of observability.
youtu.be/f01DJ6h7Bhs -
Grafana reposted
freeCodeCamp.org
@freeCodeCamp
Grafana is an open-source data analytics and visualzation tool that can help you wrangle your data.
And in this tutorial, @LifeofDanEL shows you how to use it.
You'll fetch solar data from Home Assistant, send it to InfluxDB, and customize a Grafana-based monitoring dashboard. -
Grafana reposted
The Last Son of Krypton
@lifeofdanel
Reminder that I built a self hosted energy monitoring Grafana dashboard that's publicly accessible.
Link to it: energy.lifeofdanel.xyz/api/hassio_ingress/7Vj4V16U5AAY4L5…
freeCodeCamp.org
@freeCodeCamp
Grafana is an open-source data analytics and visualzation tool that can help you wrangle your data.
And in this tutorial, @LifeofDanEL shows you how to use it.
You'll fetch solar data from Home Assistant, send it to InfluxDB, and customize a Grafana-based monitoring dashboard. -
Grafana reposted
Kunal Kushwaha
@kunalstwt
I chat with Richard "RichiH" Hartmann, Senior Developer Programs Director at @grafana, at GrafanaCON 2025. We talk about the future of Grafana 12, what’s happening with OpenTelemetry, and how AI is changing the way we monitor systems.
youtu.be/TX0gHiWqAfc -
Grafana reposted
The New Stack
@thenewstack
Observability is expanding dynamically, broadening how organizations can leverage it for a variety of reasons.
By @bcamerongain feat. @grafana CTO @tom_wilkie thenewstack.io/grafanas-cto-on-the-state-of-the-observabi… -
Grafana
@grafana
By tracking Core Web Vitals in Grafana Cloud Frontend Observability, you can deliver a faster, more stable, and more responsive user experience for your web applications. grafana.com/blog/2025/07/14/how-to-analyze-core-web-vital…
-
Grafana
@grafana
🕺🏻 We've made moves!
Grafana Labs is a Leader in the Gartner® Magic Quadrant™ for Observability Platforms for the 2nd year in a row and placed *furthest* in Vision.
Over 25M users and 5,000 customers worldwide trust our observability leadership. Read the report to find out why (no email required): grafana.com/resources/grafana-observability-platforms-gar… -
Grafana reposted
Simon Prickett 🇪🇺| simonprickett.dev
@simon_prickett
I use a Pico W and @CircuitPython to mirror a @grafana gauge to a physical one... I just need to add neopixel backlights and print a custom faceplate. Here it's tracking humidity in one of the rooms in the house, which is sent to Grafana from a @pimoroni Enviro+ and 2nd Pico.
-
Grafana
@grafana
Find out why Microsoft uses Grafana to track metrics, manage incidents, and provide real-time updates to their KPIs. And learn about their open source contribution, which adds innovative authentication capabilities for service providers. grafana.com/blog/2025/07/11/enhancing-authentication-secu…
-
Grafana
@grafana
According to this customer, #grafana Cloud plays a large role in refining their #iot device diagnostics.
Read the full @Gartner_Peer review: gtnr.it/3EiQgON -
Grafana
@grafana
Learn how to integrate Grafana Beyla with Amazon ECS to achieve deep visibility into containerized workloads (no code changes required). grafana.com/blog/2025/07/09/observability-for-containeriz…
-
Grafana
@grafana
Grafana Labs is 2x a Leader in the Gartner® Magic Quadrant™ for Observability Platforms. This year, we’re placed furthest in Vision.
And with 25M+ users and 5k+ customers worldwide, we believe this is a strong validation of our leadership in open and composable observability.
Get the complimentary report – no email required: www.grafana.com/resources/grafana-observability-platforms… -
Grafana
@grafana
Grafana Labs is 2x a Leader in the Gartner® Magic Quadrant™ for Observability Platforms. This year, we’re placed furthest in Vision.
And with 25M+ users and 5k+ customers worldwide, we believe this is a strong validation of our leadership in open and composable observability.
Get the complimentary report – no email required: www.grafana.com/resources/grafana-observability-platforms… -
Grafana
@grafana
With grafana/otel-lgtm, observability is just one command away. Find out why the Docker image, which provides a complete open source OpenTelemetry solution for observability by bundling several key tools, has become a go-to choice for demos, development, and testing.
-
Grafana
@grafana
🪵 Logs piling up? Let’s make sense of them.
Join us on July 9 for a webinar where we’ll walk you through getting started with how #grafana Loki works and updated Loki 3.0 features so you can learn how to create metrics from logs and alert on your logs with powerful #prometheus-style alerting rules.
🔍 RSVP here: grafana.com/go/webinar/getting-started-with-logging-and-g… webinar-getting-started-with-logging-and-grafana-loki&src=x&mdm=social -
Grafana
@grafana
Find out how the EA team streamlined its observability system to make it easier to monitor for errors, crash rates, regressions, external issues, and more. grafana.com/blog/2025/07/07/from-chaos-to-clarity-with-gr…
-
Grafana
@grafana
Paul Dix, co-founder and CTO of InfluxData, discussed the InfluxDB 3 Core release at GrafanaCON 2025, our biggest open source event of the year. Get a recap of the major changes, and watch his talk on-demand for all the details. grafana.com/blog/2025/07/03/influxdb-3-core-a-complete-re…
-
Grafana
@grafana
Metrics, logs, and traces work better together. Learn how the SRE team at food and grocery delivery platform Glovo used Traces Drilldown to dig into their telemetry and find the root cause of a recent incident involving cascading failures. grafana.com/blog/2025/07/01/faster-incident-response-thro…
-
Grafana
@grafana
Learn how we're building agentic systems into Grafana so anyone can use natural language to go places, find things, create dashboards, and ask questions about their data. grafana.com/blog/2025/06/30/going-beyond-ai-chat-response…
-
Grafana
@grafana
We have released updates for the Grafana Image Renderer plugin and Synthetic Monitoring Agent to address a critical vulnerability found in a third-party library. Users who operate the Grafana Image Renderer plugin or have a local installation of the Synthetic Monitoring Agent are advised to update their systems. grafana.com/blog/2025/07/02/grafana-security-update-criti…
-
Grafana
@grafana
🫖 We're bringing the #observability tea to #observabilitycon, and it's piping hot!
Get the scoop on new Grafana Cloud features and #ai tools, swap stories with observability leaders, and leave with strategies to drive real business impact.
🎟️ Sign up now and:
- Get notified on early bird tickets (50% off!)
- Receive a 20% discount if you miss early bird
- Stay in the loop on speakers, sessions, and all the brilliant bits
Come for the insights, stay for the vibes — London’s calling: grafana.com/events/observabilitycon/?var=B&mdm=social&cam… -
Grafana
@grafana
Another glowing review about the #grafana #observability experience ⭐️⭐️⭐️⭐️⭐️
Five stars all around — from product to the technical account management team. We couldn't be happier to see this.
Read the full review on @Gartner_Peer: gtnr.it/3S3ycLq -
Grafana reposted
The New Stack
@thenewstack
Observability is expanding dynamically, broadening how organizations can leverage it for a variety of reasons.
By @bcamerongain feat. @grafana CTO @tom_wilkie thenewstack.io/grafanas-cto-on-the-state-of-the-observabi… -
Grafana
@grafana
⏰ It's the last day to submit your talk to #observabilitycon 2025! Join us in London 7-9 Oct and share your observability story onstage.
Whether you're working on:
- Tracing and profiling
- Observability cost management
- Load testing at scale
- Migrating to OpenTelemetry
...we’re looking for insightful talks from real practitioners like you.
Submit your proposal today: grafana-labs.typeform.com/obscon2025?typeform-source=lnkd.in -
Grafana
@grafana
In @tom_wilkie's conversation with @bcamerongain from @thenewstack, Tom breaks down the key trends shaping the observability space in 2025: thenewstack.io/grafanas-cto-on-the-state-of-the-observabi…
Trends include:
🔄 Consolidation in sprawling toolchains
📦 How #opentelemetry is accelerating vendor-neutral adoption
🧠 Why the new #ai-powered #grafana Assistant got to market quickly -
Grafana
@grafana
#k6 browser checks have entered the chat.
In case you missed it, they're generally available: grafana.com/blog/2025/05/01/monitor-the-full-end-user-exp…
Browser checks allow you to collect frontend web vitals, capture custom performance metrics, and simulate user actions so you can gain an even deeper understanding of performance and availability from your end users’ POV. -
Grafana
@grafana
With our Google Cloud #bigquery data source, you can quickly and easily visualize BigQuery data within your Grafana dashboards — plus so much more.
Here's a closer look at key features, recent updates, and how to get started. grafana.com/blog/2025/06/18/visualize-google-cloud-bigque… -
Grafana
@grafana
🛠️ Troubleshoot faster in #kubernetes Monitoring, restore pipelines in Fleet Management, and more!
Check out all the latest and greatest updates to #grafana Cloud in our monthly roundup. grafana.com/blog/2025/06/25/grafana-cloud-updates-the-lat… -
Grafana reposted
Ajeet Kumar Upadhyay
@ajeetkrup401
🚀 Just dove into Grafana + Prometheus and WOW! 📊
Going from "Is my app even running?" to beautiful real-time dashboards that actually tell you WHY things broke 🔥
Learning curve? Steep but SO worth it. Your future 3AM self will thank you 🌙
#devops #monitoring -
Grafana
@grafana
🏭 "Factories today are often rich in process data, but poor in insights."
Learn how the Factry Historian data source for Grafana helps organizations turn raw sensor data into clear, visual insights — from the shop floor to the boardroom. grafana.com/blog/2025/06/20/how-the-factry-historian-data… -
Grafana reposted
Mat Ryer
@matryer
Grafana Assistant (Cursor for Grafana) uses Grafana visualisations to show you data. It nicely breaks up the wall of text.
Read more: grafana.com/blog/2025/05/07/llm-grafana-assistant/ -
Grafana
@grafana
Using code to manage the #aws Observability app in Grafana Cloud makes everything smoother and more dependable as you grow.
Learn how to take a declarative approach by using #terraform to manage your Grafana Cloud setup alongside your AWS infrastructure: grafana.com/blog/2025/06/24/grafana-cloud-manage-the-aws-… -
Grafana
@grafana
🌏 What's driving #observability across companies in the Asia-Pacific (APAC) region? The results are eye-opening.
In this snippet, #grafana Labs cofounder Anthony Woods breaks down exclusive regional insights from our latest observability survey. Watch the full video: www.youtube.com/watch?v=3UZF96BBgqU
For even more insights, check out the full, global report (no email required): grafana.com/observability-survey/?mdm=social&src=x
Interact with the data in Grafana Play: play.grafana.org/d/feg4yc4qw3wn4b/third-annual-observabil… -
Grafana
@grafana
Want to add animations and epic illustrations to your dashboards?
Canvas Panel has entered the chat. Join the community call on June 27! More info 👇
Syed Usman Ahmad
@usahmad87
@grafana Campfire Community Calls LIVE
Topic: Using Canvas Panel
Date: 27-June-2025
Time: 1:00 UTC (15:00 CEST)
Link to LIVE stream: www.youtube.com/watch?v=zKYZjG_3Axk
Ask you questions (anonymously): docs.google.com/document/d/1zgRTKZuejcK6vGQrHbvlz-1qEuQ70…
#grafana #oss #canvas #panel #dashboards #linux #visualization -
Grafana reposted
Val d’Europe
@LeJourDeVal
The more I use Grafana, the more I love it. @grafana
-
Grafana
@grafana
... and we live for these kind words. Thank you 🙏
Sir Dante ~THE 1st 🔺
@followthypath
We live and breathe our Grafana dashboards.
We monitor everything from CPU cache-miss rates and network packet timestamps to the round-trip time of a "heartbeat" order.
Alerts are predictive, and we aim to know about a potential problem hours before it could ever impact a client portfolio. -
Grafana reposted
SHIMADA Yuta
@yuta1979
今日はkubecon Japan でもらったgrafana labでもらったキーホルダーも一緒
-
Grafana
@grafana
🥹 comments like these 🧡
Sushi
@itsasmolsush
you can build something as simple as dashboards from all your services and do it as gracefully as @grafana does. you can indeed just do things!
-
Grafana
@grafana
3 days left to submit your #cfp to #observabilitycon!
Grafana
@grafana
🇬🇧 Tell your observability story onstage in London! #observabilitycon 2025 is happening 7–9 October, and the #cfp is open until 27 June.
Whether you're working on:
- Tracing and profiling
- Observability cost management
- Load testing at scale
- Migrating to #opentelemetry
...we’re looking for insightful talks from real practitioners like you.
Submit your proposal: grafana-labs.typeform.com/obscon2025 -
Grafana
@grafana
💩 From crappy data to clean insights. Find out how Grant Chase enabled #wastewater observability at the @CityOfMorroBay with the Grafana Stack.
Grant's work was recognized as a 2025 #goldengrot Award winner. Congratulations, Grant!
We're proud to showcase his work in #grafanaeverywhere, a series that spotlights the bold, brilliant, and unexpected ways people use the #grafana Stack to power what's next.
Watch the *full* video, where he talks about how he built out the dashboards using #python: www.youtube.com/watch?v=wucMZ9tb1I0This media couldn't be displayed. See it on the original post. -
Grafana
@grafana
New webinar! If you're hitting the limits of what self-hosted Prometheus can handle, join us on June 25. You'll learn how Grafana Cloud Metrics (powered by Mimir) can help you:
✅ Scale Prometheus with zero operational overhead
✅ Get long-term retention and high availability out of the box
✅ Optimize cardinality to reduce cost
✅ Keep performance predictable at any scale
grafana.com/go/webinar/scaling-and-securing-prometheus-me… -
Grafana
@grafana
Heading to #openo11ysummit & #otelday this week?
Don't miss talks from our Grafanistas, @LisaHJung, creator of the #otel for Beginners series, and 🍃 Tiffany Jernigan, who will show you how to build a practical Spring + Java application in a GenAI context, deploy it on Kubernetes and understand the application's behavior with distributed tracing. -
Grafana
@grafana
🇬🇧 Tell your observability story onstage in London! #observabilitycon 2025 is happening 7–9 October, and the #cfp is open until 27 June.
Whether you're working on:
- Tracing and profiling
- Observability cost management
- Load testing at scale
- Migrating to #opentelemetry
...we’re looking for insightful talks from real practitioners like you.
Submit your proposal: grafana-labs.typeform.com/obscon2025 -
Grafana
@grafana
⛺️ #grafana and #prometheus may be two peas in a pod, but we also have a whole catalogue of plugins. That's why we're The Big Tent!
Check out @usahmad87's interview at JCON 2025 to learn more about our big tent, products, and use cases.
www.youtube.com/watch?v=_5gcOyB5cCA -
Grafana
@grafana
From 💩 data to crystal-clear insights.
When the @CityofMorroBay's new wastewater facility came online, Grant Chase didn’t settle for observing murky data.
Instead, he built a real-time Grafana command center to observe the facility's pumps, sensors, and even the microbes in the basins.
Congratulations for being our 2025 #goldengrot Award winner (professional category), Grant!
🏆 Read about the use case and the award-winning dashboard: grafana.com/blog/2025/06/20/going-with-the-flow-how-one-g… -
Grafana
@grafana
🎉 We're proud to share that we've been recognized on @Inc's Best Workplaces list... for the third year in a row!
This list honors companies that "invest in top-tier benefits, development opportunities, and more." See the full list: www.inc.com/best-workplaces
Did you know that we're hiring? Check out our open positions to find your next career opportunity at Grafana Labs: grafana.com/about/careers/open-positions/ -
Grafana reposted
Jan Fessl
@fessl_jan
Nothing more satisfying than seeing live plots of data while you do your hardware testing. Another project complete!
@grafana -
Grafana
@grafana
⛺️ As part of our efforts to create more purpose-built data sources, we've created a new dedicated #azure Monitor Managed Service for #prometheus plugin that specifically caters to Azure use cases.
grafana.com/blog/2025/06/16/prometheus-data-source-update… -
Grafana
@grafana
Our new and improved metrics forecasting UI in Grafana Cloud, enables you to explore and fine-tune forecasts easier & more intuitively than ever.
See how it can help you go from reactive to proactive. grafana.com/blog/2025/06/16/adaptive-alerting-faster-bett… -
Grafana
@grafana
What if you could to tell #kubernetes Monitoring in Grafana Cloud what you wanted, and the system configured collectors based on your choices?
Well, with the latest update to our Kubernetes Monitoring Helm chart, you can do just that: grafana.com/blog/2025/06/17/configure-and-customize-kuber… -
Grafana reposted
Simon Prickett 🇪🇺| simonprickett.dev
@simon_prickett
With minor code changes to try/catch some imports, I have my @grafana @cheerlights notifier working on @pimoroni Stellar and Cosmic Unicorns. Data arrives via MQTT from a Grafana managed alert using the Infinity data source. Code is @micropython using Pimoroni's excellent SDK.
-
Grafana
@grafana
🎤 Have an observability story worth sharing? Now’s your moment. The #observabilitycon 2025 CFP is open! Join us in London this October (8–9) and present your journey in:
✅ OpenTelemetry adoption and innovation
✅ Frontend, infra, or app observability
✅ Load testing, incident response, AIOps, and more
📅 Deadline: 27 June 2025
🔗 Submit here: grafana-labs.typeform.com/obscon2025 -
Grafana
@grafana
🟪 No panel? No data. This is what it sounds like when devs cry.
Luckily, Grafana Assistant can fix it (and can make it purple if you wish). See the demo by @matryer & @Kuqd.
Learn more about AI-powered #observability with #grafana Assistant: grafana.com/blog/2025/05/07/llm-grafana-assistant/?mdm=so…
Sign up for the Private Preview: docs.google.com/forms/d/e/1FAIpQLSfnuw6efbLjQIS-fkt0jt8E4…
See our #ai solutions live at #observabilitycon 2025: grafana.com/events/observabilitycon/?var=A&mdm=social&src… -
Grafana reposted
Simon Prickett 🇪🇺| simonprickett.dev
@simon_prickett
I've been monitoring a couple of rooms iat home with @micropython & @grafana cloud using a
@pimoroni Enviro+ pack on a @raspberrypi
Pico W... anyone else doing similar? Here's a pic of the dashboard, link to the live version is in the README in GitHub: github.com/simonprickett/micropython-team-talk/tree/main/… -
Grafana
@grafana
🧠 Data points per minute (DPM) helps you understand how much data you’re sending—and whether it’s more than you need.
Check out our all-in-one guide to understanding DPM in Grafana Cloud. grafana.com/blog/2025/06/11/data-points-per-minute-in-gra… -
Grafana
@grafana
📣 We're honored to be named to the @sdtimes 100 for pushing observability forward.
From #opentelemetry instrumentation and #kubernetes monitoring to AI-powered insights, we’re building the tools that help teams see everything.
#observability is only getting more powerful, and we’re thrilled to be recognized for it!
Thank you to our community for making it all possible 🧡
#sdtimes100 -
Grafana
@grafana
⚠️ In case you missed it — for those impacted by CVE-2025-4123 and CVE-2025-3580, we recommend that you install the newly released versions.
Grafana
@grafana
🚨 We've released Grafana 12.0.1, 11.6.2, 11.5.5, 11.4.5, 11.3.7, 11.2.10, and 10.4.19, which include medium and high severity security fixes.
If you are affected, we recommend that you install newly released versions. grafana.com/blog/2025/05/23/grafana-security-release-medi… -
Grafana reposted
Simon Prickett 🇪🇺| simonprickett.dev
@simon_prickett
I have been learning about @grafana alerts by building an MQTT driven Cheerlights alerter using a @Pimoroni Stellar Unicorn and @micropython . Work in progress… it goes with a companion Grafana dashboard too.
-
Grafana reposted
VOID
@k1h_tech
GrafanaがKubernetesとか以外にも使えるよってことで、Purusaのデータを可視化してるらしい
面白い🤣うちのK1Cでもやろうかな -
Grafana
@grafana
Why does Moana's logo look similar to ours?
Aditya
@adimail2404
why does grafana logo looks similar to moana?
-
Grafana reposted
Anubrat
@anxbrt
Thought Grafana was for monitoring servers. Saw it running a hospital queue. What’s next, tracking chai orders? ☕📊 #devopseverywhere @grafana
-
Grafana reposted
Grafana Japan
@grafanaJP
.@grafana has a booth at #kubecon too!
Please come check us out!
#grafanajp -
Grafana
@grafana
🇯🇵 Organizations in Japan prioritize cost controls and ease of use when it comes to #observability, according to our latest survey.
See all of the results, and how they compare to the responses from Asia and the rest of the world via our third annual Observability Survey. -
Grafana
@grafana
🤝 The power of the #grafana community + the LGTM Stack = exemplary #observability.
Read the full 5-star review on @Gartner_Peer: gtnr.it/4jETwme -
Grafana
@grafana
💨 Grafana Tempo 2.8 is here!
Learn about the latest #traceql features and performance improvements in the open source and high-scale distributed tracing backend. grafana.com/blog/2025/06/12/grafana-tempo-2.8-release-mem… -
Grafana
@grafana
🇳🇱 Observability Sessions is coming to Amsterdam on 18 Jun! This is a half-day event of strategic coaching for #observability leaders.
Learn how to drive momentum and maturity in your organization's observability journey and gain strategies for observability success.
Register: grafana.com/events/obsessions -
Grafana
@grafana
📣 We're taking #observabilitycon on the Road after our conference in London 🌍
Register to "Save the Date" to be notified when 30% discount tickets go on sale.
These 1-day events bring the highlights of ObservabilityCON to a city near you. Preview #ai solutions and new LGTM Stack releases, deepen your OSS observability expertise, and leave with actionable strategies to drive bigger business impact.
São Paulo (4 Nov): grafana.com/events/observabilitycon-on-the-road/2025/sao-…
Washington, D.C. (Nov 5): grafana.com/events/observabilitycon-on-the-road/2025/wash…
Dallas (Nov 18): grafana.com/events/observabilitycon-on-the-road/2025/dall…
Madrid (Nov 18): grafana.com/events/observabilitycon-on-the-road/2025/madr… -
Grafana
@grafana
The root cause has been identified and appropriate mitigations have been applied.
Customers should no longer experience performance issues with Grafana Cloud products. We will continue to monitor for recurrence and provide updates accordingly.
See the full status update:
Grafana
@grafana
⚠️ The scope of this incident may be affecting all components in Grafana Cloud regardless of deployment region. This includes Alerting amongst all other products.
Follow the status of this incident here: status.grafana.com/incidents/tbcbcysdgln3 -
Grafana
@grafana
⚠️ The scope of this incident may be affecting all components in Grafana Cloud regardless of deployment region. This includes Alerting amongst all other products.
Follow the status of this incident here: status.grafana.com/incidents/tbcbcysdgln3 -
Grafana
@grafana
🚀 We're excited to introduce Grafana Everywhere — our new video series spotlighting the bold, brilliant, and unexpected ways people use the #grafana Stack to power what’s next.
From everyday wins to moonshot missions, see what happens when #observability is everywhere.
Our first video is out of this world. Learn how Grafana supported the very first successful commercial #moonlanding, achieved by @fireflyspace's Blue Ghost Mission One.
Congratulations to Jesus Charles and the entire Firefly Aerospace team on this incredible accomplishment!This media couldn't be displayed. See it on the original post. -
Grafana
@grafana
🚨 We've released Grafana 12.0.1, 11.6.2, 11.5.5, 11.4.5, 11.3.7, 11.2.10, and 10.4.19, which include medium and high severity security fixes.
If you are affected, we recommend that you install newly released versions. grafana.com/blog/2025/05/23/grafana-security-release-medi… -
Grafana
@grafana
👯♂️ Friends who Grafana together, laundry together.
Here's how Dakota and Cole — two students, friends, and data enthusiasts — built an #observability solution with #timescaledb and #grafana to monitor the laundry facilities in a college dorm. grafana.com/blog/2025/05/16/dashboards-and-detergent-how-… -
Grafana
@grafana
Canadians celebrated Thanksgiving last month and Americans will next week. We are incredibly thankful to our amazing open source community.
What open source software are you most thankful for this year? -
Grafana
@grafana
Today on the blog: A deep dive into relabeling in Prometheus — and why it's essential to your observability strategy. grafana.com/blog/2022/03/21/how-relabeling-in-prometheus-…
-
Grafana
@grafana
🍵 Catch performance issues and understand your Gitea usage patterns with our new Grafana Cloud integration for @giteaio. grafana.com/blog/2022/03/17/managed-self-hosted-git-servi…
-
Grafana
@grafana
Today on the blog: @robertfratto explains Grafana's role in creating a Prometheus Agent mode from the Grafana Agent grafana.com/blog/2021/11/16/why-we-created-a-prometheus-a…
-
Grafana
@grafana
🥳 🐧 Happy 30th birthday, #linux!
Today is the anniversary of Linus Torvalds changing the world by asking the comp.os.minix news group for help with a "hobby" project: a free operating system for 386(486) AT clones! #opensource -
Grafana
@grafana
Weekend plans sorted. @0xMacro gives us a primer on how to #rickroll with Grafana and @PrometheusIO. On the blog: grafana.com/blog/2021/07/30/how-to-use-grafana-and-promet…
-
Grafana
@grafana
The new Grafana Cloud integration for @RabbitMQ is available! Read more on the blog about how you can now easily monitor and alert on core cluster metrics for the popular open source message broker: grafana.com/blog/2021/06/01/monitor-and-alert-on-essentia…
-
Grafana
@grafana
New on the blog: How to use metrics and configurations in Prometheus to help solve remote write issues grafana.com/blog/2021/04/12/how-to-troubleshoot-remote-wr…
-
Grafana
@grafana
On the blog today, read about a variable introduced in the newly released Grafana 7.2 that will help your Prometheus rate queries just work! grafana.com/blog/2020/09/28/new-in-grafana-7.2-__rate_int…
-
Grafana
@grafana
We're live streaming the @PrometheusIO Stockholm meetup - starting soon! www.youtube.com/watch?v=tENtJGvQ7L8
-
Grafana
@grafana
Four @PrometheusIO maintainers will be in town next week, so we'll be hosting the Prometheus Stockholm meetup! Come for to meet and talk to @putadent, @_codesome, @tom_wilkie and Beorn - Wed 28th August: www.meetup.com/Stockholm-metrics-and-monitoring/events/26…
-
Grafana
@grafana
Jacqui & Eldin can’t wait to show you how easy it is to create beautiful dashboards from MySQL data and 40+ other data sources. Swing by our booth and say hi! #perconalive
-
Grafana
@grafana
Super Duper Exciting News! Grafana v5.0 feature branch has been merged to master and is available in nightly builds featuring new Grid Layout Engine, Dashboard Folders and Foundational UX improvements. Here is a demo video youtu.be/BC_YRNpqj5k